


The aim of this study was to measure epicardial adipose tissue (EAT) and to assess left ventricular (LV) systolic and diastolic function in a healthy population grouped according to the presence of fragmented QRS (fQRS).
MethodsIn this prospective case-control study, the study population consisted of 308 healthy individuals who were divided into two groups according to the existence of fQRS: 180 fQRS(+) individuals (with fQRS), and 128 age- and gender-matched fQRS(-) individuals (without fQRS). These individuals were assessed for EAT thickness and subclinical myocardial dysfunction using transthoracic echocardiography including strain imaging.
ResultsThe baseline clinical characteristics were similar between groups. EAT thickness was significantly increased in fQRS(+) individuals (0.59 vs. 0.44 mm, p<0.001). LV global longitudinal strain, reflecting systolic function (19.62±3.05 vs. 20.95±2.36, p<0.001) and E/A ratio, reflecting diastolic function (0.95±0.30 vs. 1.10±0.37, p<0.001), were decreased, revealing subclinical myocardial dysfunction, in fQRS(+) individuals.
ConclusionsThe presence of fQRS on the admission ECG is associated with increased EAT and pronounced subclinical LV systolic and diastolic dysfunction in a healthy population. Further studies with larger patient groups are needed to clarify the exact pathophysiological mechanisms underlying these findings in healthy populations.
Medir o tecido adiposo epicárdico (EAT) e avaliar as funções sistólica e diastólica do ventrículo esquerdo (VE) numa população saudável segundo a presença de QRS fragmentados (fQRS).
MétodosNeste estudo caso-controle prospetivo participaram 308 indivíduos saudáveis. A amostra foi dividida em dois grupos de acordo com a existência de fQRS; 180 fQRS (+) versus 128 fQRS (-) emparelhados por idade e sexo. Os indivíduos foram avaliados segundo a espessura do EAT e a disfunção miocárdica subclínica por ecocardiografia transtorácica, inclusive imagens de deformação miocárdica (strain).
ResultadosAs características clínicas basais foram semelhantes entre os grupos. A espessura do EAT estava significativamente aumentada nos indivíduos fQRS (+) (0,59 versus 0,44 mm, p<0,001). A deformação longitudinal global do VE que caracterizou a função sistólica (19,62±3,05 versus 20,95±2,36, p<0,001) e a relação E/A, um parâmetro da função diastólica (0,95±0,30 versus 1,10±0,37, p<0,001), estavam diminuídas e traduziram disfunção miocárdica subclínica no grupo de indivíduos fQRS (+).
ConclusõesA presença no eletrocardiograma de admissão de QRS fragmentados está associada ao aumento do tecido adiposo epicárdico e à disfunção sistólica e diastólica subclínica do ventrículo esquerdo na população saudável. Para caracterizar os mecanismos fisiopatológicos subjacentes a esses factos numa população saudável são necessários outros estudos com grupos de participantes mais numerosos.
Fragmented QRS (fQRS) is a readily available finding on the electrocardiogram (ECG) which can be easily used in clinical practice. It is typically defined as notching in the R or S waves in the absence of bundle branch block or as an additional RSR’ pattern in the original QRS wave (with a duration of <120 ms). fQRS develops as a result of heterogeneous electrical activation caused by disrupted ventricular depolarization. It is an electrocardiographic marker of myocardial fibrosis or scar tissue and has been associated with worse prognosis.1,2 Additionally, fQRS has been associated with increased sudden cardiac death in patients with idiopathic dilated cardiomyopathy and heart failure.3,4
Epicardial adipose tissue (EAT) is the visceral fat depot covering the heart5 and can be measured with several imaging techniques including echocardiography, cardiac magnetic resonance imaging, or multidetector computed tomography.6 EAT thickness and volume have been associated with the severity and extent of atherosclerotic coronary artery disease.7–11 Increased EAT thickness is also strongly associated with increased cardiovascular disease, visceral obesity, subclinical atherosclerosis at multiple locations, and the metabolic syndrome,12–16 and is a useful parameter in predicting adverse cardiovascular events.17,18
Two-dimensional (2D) speckle tracking echocardiography (STE) enables detailed assessment of myocardial function, both systolic and diastolic, and is particularly useful for assessment of subclinical left ventricular (LV) dysfunction in patients with normal LV ejection fraction (LVEF) on conventional echocardiography.19,20
The aim of this study was to measure EAT and to assess LV systolic and diastolic function with STE in a healthy population classified according to the presence of fQRS.
MethodsIn this prospective case-control study, the initial study population consisted of 185 healthy fQRS(+) individuals (with fQRS) on the ECG from a routine screening examination, and a control group of 128 healthy age- and gender-matched fQRS(-) individuals (without fQRS). All of the participants were non-smokers and they were not taking any medication for acute or chronic disease. Five participants were excluded due to imaging problems. All of the 308 participants included in the study had normal sinus rhythm on ECG and echocardiographic images were of adequate quality. The study was approved by the local ethics committee and all participants were informed about the study and their consent was obtained. The following characteristics were recorded for each participant: age, gender, body mass index (BMI) and heart rate, and measurements were taken of 12-hour fasting blood glucose, triglycerides, total cholesterol, high-density (HDL) and low-density lipoprotein (LDL) cholesterol, and creatinine. Standard 12-lead ECGs were taken. Imaging studies were performed of all patients to obtain data from conventional echocardiography, tissue Doppler and STE.
ElectrocardiographyAll patients underwent 12-lead ECG (Cardiofax S, Nihon Kohden, Tokyo, Japan) with a filter range of 0.5-150 Hz, speed of 25 mm/s, and amplitude of 10 mm/mV. A narrow fQRS was defined as notching in an additional R or S wave and fragmentation in a narrow QRS complex (duration <120 ms) in at least two consecutive leads.21 All the ECGs were assessed by two independent cardiologists blinded to the study. Interobserver agreement of 98% and intraobserver agreement of 99% were observed for fQRS.
Two-dimensional and Doppler echocardiographyAll patients underwent echocardiographic assessment using a Philips EPIQ 7 system with a 3.5 MHz transducer with the patient in left lateral position. Throughout the exam, the patients were monitored using standard techniques. Two-dimensional, pulsed and continuous wave, and color Doppler measurements were recorded.22,23 EAT thickness was measured from standard parasternal long-axis view on the right ventricular free wall using the aortic annulus as anatomic reference. Left atrial (LA) diameter (LAD), LV end-diastolic interventricular septal thickness (IVST) and posterior wall thickness (PWT), LV end-diastolic diameter (LVEDD) and end-systolic diameter (LVESD) were measured by M-mode. During apical 4-chamber imaging, the transmitral flow waves (E and A) were measured with flow Doppler and the E/A ratio was calculated. The mitral annular velocity was measured with tissue Doppler imaging. LVEF was calculated by Simpson's method. LA volume was obtained using the modified Simpson's method. LA maximum volume (LAVmax) was obtained at end-systole before mitral valve opening, LA minimum volume (LAVmin) was measured at end-diastole before mitral valve opening, and LA preatrial contraction volume (LAVpre-a) was obtained from the last frame just before mitral valve reopening as the result of LA contraction. All of these parameters were recalculated indexed to body surface area.
Speckle-tracking echocardiography2D images were obtained from apical 2-, 3- and 4-chamber images. All the images were recorded with the patient holding their breath through at least three cardiac cycles at a frame rate of 50-90 frames/s. All the data were transferred to the Philips EPIQ 7 system for analysis. After manual tracing of the endocardial borders for each image, the system software performed automatic tracking. When segment tracking could be applied by the software, the data were recorded. Images which could not be analyzed automatically were corrected manually and segments which could not be acquired either automatically or manually were excluded. LV strain (LVS) was assessed using 2-, 3- and 4-chamber images. LV global longitudinal strain (GLS) was calculated as the arithmetic mean of the three values.
Statistical analysisData analysis was performed using SPSS 22.0 software. Descriptive statistics were expressed as means ± standard deviation (SD) for continuous variables and as percentages for categorical variables. The Student's t test and the Mann-Whitney U-test were applied to analyze significant differences between the groups. Direct relationships between continuous variables were examined with Pearson's and Spearman's correlation tests. Comparisons of categorical variables were made using the chi-square test. A value of p<0.05 was accepted as statistically significant. Stepwise multivariate linear regression analysis was performed to identify independent predictors of EAT. All variables showing p values <0.05 on univariate analysis were included in the multivariate model.
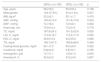
ResultsThe baseline clinical and laboratory characteristics of the QRS(+) and QRS(-) groups are presented in Table 1. There were no statistically significant differences between the two groups in terms of age, gender, BMI, systolic or diastolic blood pressure, heart rate, family history, fasting glucose, total cholesterol, LDL-C, HDL-C or triglycerides, hematocrit, or hemoglobin (p>0.05).
Baseline demographic and clinical characteristics of the fragmented QRS and non-fragmented QRS groups.
| QRS(+) (n=180) | QRS(-) (n=128) | p | |
|---|---|---|---|
| Age, years | 58.2±8.2 | 56.9±8.4 | 0.198 |
| Male gender | 104 (57.8%) | 53 (41.4%) | 0.007 |
| BMI, kg/m2 | 25.2±2.1 | 25.1±1.7 | 0.479 |
| SBP, mmHg | 120.6±13.4 | 121.6±13.6 | 0.524 |
| DBP, mmHg | 74.7±8.4 | 74.5±8.1 | 0.802 |
| Heart rate, min | 72.8±10.2 | 73.2±10. | 0.779 |
| TC, mg/dl | 187.8±24.2 | 191.2±22.6 | 0.825 |
| LDL-C, mg/dl | 113.8±18.7 | 112.2±17.9 | 0.832 |
| HDL-C, mg/dl | 38.8±10.2 | 40.2±9.6 | 0.882 |
| TG, mg/dl | 169.7±67.5 | 168.8±66.6 | 0.908 |
| Fasting blood glucose, mg/dl | 92.1±7.2 | 93.2±6.9 | 0.922 |
| Creatinine, mg/dl | 0.84±0.2 | 0.87±0.1 | 0.765 |
| Hemoglobin, g/dl | 13.7±1.1 | 13.8±1.2 | 0.625 |
| Hematocrit, % | 42.8±4.2 | 43.2±4.6 | 0.807 |
BMI: body mass index; DBP: diastolic blood pressure; HDL-C: high-density lipoprotein cholesterol; LDL-C: low-density lipoprotein cholesterol; QRS(+): fragmented QRS; QRS(-): non-fragmented QRS; SBP: systolic blood pressure; TC: total cholesterol; TG: triglycerides.
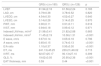
LAD, LVEDD and LVESD, LVEF, IVST, PWT, and LAVmax were similar between the two groups; however, LAVmin and EAT were greater and GLS was significantly decreased in fQRS(+) individuals. The conventional Doppler parameters of diastolic function – E wave, deceleration time, and isovolumetric relaxation time (IVRT) – were similar between the two groups, but the E/A ratio was lower and the A wave was significantly greater in fQRS(+) individuals (Table 2).
Echocardiographic parameters of the fragmented QRS and non-fragmented QRS groups.
| QRS(+) (n=180) | QRS(-) (n=128) | p | |
|---|---|---|---|
| LVEF | 61.94±2.18 | 61.56±2.24 | 0.165 |
| LAD, cm | 3.79±0.38 | 3.78±0.52 | 0.820 |
| LVEDD, cm | 4.54±0.30 | 4.52±0.27 | 0.640 |
| LVESD, cm | 3.14±0.28 | 3.14±0.25 | 0.970 |
| PWT, mm | 0.90±0.11 | 0.91±0.11 | 0.618 |
| IVST, mm | 0.94±0.18 | 0.95±0.12 | 0.971 |
| Indexed LAVmax, ml/m2 | 21.98±3.41 | 21.82±2.88 | 0.665 |
| Indexed LAVmin, ml/m2 | 11.45±2.19 | 10.06±1.31 | <0.001 |
| E wave, cm/s | 0.67±0.14 | 0.65±0.18 | 0.796 |
| A wave, cm/s | 0.65±0.15 | 0.74±0.13 | <0.001 |
| E/A ratio | 1.10±0.37 | 0.95±0.30 | <0.001 |
| DT, ms | 241.13±45.25 | 239.21±46.02 | 0.715 |
| IVRT, ms | 92.67±25.17 | 90.13±27.10 | 0.399 |
| GLS, % | 19.62±3.05 | 20.95±2.36 | <0.001 |
| EAT thickness, mm | 0.59 | 0.44 | <0.001 |
A wave: late diastolic filling; DT: deceleration time; E wave: early diastolic filling; EAT: epicardial adipose tissue; GLS: left ventricular global longitudinal strain; IVRT: isovolumetric relaxation time; IVST: interventricular septal thickness; LAD: left atrial diameter; LAVmax: maximum left atrial volume; LAVmin: minimum left atrial volume; LVEDD: left ventricular end-diastolic diameter; LVEF: left ventricular ejection fraction; LVESD: left ventricular end-systolic diameter; PWT: posterior wall thickness; QRS(+): fragmented QRS; QRS(-): non-fragmented QRS.
EAT thickness was found to be significantly increased in fQRS(+) individuals (Table 2). When Spearman rank correlation analysis was performed between EAT and baseline demographic, clinical and laboratory parameters, EAT was found to be positively correlated with BMI (r=0.195, p=0.009), LVEF (r=0.147, p=0.048), IVRT (r=0.171, p=0.022), and number of fQRS on the ECG (r=0.498, p=0.022) in fQRS(+) individuals (Table 3).
Correlation analysis between epicardial adipose tissue thickness and clinical, laboratory and echocardiographic parameters in fragmented QRS individuals (n=80).
| Variables | r | p |
|---|---|---|
| Age | 0.003 | 0.968 |
| BMI | 0.195 | 0.009 |
| SBP | -0.097 | 0.194 |
| DBP | -0.022 | 0.768 |
| Heart rate | -0.005 | 0.950 |
| TC | 0.068 | 0.368 |
| LDL-C | 0.059 | 0.430 |
| HDL-C | -0.123 | 0.099 |
| TG | 0.145 | 0.052 |
| Fasting glucose | 0.080 | 0.286 |
| Creatinine | -0.021 | 0.779 |
| Hemoglobin | -0.119 | 0.111 |
| Hematocrit | 0.089 | 0.234 |
| LVEF | 0.147 | 0.048 |
| LAD | -0.072 | 0.338 |
| LVEDD | -0.136 | 0.070 |
| LVESD | -0.007 | 0.921 |
| PWT | 0.012 | 0.869 |
| IVST | 0.010 | 0.893 |
| DT | 0.084 | 0.264 |
| IVRT | 0.171 | 0.022 |
| E wave | 0.083 | 0.267 |
| A wave | 0.129 | 0.084 |
| E/A ratio | -0.048 | 0.519 |
| Indexed LAVmax | 0.138 | 0.065 |
| Indexed LAVmin | 0.136 | 0.068 |
| GLS | 0.011 | 0.885 |
| Number of fQRS on ECG | 0.498 | 0.000 |
A wave: late diastolic filling; BMI: body mass index; DBP: diastolic blood pressure; DT: deceleration time; E wave: early diastolic filling; fQRS: fragmented QRS; GLS: left ventricular global longitudinal strain; HDL-C: high-density lipoprotein cholesterol; IVRT: isovolumetric relaxation time; IVST: interventricular septal thickness; LAD: left atrial diameter; LAVmax: maximum left atrial volume; LAVmin: minimum left atrial volume; LDL-C: low-density lipoprotein cholesterol; LVEDD: left ventricular end-diastolic diameter; LVEF: left ventricular ejection fraction; LVESD: left ventricular end-systolic diameter; PWT: posterior wall thickness; SBP: systolic blood pressure; TC: total cholesterol; TG: triglycerides.
On multiple logistic regression analysis, EAT was found to be related to increased age (β=0.002, 95% confidence interval [CI]: 0.001-0.004, p=0.008), number of leads with fQRS on the ECG (β=0.040, 95% CI: 0.030-0.051, p<0.001), and presence of fragmented QRS (β=0.205, 95% CI: 0.142-0.268, p<0.001) (Table 4).
Independent predictors of increased epicardial adipose tissue thickness on multiple linear regression analysis.
| β coefficient | SE | 95% CI | p | |
|---|---|---|---|---|
| Age | 0.002 | 0.001 | 0.001-0.004 | 0.008 |
| BMI | 0.003 | 0.003 | -0.003-0.009 | 0.372 |
| SBP | 0.000 | 0.001 | -0.002-0.001 | 0.674 |
| DBP | 0.000 | 0.001 | -0.002-0.002 | 0.955 |
| Heart rate | 0.000 | 0.001 | -0.001-0.002 | 0.698 |
| TC | 0.000 | 0.001 | -0.002-0.001 | 0.849 |
| LDL-C | 0.000 | 0.001 | -0.001-0.002 | 0.657 |
| HDL-C | 0.000 | 0.001 | -0.003-0.002 | 0.684 |
| TG | 0.000 | 0.001 | 0.000-0.001 | 0.761 |
| Fasting blood glucose | 0.002 | 0.003 | 0.001-0.002 | 0.764 |
| Creatinine | -0.048 | 0.042 | -0.132-0.036 | 0.260 |
| Hemoglobin | -0.002 | 0.006 | -0.014-0.009 | 0.692 |
| Number of fQRS on ECG | 0.040 | 0.005 | 0.030-0.051 | 0.000 |
| Presence of fQRS | 0.205 | 0.032 | 0.142-0.268 | 0.000 |
| LVEF | 0.005 | 0.003 | -0.001-0.010 | 0.105 |
| GLS | 0.004 | 0.003 | -0.001-0.009 | 0.143 |
BMI: body mass index; CI: confidence interval; DBP: diastolic blood pressure; fQRS: fragmented QRS; GLS: left ventricular global longitudinal strain; HDL-C: high-density lipoprotein cholesterol; IVRT: isovolumetric relaxation time; LDL-C: low-density lipoprotein cholesterol; LVEF: left ventricular ejection fraction; PWT: posterior wall thickness; SBP: systolic blood pressure; SE: standard error; TC: total cholesterol; TG: triglycerides.
The present study demonstrated that EAT thickness was significantly increased in the group with fQRS on the admission ECG compared with the control group. To the best of our knowledge, this is the first evidence of this association.
On multivariate analysis, the presence of fQRS was found to be a significant independent predictor of increased EAT thickness after adjustment for other risk parameters. In the present study, we also found for the first time that GLS in healthy individuals with fQRS is lower than in those without fQRS.
fQRS is a simple, inexpensive and readily available noninvasive ECG parameter that can be easily identified by clinicians. In patients with dilated cardiomyopathy, coronary artery disease or heart failure, fQRS indicates myocardial scarring and fibrosis. The prevalence of fQRS in healthy individuals is 7.2%, but it is seen at a higher rate in diseases such as ST-elevation myocardial infarction (21.9%), chronic renal failure (60%), cardiac sarcoidosis (75%), and metabolic syndrome (26.1%).24–27 The finding of fQRS is more frequent in those with myocardial damage.
It has been proposed that EAT influences the development of coronary atherosclerosis owing to its endocrine and paracrine activity, by secreting anti-inflammatory and proinflammatory cytokines and chemokines.28–30 EAT is associated with various forms of atherosclerosis, including the presence and severity of coronary artery disease,7 as well as coronary artery ectasia,31 slow coronary flow,32 metabolic syndrome and diabetes.33 In the current study of a healthy population, EAT thickness in the fQRS(+) group was greater than in the fQRS(-) group. This finding may be related to the development of more extensive fibrosis in the myocardial tissue of these individuals due to the increased release of inflammatory cytokines and chemokines from the thicker EAT. Detailed studies should be performed using magnetic resonance imaging to show the extent of fibrosis in healthy fQRS(+) individuals to better understand the underlying cause of this ECG finding.
The use of more sensitive echocardiographic methods may enable the detection of subclinical LV systolic dysfunction. 2D STE is a quantitative technique to assess myocardial function by analyzing the movement of speckles on 2D gray-scale ultrasound images of the myocardium. It is not user- or angle-dependent and STE parameters are not affected by cardiac motion. STE also provides information on segmental function.34 Previous studies35–39 have shown that it is a useful method for early detection of LV dysfunction in patients with systemic disease. In the current study, GLS in the fQRS(+) group was lower than in the fQRS(-) group. As mentioned above, these findings showing subclinical myocardial dysfunction in fQRS(+) individuals may be also related to the presence of more extensive fibrosis, which disrupts myocardial function, in these individuals. Thus, we can speculate that increased EAT thickness may lead to the development of more extensive fibrosis and hence myocardial dysfunction, which may be demonstrated by the presence of fQRS in 12-lead ECGs in healthy individuals.
Limitations of the studySeveral limitations in our study should be noted. First, the sample size was relatively small. Second, we measured EAT thickness by means of echocardiography, rather than the more precise computed tomography. Third, we did not perform coronary angiography to identify coronary artery disease, which was excluded based on history, electrocardiography, echocardiography (wall motion abnormalities), and exercise stress tests or myocardial single-photon emission computed tomography. Finally, we did not demonstrate the presence of cardiac fibrosis histopathologically or with other imaging modalities.
ConclusionsThe presence of fQRS on the admission ECG is associated with increased EAT thickness and with pronounced subclinical LV systolic and diastolic dysfunction in this healthy population. Further studies with larger patient groups are needed to clarify the exact pathophysiological mechanisms underlying these findings in healthy populations.
Conflicts of interestThe authors have no conflicts of interest to declare.
