


New scores have been developed and validated in the US for in-hospital mortality risk stratification in patients undergoing coronary angioplasty: the National Cardiovascular Data Registry (NCDR) risk score and the Mayo Clinic Risk Score (MCRS). We sought to validate these scores in a European population with acute coronary syndrome (ACS) and to compare their predictive accuracy with that of the GRACE risk score.
MethodsIn a single-center ACS registry of patients undergoing coronary angioplasty, we used the area under the receiver operating characteristic curve (AUC), a graphical representation of observed vs. expected mortality, and net reclassification improvement (NRI)/integrated discrimination improvement (IDI) analysis to compare the scores.
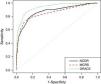
ResultsA total of 2148 consecutive patients were included, mean age 63 years (SD 13), 74% male and 71% with ST-segment elevation ACS. In-hospital mortality was 4.5%. The GRACE score showed the best AUC (0.94, 95% CI 0.91–0.96) compared with NCDR (0.87, 95% CI 0.83–0.91, p=0.0003) and MCRS (0.85, 95% CI 0.81–0.90, p=0.0003). In model calibration analysis, GRACE showed the best predictive power. With GRACE, patients were more often correctly classified than with MCRS (NRI 78.7, 95% CI 59.6–97.7; IDI 0.136, 95% CI 0.073–0.199) or NCDR (NRI 79.2, 95% CI 60.2–98.2; IDI 0.148, 95% CI 0.087–0.209).
ConclusionThe NCDR and Mayo Clinic risk scores are useful for risk stratification of in-hospital mortality in a European population of patients with ACS undergoing coronary angioplasty. However, the GRACE score is still to be preferred.
Foram validados novos scores nos EU para estratificação de risco de mortalidade hospitalar em doentes submetidos a angioplastia coronária: da National Cardiovascular Data Registry (NCDR) e da Mayo Clinic (MC). Procurámos validar estes scores numa população Europeia com Síndrome Coronária Aguda (SCA) e comparar a sua acuidade preditiva com o score de GRACE.
MétodosRegisto de SCA de um único centro de doentes submetidos a angioplastia coronária. Utilizaram-se as curvas Receiver Operating Characteristics (ROC) e a Area Under Curve (AUC), a mortalidade observada e esperada e a análise do Net Reclassification Index (NRI)/Integrated Discrimination Improvement (IDI).
ResultadosForam incluídos 2148 doentes consecutivos. Idade média de 63 (DP 13) anos, 74% do sexo masculino e 71% com SCA com elevação ST. A mortalidade hospitalar foi de 4,5%. O score GRACE foi o que mostrou melhor AUC (0,94, IC 95% 0,91 – 0,96) comparativamente com o NCDR (0,87, IC 95% 0,83 – 0,91, p=0,0003) e o MC (0,85, IC 95% 0,81 – 0,90, p=0,0003). Na análise da calibração, o GRACE mostrou o melhor poder preditivo. Com o score GRACE, os doentes foram mais corretamente classificados comparativamente com o da Mayo Clinic (NRI 78,7, IC 95% 59,6 – 97,7; IDI 0,136, IC 95% 0,073 – 0,199) e NCDR (NRI 79,2, IC 95% 60,2 – 98,2; IDI 0,148, IC 95% 0,087 – 0,209).
ConclusãoOs scores NCDR e MC são úteis na estratificação de risco para mortalidade hospitalar numa população europeia de doentes com SCA submetidos a angioplastia coronária. Contudo, o score GRACE continua a ser o ideal.
Risk stratification is essential in the management of acute coronary syndromes (ACS), particularly in non-ST-elevation ACS. ACS patients are a heterogeneous group of patients in terms of risk, which has important implications for management strategies. Early risk stratification is therefore essential.
The Global Registry of Acute Coronary Events (GRACE) score is the most widely used risk score due to its high predictive accuracy.1 Two groups in the US have developed more recent risk scores for stratification of patients undergoing coronary angioplasty, including patients with ACS.2,3
We sought to validate these US risk scores in a European population of patients with ACS and to compare their predictive accuracy with that of the classical GRACE risk score.
MethodsAll consecutive adult patients (aged ≥18 years) included in a single-center registry on ACS between January 1, 2005 and October 31, 2013 were eligible. This is a continuous, prospective and observational registry. Inclusion criteria were a history of chest pain at rest or other symptoms suggestive of an ACS within 24 hours before admission associated with new or presumed new ECG changes (significant ST-T wave changes or left bundle branch block) and/or dynamic changes in levels of biomarkers of myocardial necrosis. ST-elevation myocardial infarction (STEMI) was defined as persistent (>20 minutes) ST-segment elevation. All other cases were considered non-ST-elevation ACS.
Data were recorded in a database that included demographic, clinical and patient management characteristics, as well as hospital outcome. Hypertension, diabetes and hyperlipidemia were defined as either previously known or on specific therapy. Patients were classified as smokers if they had smoked during the previous six months and were self-reported.
Decisions regarding patient management strategy, including referral for coronary angiography and myocardial revascularization, either by percutaneous coronary intervention (PCI) or by coronary artery bypass grafting (CABG), were left to the discretion of the attending physician. Only patients undergoing PCI were eligible for the present study.
For each patient a score was retrospectively assigned according to the National Cardiovascular Data Registry (NCDR) risk score, the Mayo Clinic risk score (MCRS) and the Global Registry of Acute Coronary Events (GRACE) risk score.1–3
The primary endpoint was all-cause mortality during the index hospitalization.
Other outcomes were also recorded in the study population: stroke/transient ischemic attack (TIA) and major bleeding. Stroke/TIA was defined as the presence of new neurological symptoms with signs of ischemia or bleeding on computed tomography or magnetic resonance imaging. Major bleeding was defined according to the Global Use of Strategies to Open Occluded Coronary Arteries (GUSTO) criteria as intracranial bleeding or bleeding that caused hemodynamic compromise requiring intervention.4
Informed consent was obtained from each patient. The study protocol conforms to the ethical guidelines of the 1975 Declaration of Helsinki and was approved by the institution's human research committee.
Statistical analysisCategorical variables are reported as percentages and continuous variables as means (standard deviation [SD]).
Concerning the variables included in the risk scores, we found missing data in 6.6% of patients for heart rate, 6.3% for systolic blood pressure and 3.7% for creatinine on admission in the study population. Qualitative left ventricular ejection fraction was also missing in 8.3%. A missing values analysis was performed, which showed that these values were missing completely at random, which was confirmed by Little's MCAR test (p=0.137). A multiple imputation technique based on a Markov chain Monte Carlo approach was used to estimate the missing values for each of the missing data points in the study, including death. A primary model included imputed variables, with a secondary model that excluded patients with missing variables to determine the consistency of the general findings with each approach. The imputation of missing values did not change the means of the variables.
Goodness of fit for each model was assessed with the Hosmer-Lemeshow test. In this test, a high (non-significant) p-value indicates that the model is performing well and has a good fit. Since we aimed to compare different models using the same data and predicting the same outcome, we also analyzed and compared pseudo R-squared statistics. A higher pseudo R-squared value indicates which model better predicts the outcome. Discriminative ability was assessed by the area under the ROC (receiver operating characteristic) curve (AUC). The AUC provides a measure of the model's ability to discriminate between subjects who experience the outcome of interest and those who do not. To compare the AUC of each of these models, the method described by DeLong et al. was used.5 Calibration was tested with a comparison of the observed frequencies of patients with the event of interest with the expected frequencies based on the values of the estimated probabilities obtained by the logistic regression models.
Continuous net reclassification improvement (NRI) and integrated discrimination improvement (IDI) indices were also calculated. The net proportion of patients who died (with events) with higher probabilities of death (NRIevents) and of patients who did not die (without events) with lower probabilities of death (NRInonevents) were calculated considering each group of models. NRItotal is the sum of NRIevents and NRInonevents and quantifies the correctness of upward and downward reclassification or movement of predicted probabilities as a result of using a different risk score.6 IDI is a measure of the improvement in prediction and may be viewed as the difference between improvement in average sensitivity and average 1-specificity.6
IBM SPSS Statistics software (version 21, Armonk, NY) was used for all statistical analyses. Model comparisons were made using the R Project for Statistical Computing open source programming language.7–9 All statistical tests were two-sided with a value of 0.05 for statistical significance.
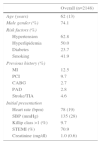
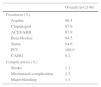
ResultsA total of 2148 patients were included in the present study. Baseline characteristics are detailed in Table 1. Risk factors and previous cardiovascular disease distribution were similar to other studies and ACS registries. There was a predominance of STEMI. Treatment and outcome are presented in Table 2. There were 96 in-hospital deaths (4.5%) in the study sample.
Baseline characteristics of the study population.
| Overall (n=2148) | |
|---|---|
| Age (years) | 62 (13) |
| Male gender (%) | 74.1 |
| Risk factors (%) | |
| Hypertension | 62.8 |
| Hyperlipidemia | 50.0 |
| Diabetes | 23.7 |
| Smoking | 41.9 |
| Previous history (%) | |
| MI | 12.5 |
| PCI | 9.7 |
| CABG | 2.7 |
| PAD | 2.8 |
| Stroke/TIA | 4.6 |
| Initial presentation | |
| Heart rate (bpm) | 78 (19) |
| SBP (mmHg) | 135 (28) |
| Killip class >1 (%) | 9.7 |
| STEMI (%) | 70.9 |
| Creatinine (mg/dl) | 1.0 (0.6) |
CABG: coronary artery bypass grafting; MI: myocardial infarction; PAD: peripheral arterial disease; PCI: percutaneous coronary intervention; SBP: systolic blood pressure; STEMI: ST-elevation myocardial infarction; TIA: transient ischemic attack.
Treatment and complications.
| Overall (n=2148) | |
|---|---|
| Treatment (%) | |
| Aspirin | 99.4 |
| Clopidogrel | 97.9 |
| ACEI/ARB | 87.9 |
| Beta-blocker | 84.5 |
| Statin | 94.6 |
| PCI | 100.0 |
| CABG | 0.2 |
| Complications (%) | |
| Stroke | 1.1 |
| Mechanical complication | 2.3 |
| Major bleeding | 1.1 |
ACEI: angiotensin-converting enzyme inhibitor; ARB: angiotensin receptor blocker; CABG: coronary artery bypass grafting; PCI: percutaneous coronary intervention.
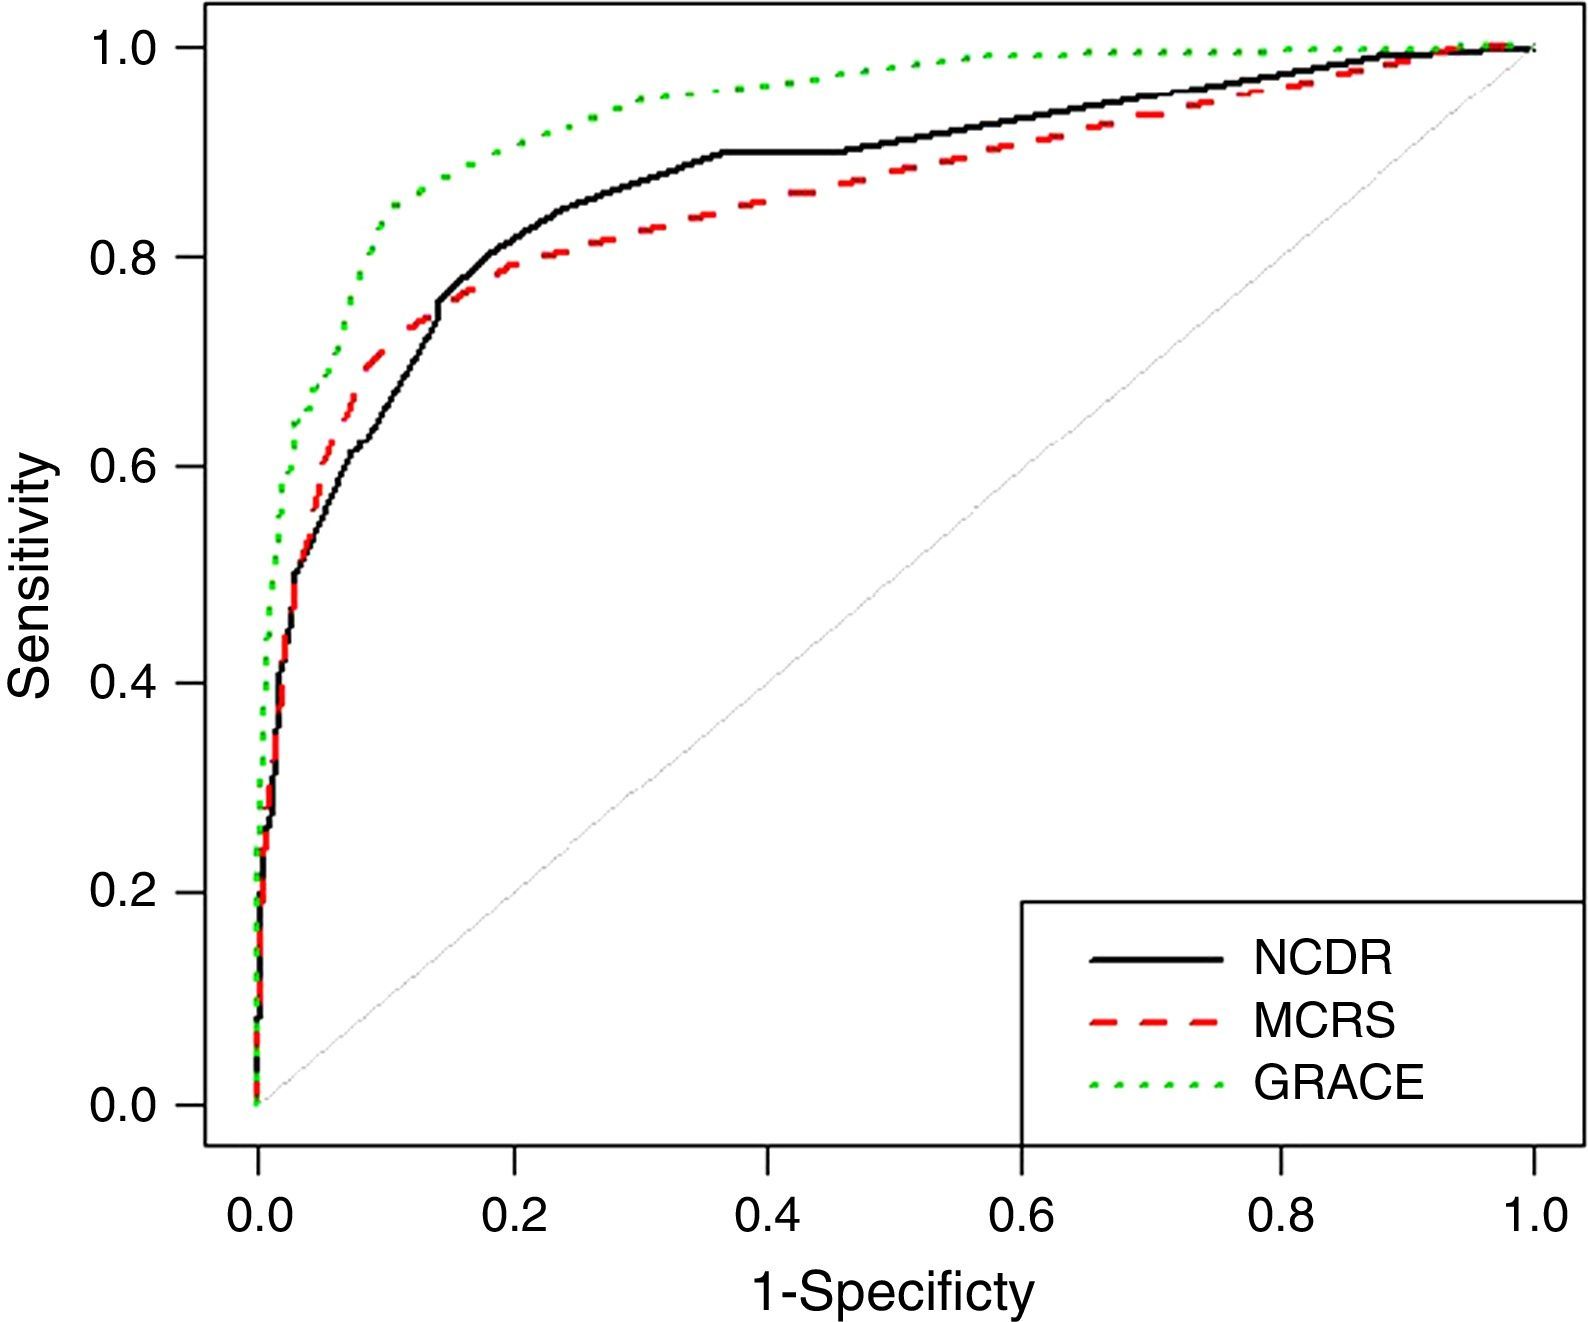
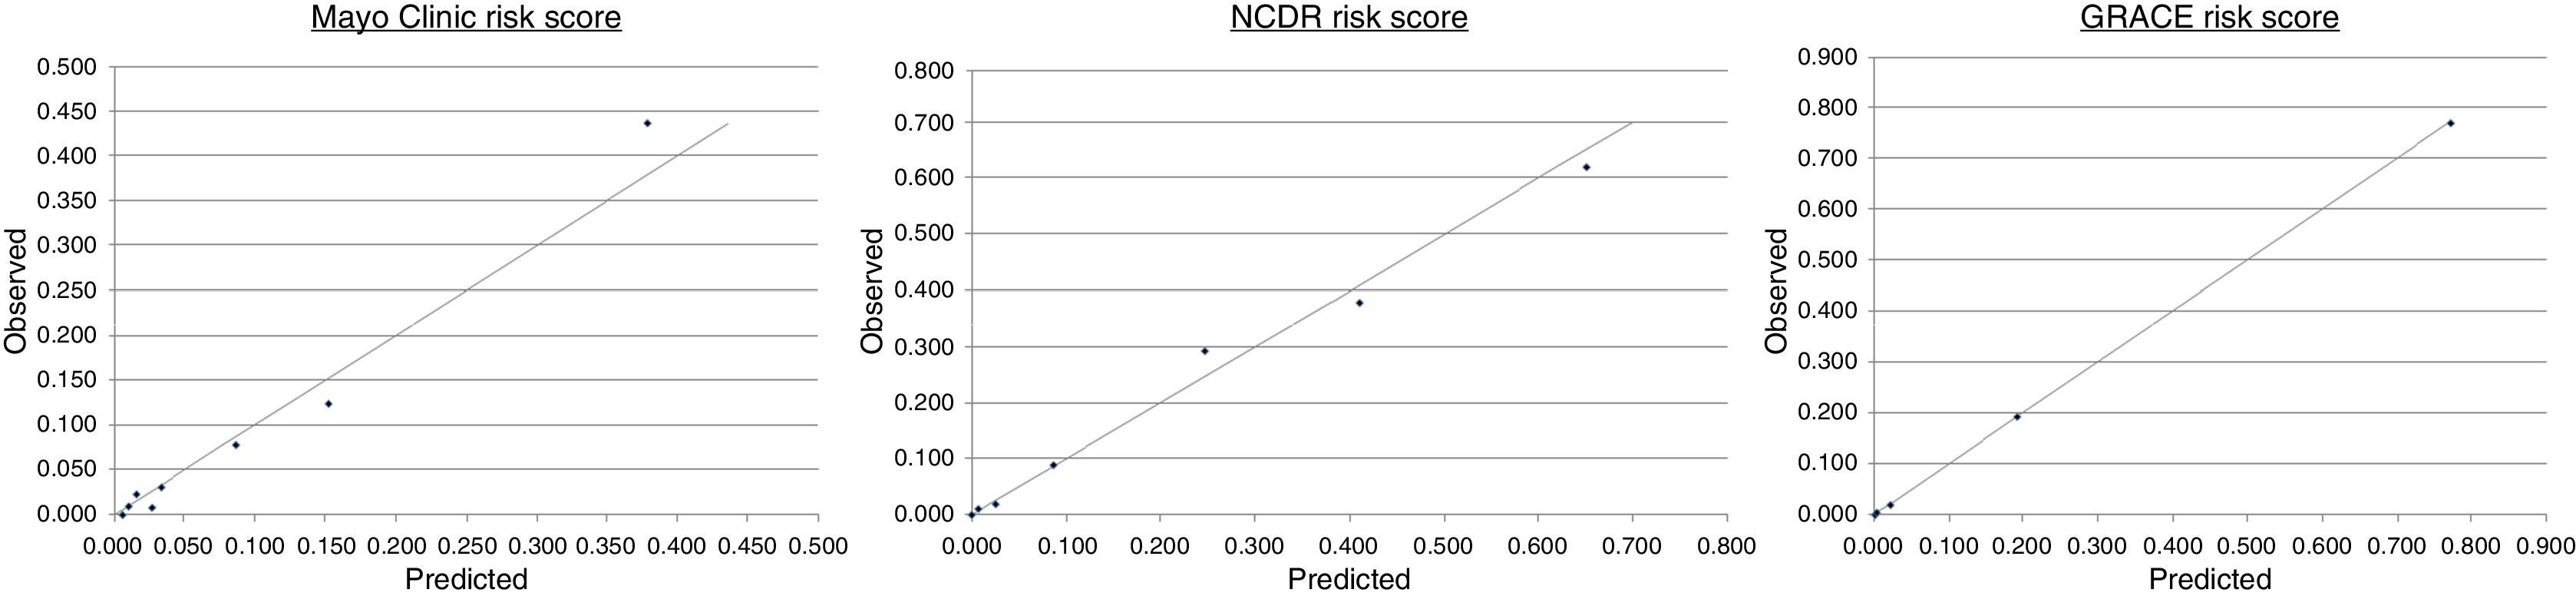
The MCRS showed adequate goodness of fit (p=0.337) and discriminative accuracy (AUC 0.85, 95% confidence interval [CI] 0.81–0.90) (Figure 1). Calibration was also good, except for patients with high scores, in whom predicted mortality was lower than that observed (Figure 2). The NCDR risk score also presented adequate goodness of fit (p=0.474) and good discrimination (AUC 0.87, 95% CI 0.83–0.91). Calibration was almost perfect. Finally, the GRACE risk score also showed adequate goodness of fit (p=0.482) and the highest discriminative ability (AUC 0.94, 95% 0.91–0.96) with excellent calibration. Comparing the GRACE risk score with the other scores, GRACE enabled significantly better reclassification of patients in their risk class, with a NRI >75% (Tables 3 and 4). Pseudo R-squared statistics confirmed that GRACE is the best predictive risk score: GRACE R2=0.497; NCDR R2=0.337; MCRS R2=0.339.
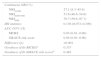
Statistics for model improvement (comparing GRACE and Mayo Clinic risk scores).
| Continuous NRI (%) | |
| NRIevents | 27.1 (8.3–45.9) |
| NRInonevents | 51.6 (48.6–54.6) |
| NRItotal | 78.7 (59.6–97.7) |
| IDI statistics | 0.136 (0.073–0.199) |
| AUC (95% CI) | |
| MCRS | 0.85 (0.81–0.90) |
| GRACE risk score | 0.94 (0.91–0.96) |
| Difference (p) | <0.001 |
| Goodness of fit (MCRS)a | 0.337 |
| Goodness of fit (GRACE risk score)a | 0.482 |
95% confidence intervals are shown in brackets.
AUC: area under the receiver operator characteristic curve; IDI: integrated discrimination improvement; MCRS: Mayo Clinic risk score; NRI: net reclassification improvement.
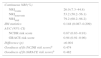
Statistics for model improvement (comparing GRACE and National Cardiovascular Data Registry risk scores).
| Continuous NRI (%) | |
| NRIevents | 26.0 (7.3–44.8) |
| NRInonevents | 53.2 (50.2–56.1) |
| NRItotal | 79.2 (60.2–98.2) |
| IDI statistics | 0.148 (0.087–0.209) |
| AUC (95% CI) | |
| NCDR risk score | 0.87 (0.83–0.91) |
| GRACE risk score | 0.94 (0.91–0.96) |
| Difference (p) | <0.001 |
| Goodness of fit (NCDR risk score)a | 0.474 |
| Goodness of fit (GRACE risk score)a | 0.482 |
95% confidence intervals are shown in brackets.
AUC: area under the receiver operator characteristic curve; CI: confidence interval; IDI: integrated discrimination improvement; NCDR: National Cardiovascular Data Registry; NRI: net reclassification improvement.
Risk stratification is an important step in the management of ACS patients, who are a heterogeneous group in term of characteristics and risk, particularly the subgroup with non-ST-elevation ACS. It is thus essential to perform early risk stratification to optimize decision-making for appropriate management of these patients, including the best time for revascularization and the ideal combination of antithrombotic therapies. Although these treatments improve outcome, they can increase both complications and costs. For this reason, informed decisions are important, and for this risk scores are helpful tools.
Several risk stratification scores for ACS have been published since the 1990s. The first was the TIMI risk scores for STEMI and unstable angina/non-STEMI.10,11 These were developed from cohorts of patients included in randomized clinical trials (RCTs). The later PURSUIT risk score was also based on an RCT, which can limit its application and use because real-world cohorts have different characteristics.12 The GRACE risk score1 was published in 2003, based on the GRACE multicenter ACS registry database that included the whole spectrum of ACS, reflecting a real-world cohort of patients. Due to its high predictive accuracy it is nowadays the most widely used risk score in ACS.13
More recently, both the Mayo Clinic and the National Cardiovascular Data Registry developed risk scores for patients undergoing coronary angioplasty.2,3 Both scores included patients with ACS. Although these US scores were developed from PCI registries, the variables selected were mainly clinical in nature; no angiographic data was used for risk scoring. Thus, the variables selected for these new risk scores are very similar to those used in the GRACE risk score. Both scores have been validated in US populations,14 but not in European populations, particularly in the context of ACS, and so we sought to validate both risk scores and to compare them with the classical GRACE risk score.
All the scores showed moderate predictive accuracy for in-hospital all-cause mortality. However, the GRACE score had the best performance, with significantly better discriminative accuracy as shown by ROC curve analysis. Since ROC curve analysis is considered insufficient to compare different prediction models, it is recommended to perform a reclassification study of one model compared to another. Patient reclassification was better for GRACE according to their observed risk, that is, patients with events were more often correctly reclassified to a higher risk level and patients without events to a lower risk level.
There are several possible explanations for these results. Firstly, the US scores were not developed from cohorts of patients with ACS but from larger registries of patients undergoing PCI. In these study groups, only 25–40% of the patients had ACS.2,3,14 This explains several different clinical characteristics of the patients in both US registries compared to our population of patients with ACS: our population has fewer females, fewer diabetic patients and less previous history of myocardial infarction, PCI, peripheral arterial disease and cerebrovascular disease. There was also a significant proportion of patients with STEMI, which is also an important difference compared to other cohorts of ACS patients. In addition, the scores were developed for medium-term mortality (30-day and 1-year) and we validated them for short-term mortality (in-hospital).
LimitationsOur study has some limitations. Although our study population was obtained from a clinical registry as for the Mayo Clinic, NCDR and GRACE risk scores, the observational and non-randomized nature of the study might limit our conclusions, particularly for other European cohorts with different characteristics. Only patients undergoing PCI were included in the study cohort. Thus our results do not apply to ACS patients who were not revascularized. Furthermore, our study population is somewhat different from other cohorts, particularly its predominance of STEMI patients (70.9%), and thus our results cannot be directly extrapolated to other cohorts.
ConclusionsIn a large European cohort of patients with ACS, the NCDR score and the MCRS are useful for in-hospital mortality risk stratification in patients undergoing PCI. However, the GRACE risk score has the best predictive accuracy and as such it should remain the preferred risk stratification score.
Conflicts of interestThe authors have no conflicts of interest to declare.
