


The role of endothelial dysfunction (ED) in patients with ST-elevation myocardial infarction (STEMI) is poorly understood. Peripheral arterial tonometry (PAT) allows non-invasive evaluation of ED, but has never been used for this purpose early after primary percutaneous coronary intervention (P-PCI). Our purpose was to analyze the relation between ED assessed by PAT and both the presence of microvascular obstruction (MVO) and infarct extension in STEMI patients.
MethodsED was assessed by the reactive hyperemia index (RHI), measured by PAT and defined as RHI <1.67. Infarct extension was assessed by troponin I (TnI) release and contrast-enhanced cardiac magnetic resonance (ceCMR). MVO was assessed by ceCMR and by indirect angiographic and ECG indicators. An echocardiogram was also performed in the first 12 h.
ResultsWe included 38 patients (mean age 60.0±13.7 years, 29 male). Mean RHI was 1.87±0.60 and 16 patients (42.1%) had ED. Peak TnI (median 118 mg/dl, IQR 186 vs. 67/81, p=0.024) and AUC of TnI (median 2305, IQR 2486 vs. 1076/1042, p=0.012) were significantly higher in patients with ED, who also showed a trend for more transmural infarcts (63.6% vs. 22.2%, p=0.06) and larger infarct mass on ceCMR (median 17.5%, IQR 15.4 vs. 10.1/10.3, p=0.08). Left ventricular ejection fraction (LVEF) was lower and wall motion score index (WMSI) was higher on both echocardiogram and ceCMR in patients with ED. On ceCMR, MVO was more frequent in patients with RHI <1.67 (54.5% vs. 11.1%, p=0.03). ECG and angiographic indicators of MVO all showed a trend toward worse results in these patients.
ConclusionsThe presence of ED assessed by PAT 24 h after P-PCI in patients with STEMI is associated with larger infarcts, lower LVEF, higher WMSI and higher prevalence of MVO.
O papel da disfunção endotelial (DE) em doentes com enfarte agudo do miocárdio com elevação do segmento ST (EAMcST) é mal compreendido. A tonometria arterial periférica (TAP) permite avaliar de forma não invasiva a DE, mas nunca foi usada precocemente após intervenção coronária percutânea primária (ICP-P). O nosso objetivo foi avaliar a relação entre a DE avaliada por TAP, a presença de obstrução microvascular (OMV) e a extensão do enfarte (EE) em doentes com EAMcST.
MétodosA DE foi avaliada pelo índice de hiperemia reativa (IHR), obtido por TAP, sendo definida como um valor de IHR <1,67. A EE foi avaliada pela troponina I (TnI) e por ressonância magnética cardíaca com contraste (RMCc). A OMV foi avaliada por RMCc e por indicadores indiretos eletrocardiográficos e angiográficos. Foi ainda efetuado um ecocardiograma nas primeiras 12 horas.
ResultadosForam incluídos 38 doentes (idade média 60,0±13,7 anos, 29 homens). Os valores médios de IHR foram 1,87±0,60 e 16 doentes (42,1%) tinham DE. Os valores máximos (mediana 118/IIQ 186 versus 67/81, p=0,024) e a área sob a curva de TnI (mediana 2305/IIQ 2486 versus 1076/1042, p=0,012) foram significativamente superiores nos doentes com DE, que também mostraram uma tendência para mais enfartes transmurais (63,6 versus 22,2%, p=0,06) e maiores massas de enfarte na RMCc (mediana 17,5/IIQ 15,4 versus 10,1/10,3, p=0,08). Os doentes com DE mostraram valores de fração de ejeção do ventrículo esquerdo (FEVE) significativamente menores e valores do índice de motilidade segmentar (IMS) significativamente maiores, por ecocardiografia e por RMCc. A presença de OMV na RMCc foi mais frequente nos doentes com DE (54,5 versus 11,1%, p=0,03).
ConclusõesA presença de DE avaliada por TAP 24 horas após ICP-P, em doentes com EAMcST, associa-se a enfartes maiores, menor FEVE, maior IMS e maior prevalência de OMV.
acute coronary syndrome
Alberta Provincial Project for Outcome Assessment in Coronary Heart Disease
area under the curve
Bypass Angioplasty Revascularization Investigation
coronary artery disease
contrast-enhanced cardiac magnetic resonance
cardiac resynchronization therapy
corrected TIMI frame count
endothelial dysfunction
global longitudinal strain
interquartile range
left ventricular
left ventricular ejection fraction
index of microcirculatory resistance
microvascular obstruction
nitric oxide
non-ST elevation acute coronary syndrome
primary percutaneous coronary intervention
peripheral arterial tonometry
reactive hyperemia index
ST-elevation myocardial infarction
TIMI myocardial perfusion grade
troponin I
wall motion score index
Notwithstanding all the improvements seen in primary angioplasty programs, with dramatic reductions in the time between symptom onset and intervention, and although normal epicardial coronary artery flow is almost always achieved in a timely fashion after primary percutaneous coronary intervention (P-PCI) in patients with ST-elevation myocardial infarction (STEMI), a significant proportion of patients (between 20% and 60%) have a poor outcome because of microvascular coronary damage.1,2
The negative prognostic implications for the risk of left ventricular (LV) remodeling and of hard endpoints, including death, associated with coronary microvascular damage have been repeatedly confirmed with several invasive and non-invasive indicators.2–13 However, the precise mechanisms underlying coronary microcirculatory dysfunction before and after the restoration of epicardial blood flow are largely unknown and likely to be multifactorial. Traditionally, coronary microvascular dysfunction in this setting is seen as a consequence of the primary epicardial event and/or of coronary reperfusion, either pharmacological (thrombolysis) or mechanical (P-PCI). Mechanical obstruction (due to distal embolization of atherothrombotic debris14), coronary endothelial dysfunction (ED) (mediated by the release of vasoactive factors such as endothelin-1 and tissue factor15) and reperfusion injury (through various mechanisms including platelet and leukocyte accumulation leading to thrombosis, vasoconstriction and release of free oxygen radicals, proteases, and pro-inflammatory mediators, and complement activation leading to the release of histamine and to increased cell permeability, resulting in endothelial cell and myocyte swelling, interstitial edema, and further stimulation of leukocyte adherence16), have all been suggested as mechanisms involved in coronary microvascular dysfunction in STEMI patients.
An alternative explanation is that pre-existing and/or simultaneous coronary microvascular dysfunction may itself have pathophysiological importance and contribute to myocardial infarct extension, LV remodeling and future events.16 Whichever theory of microvascular coronary dysfunction in STEMI patients is correct (cause, consequence or both), endothelial function always seems to be at the core of the proposed mechanisms. There is accumulating evidence that ED is not simply a risk factor and precursor of coronary artery disease (CAD), but also plays a central role in processes leading to acute coronary syndrome (ACS) and STEMI.17 In patients with ACS, endothelial function, measured in the peripheral circulation, has been shown to be an independent predictor of events,18 and subsequent normalization of endothelial function in these patients predicts a lower risk.19,20 Similarly, in STEMI patients treated with P-PCI, peripheral ED was associated with larger infarctions as measured by peak troponin levels,21 and endothelial function improvement six months after the event also correlated with lower end-diastolic LV volumes.22
It is therefore plausible to speculate that previous ED or a blunted reaction of endothelial mechanisms during STEMI may be a central component of coronary microvascular dysfunction in these patients and, as a consequence, a determinant of microvascular reperfusion, infarction extension and LV remodeling. Ideally, this hypothesis would best be proved if endothelial function had been assessed before the myocardial infarction, which clearly is not possible. In fact, most studies assessing endothelial function in ACS patients were performed relatively late (several days or weeks) after the onset of the event.21,23–27 Consequently, the worse results documented in patients with ED may simply be a consequence of larger and more complicated infarcts. Taking peripheral endothelial function (which is much easier to measure) as a surrogate of coronary endothelial function, if the above theory were true we would expect worse acute ED, worse microvascular reperfusion and worse LV remodeling in patients with larger infarcts.
The purpose of this pilot study was to analyze the relation between peripheral endothelial function assessed early (24 h after reperfusion) by peripheral arterial tonometry (PAT), the presence of microvascular obstruction (MVO) and the extent of myocardial infarction.
MethodsPatients admitted with a first STEMI and treated with P-PCI were prospectively included. The inclusion criteria were chest pain lasting at least 20 min and ST-segment elevation of at least 1 mm in two or more contiguous leads; pain-to-balloon time less than 6 h (or 6-12 h if ongoing pain); P-PCI performed successfully on the culprit lesion in a native coronary artery; age over 18 years; and informed consent obtained. Exclusion criteria were previous history of myocardial infarction; left bundle branch block; implanted pacemaker; cardiogenic shock; known myocardial disease and severe LV hypertrophy (>15 mm); previous coronary artery bypass surgery; percutaneous revascularization in the previous three months; contraindication to adenosine; and any serious non-cardiac disease associated with a life expectancy of less than 12 months. The institutional ethics committee approved the study, which was conducted in compliance with the Declaration of Helsinki.
P-PCI and adjuvant treatment were performed according to standard of care for patients with acute STEMI. Endothelial function was assessed 24 h after P-PCI by PAT. Infarct extension was assessed by contrast-enhanced cardiac magnetic resonance (ceCMR) and by the release of troponin I. MVO was assessed by ceCMR and also by indirect indicators, including ST resolution on the electrocardiogram (ECG) and angiographic indicators (corrected TIMI frame count [cTFC], TIMI myocardial perfusion grade [TMPG] and index of microcirculatory resistance [IMR]). Additionally, an echocardiographic exam was performed in the first 12 h after P-PCI.
Assessment of endothelial function – peripheral arterial tonometryEndothelial function was assessed by PAT, using EndoPAT 2000 (Itamar Medical®, Caesarea, Israel). The protocol was the same as followed in previous studies.28 Briefly, a complete digital PAT endothelial function test includes three phases: baseline, occlusion, and hyperemia. A blood pressure cuff is placed on one upper arm (study arm), while the other arm serves as a control (control arm). A PAT probe is positioned on one finger of each hand and set by the computer to inflate to 10 mmHg below diastolic pressure or 70 mmHg (the lower value is selected). Recordings are taken simultaneously from both fingers throughout the study. The response in the control finger not experiencing hyperemia can be used to adjust for systemic effects. After baseline data acquisition, the blood pressure cuff is inflated on one arm to suprasystolic pressures for 5 min. During the occlusion period, signals are absent from the hyperemic finger but continue from the control finger. Following cuff release, pulse amplitude increases in the hyperemic finger. The pulse amplitude recordings are digitized and analyzed by an automated, proprietary algorithm. Average pulse amplitude is calculated for each 30-s interval following cuff occlusion for up to 5 min. As a measure of reactive hyperemia, the reactive hyperemia index (RHI) is then calculated as the ratio of the average amplitude of the PAT signal over a 1-min time interval starting 1 min after cuff deflation divided by the average amplitude of the PAT signal of a 3.5-min time period before cuff inflation (baseline). Subsequently, PAT index values from the study arm are normalized to the control arm. These data are analyzed by a computer in an operator-independent manner. ED was defined as RHI <1.67, as previously described.28
Contrast-enhanced cardiac magnetic resonanceCardiac magnetic resonance was performed in a subset of patients on the 7th-8th day post-MI,29 using a 1.5-T magnetic resonance imaging system (Avanto, Siemens Medical Systems, Erlangen, Germany) equipped with a dedicated cardiac software package and eight available independent radiofrequency receiver channels, cardiac coil, and vectorcardiogram. After acquisition of localizing images, long- and short-axis cine images were obtained, using retrospectively ECG-gated breath-hold segmented K-space balanced steady-state free precession pulse sequences (trueFISP). The short-axis cine scans of 6-mm slices were used to determine LV mass, volume, and function (in-plane resolution 1.6 mm×1.6 mm; gap 2 mm). A short tau inversion recovery (STIR) technique, with triple inversion recovery black-blood turbo-spin echo pulse sequences, was used to quantify edema (area at risk). A bolus of contrast medium (gadopentetate dimeglumine: Magnevist, Schering AG, Berlin, Germany) was injected at a dose of 0.2 mmol/kg. Early enhancement images for assessment of MVO were obtained by acquiring an inversion-recovery segmented gradient echo T1-weighted sequence with a high inversion time (approximately 500 ms) 2-4 min after gadolinium injection. Delayed enhancement images were then obtained by acquiring an inversion-recovery segmented gradient echo T1-weighted sequence, 10-15 min after the bolus. All post-processing and analyses of the area at risk, myocardial infarct size, and presence of MVO were performed using cvi42 version 5 software (Circle Cardiovascular Imaging Inc, Calgary, Canada) by a cardiologist experienced in cardiac magnetic resonance and blinded to all clinical and invasive physiological data. The area at risk was manually quantified on short-axis STIR sequence slices, delineating higher intensity areas (no threshold definition) on each slice, and infarct mass was subsequently computed. Infarct size was also assessed manually by planimetry on each short-axis slice, delineating the hyperenhanced area, including areas of hypoenhancement surrounded by the hyperenhanced area, the latter being considered MVO. Infarct size, as a percentage of LV mass, was computed from the sum of hyperenhanced pixels from each of the 10 short-axis images divided by the total number of pixels within the LV myocardium multiplied by 100.30 MVO mass was also manually quantified as the sum of hypoenhanced pixels on delayed enhancement sequences as better spatial resolution was found than for early enhancement sequences.31
Cardiac biomarkersTroponin I (TnI) values were used to quantify myocardial infarct extent. To this end, blood tests were collected at admission, every 6 h for the first 24 h (i.e. at 0, 6, 12, 18, and 24 h), and every 12 h thereafter until 48 h after admission (i.e. at 36 and 48 h). TnI was measured by LOCI™ sandwich chemiluminescent immunoassay with a Dimension Vista™ Intelligent Lab System (Siemens Healthcare Diagnostics). Peak TnI values and the area under the curve (AUC) of TnI release were calculated, as previously described.32 In order to account for lesion location, these values (AUC of TnI and peak TnI) were indexed to area at risk using the Bypass Angioplasty Revascularization Investigation (BARI) and modified Alberta Provincial Project for Outcome Assessment in Coronary Heart Disease (APPROACH) scores.33
Angiographic indicators of microvascular obstructionAt the end of the P-PCI procedure, a final run of images of the culprit artery was recorded at 30 frames per second (fps), in order to measure TIMI frame count and TIMI perfusion grade. If necessary, the view was adjusted so that the culprit vessel territory was not superimposed. Cine filming was prolonged for at least three cardiac cycles, to ensure that the entire washout phase was included. These two measures of flow were analyzed offline by an operator blinded to other assessments of that patient.
cTFC was measured as the number of frames required for epicardial contrast to reach standardized distal landmarks, as previously described.34 The first frame used for TIMI frame counting was defined as the frame in which a column of dye touched both borders of the coronary artery and moved forward, and the last frame was defined as the frame in which dye began to enter (but not necessarily fill) a standard distal landmark in the artery. These frame counts were corrected for the longer length of the left anterior descending coronary artery by dividing the frame count by 1.7, to arrive at the cTFC.
TMPG was classified according to the standard definition,35 in which grade 3 corresponds to normal entry and exit of dye from the microvasculature (with a ground-glass appearance – ‘blush’ – or opacification of the myocardium in the distribution of the culprit lesion that clears normally, and is either gone or mildly or moderately persistent at the end of the washout phase), and grade 0 corresponds to the failure of the dye to enter the microvasculature.
IMR was measured immediately after P-PCI, as previously described.36,37 A 0.014″ coronary pressure wire (Certus, St. Jude Medical) was calibrated outside the body, equalized to the pressure reading from the guide catheter with the pressure sensor positioned at the ostium of the guiding catheter (after intracoronary administration of 1-2 ml of nitroglycerin), and then advanced to the distal two-thirds of the culprit vessel. Maximal hyperemia was induced using intravenous adenosine (140 μg/kg/min) via a central venous catheter. Approximately 3 ml of room-temperature saline was injected down the culprit vessel, and the hyperemic transit times were recorded and automatically averaged, using the RadiAnalyzer™ Xpress console (St. Jude Medical). Mean distal coronary pressures were recorded during peak hyperemia. IMR was calculated by multiplying the mean distal coronary pressure by the mean hyperemic transit time.
Echocardiographic assessmentAn echocardiogram was performed in the first 12 h, by an operator blinded to the EndoPAT, ECG and angiographic results, using a commercially available ultrasound system (Vivid 7, GE Healthcare). Measurements were performed offline with EchoPAC version 113 (GE Healthcare) by two observers. Parameters were measured several times and then averaged. Echocardiographic quantification of LVEF was determined from 4- and 2-chamber views using semiautomatic border detection based on feature tracking imaging.38 LV regional wall motion analysis was performed and the wall motion score index (WMSI) was calculated by two-dimensional (2D) echocardiography, according to the European Society of Echocardiography recommendations, using the 17-segment model on a scale of 1 to 5: 1 normal, 2 hypokinesia, 3 akinesia, 4 dyskinesia, 5 aneurysmal.39 Mitral inflow was obtained by pulsed wave Doppler echocardiography with the sample volume between the mitral leaflet tips during diastole, and mitral annulus velocities were obtained from the average of the septal and lateral annulus by tissue Doppler imaging. The ratio of early diastolic mitral inflow velocity to early diastolic mitral annular velocity (E/e′) was calculated. Left atrial volumes were obtained by 2D echocardiography and indexed to body surface area. Global LV longitudinal strain (GLS) was assessed using speckle-tracking analysis with automated function imaging. Peak longitudinal strain was defined as the change in length of the myocardium from end-diastole to end-systole and expressed as a percentage: longitudinal strain (%) = (L end-systole - L end-diastole)/L end-diastole × 100, where L is the length of the region of interest. GLS was obtained from 2D grayscale images of apical 4-chamber, 2-chamber, and long-axis views with optimized frame rate (50-90 fps). Software identified the endocardial border, and myocardial motion was automatically tracked in each imaging view. In segments with poor tracking, the observer readjusted the endocardial trace line until better tracking was achieved. The mean of the peak systolic longitudinal strain values from the 17 LV segments was calculated to determine LV GLS.
Statistical analysisContinuous variables are presented as mean ± standard deviation (normal distribution) or as median and interquartile range (IQR) (non-normal distribution); categorical variables are presented as frequencies. All analyses of ED (i.e. RHI <1.67 vs. ≥1.67) were performed using the independent-sample t test for continuous variables with a normal distribution, the Mann-Whitney test for continuous variables with a non-normal distribution, and the chi-square test for categorical variables (with Fisher's correction when applicable). Analysis of RHI as a continuous variable was performed using Pearson's correlation for continuous variables with a normal distribution and Spearman's rho correlation for continuous variables with a non-normal distribution. Statistical tests and corresponding p-values were two-sided and a p value <0.05 was considered statistically significant. IBM SPSS version 21.0 was used for all statistical analyses.
ResultsThirty-eight patients were included (mean age 60.0±13.7 years, 29 male). Mean RHI was 1.87±0.60 and 16 patients (42.1%) had ED (RHI <1.67).
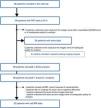
The main characteristics of the study population according to the presence of ED are presented in Table 1. The flowchart of the patient selection process and exams performed in the study is presented in Figure 1.
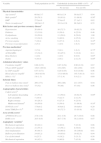
Baseline characteristics of the study population according to the presence of endothelial dysfunction.
| Variable | Total population (n=38) | Endothelial dysfunction (RHI <1.67) | pd | |
|---|---|---|---|---|
| No (n=22) | Yes (n=16) | |||
| Physical characteristics | ||||
| Age (years)a | 60.0±13.7 | 60.1±12.4 | 59.8±15.7 | 0.94 |
| Male genderb | 29 (76.3) | 18 (81.8) | 11 (68.8) | 0.58e |
| BMIa | 27.2±4.0 | 27.4±4.5 | 27.1±3.3 | 0.82 |
| Waist circumferencea | 100.0±11.5 | 101.1±12.6 | 98.5±9.9 | 0.55 |
| Risk factors and previous coronary diseaseb | ||||
| Hypertension | 26 (68.4) | 16 (72.7) | 10 (62.5) | 0.50 |
| Diabetes | 12 (31.6) | 8 (36.4) | 4 (25.0) | 0.46 |
| Dyslipidemia | 19 (50.0) | 11 (50.0) | 8 (50.0) | 1.00 |
| Active smoking | 13 (34.2) | 9 (40.9) | 4 (25.0) | 0.31 |
| Previous angina | 7 (18.4) | 6 (27.3) | 1 (6.3) | 0.22e |
| Previous revascularization | 2 (5.3) | 1 (4.5) | 1 (6.3) | 0.61e |
| Previous medicationb | ||||
| Aspirin/clopidogrel | 3 (7.9) | 2 (9.1) | 1 (6.3) | 0.73e |
| ACEIs/ARBs | 13 (34.2) | 10 (45.5) | 3 (18.8) | 0.11 |
| Beta-blockers | 1 (2.6) | 1 (4.5) | 0 (0.0) | 0.85e |
| Statins | 4 (10.5) | 2 (9.1) | 2 (12.5) | 0.89e |
| Admission laboratory values | ||||
| Creatinine (mg/dl)c | 0.88 (0.32) | 0.87 (0.54) | 0.90 (0.19) | 0.67 |
| NT-pro-BNP (pg/ml)c | 158.5 (305.0) | 154 (365) | 163 (250) | 0.95 |
| hs-CRP (mg(dl)c | 0.57 (0.71) | 0.29 (0.45) | 0.81 (0.98) | 0.06 |
| Blood glucose (mg/dl)c | 136.0 (63.0) | 131.0 (60.0) | 145.5 (81.8) | 0.51 |
| HbA1c (%)c | 5.8 (1.3) | 5.7 (1.4) | 5.9 (2.1) | 0.69 |
| Ischemic times | ||||
| Pain-to-balloon time (min)c | 209 (173) | 209 (186) | 211 (167) | 0.94 |
| Door-to-balloon time (min)c | 75 (52) | 79 (46) | 57 (44) | 0.06 |
| Angiographic characteristics | ||||
| Culprit arteryb | ||||
| Left anterior descending | 21 (53.3) | 11 (50.0) | 10 (62.5) | 0.89e |
| Left circumflex | 7 (18.4) | 5 (22.7) | 2 (12.5) | |
| Right coronary | 10 (26.3) | 6 (27.3) | 4 (25.0) | |
| Multivessel diseaseb | 19 (50.0) | 8 (36.4) | 11 (68.8) | 0.10e |
| SYNTAX scorec | 17.8±6.2 | 16.8±6.2 | 19.0±6.0 | 0.29 |
| Initial TIMI flow 0-1b | 31 (81.6) | 16 (72.7) | 15 (93.8) | 0.22 |
| Area-at-risk scoresc | ||||
| APPROACH score | 27.8 (3.0) | 28.1 (5.0) | 29.7 (10.0) | 0.08 |
| BARI score | 28.5 (6.0) | 26.7 (7.0) | 30.2 (10.0) | 0.07 |
| Angioplasty variablesb | ||||
| Mechanical aspiration | 16 (42.1) | 9 (40.9) | 7 (43.8) | 0.86 |
| Balloon pre-dilatation | 21 (55.3) | 13 (59.1) | 8 (50.0) | 0.58 |
| Stent implantation | 36 (94.7) | 20 (90.9) | 16 (100.0) | 0.61 |
| Balloon post-dilatation | 24 (63.2) | 14 (63.6) | 10 (62.5) | 0.94 |
| Use of abciximab | 9 (23.7) | 4 (18.2) | 5 (31.5) | 0.58 |
| Mechanical aspiration | 16 (42.1) | 9 (40.9) | 7 (43.8) | 0.86 |
ACEIs: angiotensin-converting enzyme inhibitors; APPROACH: modified Alberta Provincial Project for Outcome Assessment in Coronary Heart Disease; ARBs: angiotensin receptor blockers; BARI: Bypass Angioplasty Revascularization Investigation; BMI: body mass index; HbA1c: glycated hemoglobin; hs-CRP: high-sensitivity C-reactive protein; NT-pro-BNP: N-terminal B-type natriuretic peptide.
 ceCMR: contrast-enhanced cardiac magnetic resonance; ECG: electrocardiographic; echo: echocardiographic;
 There were no significant differences between the two groups in physical characteristics, risk factors or previous medication. Admission blood tests were also similar in both populations, except for high-sensitivity C-reactive protein, which showed a tendency for higher values in patients with ED. There were no significant differences in ischemic (pain-to-balloon) time between patients with and without ED, although there was a trend for lower door-to-balloon times in patients with ED. The prevalence of multivessel disease in patients with ED was almost twice that in patients without ED (68.8% vs. 36.4%), although this difference was not statistically significant (p=0.10). SYNTAX score also tended to be higher in patients with ED. There was a clear trend towards greater area at risk, measured by both APPROACH and BARI scores (p=0.08 and 0.07, respectively), and these two scores showed a weak but significant inverse correlation with RHI (r=-0.426, p=0.008 and r=-0.361, p=0.026, respectively). RHI values tended to be lower in patients in whom the left anterior descending artery (LAD) was the culprit vessel (1.74±0.65 vs. 2.02±0.51 in other vessels, p=0.15). Patients with ED also showed a trend for worse initial TIMI score (TIMI 0-1: 93.8% vs. 72.7% in patients without ED). Finally, treatment options (use of mechanical aspiration, stent implantation technique and use of abciximab) were similar in patients with or without RHI <1.67 (Table 1).
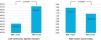
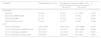
Extent of infarctionBoth peak TnI and the AUC of TnI release were significantly higher in patients with ED (Figure 2). These differences were even more significant when TnI values were indexed to the area at risk, by both the APPROACH and BARI scores (Table 2).
 P-PCI), according to the presence of endothelial dysfunction.
 Troponin I release according to the presence of endothelial dysfunction.
| Variablea,b | Total population (n=38) | Endothelial dysfunction (RHI <1.67) | pc | |
|---|---|---|---|---|
| No (n=22) | Yes (n=16) | |||
| TnI (ng/dl) | ||||
| Peak TnI | 95 (96) | 67 (81) | 118 (186) | 0.024 |
| Peak TnI (APPROACH) | 25 (32) | 17 (20) | 34 (56) | 0.009 |
| Peak TnI (BARI) | 24 (31) | 17 (22) | 33 (47) | 0.008 |
| Peak TnI (both scores) | 24 (31) | 17 (21) | 33 (55) | 0.009 |
| AUC | ||||
| AUC of TnI release | 1293 (1580) | 1076 (1042) | 2305 (2486) | 0.012 |
| AUC of TnI release (APPROACH) | 403 (522) | 315 (303) | 664 (1080) | 0.008 |
| AUC of TnI release (BARI) | 383 (448) | 314 (326) | 618 (799) | 0.007 |
| AUC of TnI release (both scores) | 393 (482) | 314 (300) | 641 (984) | 0.007 |
APPROACH: modified Alberta Provincial Project for Outcome Assessment in Coronary Heart Disease; AUC: area under the curve; BARI: Bypass Angioplasty Revascularization Investigation; TnI: troponin I.
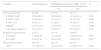
LVEF by echocardiography was significantly lower and WMSI significantly higher in patients with ED (Figure 3). Likewise, GLS was significantly higher in patients with RHI <1.67, although there were no other significant differences in Doppler variables (Table 3).
 RHI <1.67. *independent t test; **Mann-Whitney test;
 Left ventricular ejection fraction (mean ± standard deviation) and wall motion score index (median and interquartile range) assessed by echocardiography, according to the presence of endothelial dysfunction, defined as RHI <1.67. *independent t test; **Mann-Whitney test; RHI: reactive hyperemia index.
Echocardiographic results according to the presence of endothelial dysfunction.
| Variable | Total population | Endothelial dysfunction (RHI <1.67) | pc | |
|---|---|---|---|---|
| No | Yes | |||
| 2D measurements | (n=26) | (n=15) | (n=11) | |
| LVEDV (ml)a | 109.8±23.4 | 106.5±30.2 | 113.8±11.4 | 0.48 |
| LVESV (ml)a | 55.9±12.6 | 51.1±12.3 | 61.7±10.9 | 0.047 |
| LVEF (%)a | 48.6±7.1 | 51.4±4.7 | 45.3±8.3 | 0.045 |
| WMSIb | 1.44 (0.41) | 1.35 (0.47) | 1.77 (0.47) | 0.006 |
| LA volume (ml/m2)a | 36.1±11.0 | 36.7±12.1 | 35.3±10.0 | 0.78 |
| Doppler measurements | (n=21) | (n=11) | (n=10) | |
| E/A ratioa | 1.10±0.40 | 1.17±0.40 | 0.97±0.0.39 | 0.30 |
| E/e′ ratioa | 8.91±3.30 | 8.83±3.91 | 9.05±2.18 | 0.89 |
| 2D speckle tracking | (n=21) | (n=11) | (n=10) | |
| GLSa | -13.16±2.35 | -14.32±1.72 | -11.89±2.35 | 0.014 |
2D: two-dimensional; GLS: global longitudinal strain; LA: left atrial; LVEDV: left ventricular end-diastolic volume; LVEF: left ventricular ejection fraction; LVESV: left ventricular end-systolic volume; WMSI: wall motion score index.
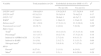
On ceCMR, patients with ED had significantly lower LVEF and higher WMSI, confirming the echocardiographic results. There was a trend for more transmural necrosis (22.2% vs. 63.6%, p=0.06) and greater infarct mass (median value 10.1% vs. 17.5, p=0.08) in patients with RHI <1.67. The percentage of infarct mass indexed to area-at-risk scores (APPROACH and BARI) also tended to be higher in patients with ED (Table 4).
Contrast-enhanced cardiac magnetic resonance results according to the presence of endothelial dysfunction.
| Variable | Total population (n=29) | Endothelial dysfunction (RHI <1.67) | pd | |
|---|---|---|---|---|
| No (n=18) | Yes (n=11) | |||
| LVEDV (ml)a | 138.6±26.9 | 139.2±26.5 | 137.5±28.9 | 0.87 |
| LVESV (ml)a | 63.5±21.0 | 59.3±19.4 | 70.4±22.6 | 0.17 |
| LVEF (%)a | 53.9±8.4 | 56.6±8.1 | 49.5±7.2 | 0.025 |
| WMSIa | 1.37±0.33 | 1.28±0.31 | 1.53±0.32 | 0.05 |
| Edema massb | 19.1 (19.0) | 17.2 (14.1) | 21.2 (28.6) | 0.28 |
| Transmural necrosisc | 12 (38.7) | 4 (22.2) | 7 (63.6) | 0.06e |
| Infarct mass | ||||
| Totalb | 11.6 (9.3) | 10.1 (10.3) | 17.5 (15.4) | 0.08 |
| Percentageb | 11.5 (13.7) | 10.2 (7.6) | 17.5 (21.8) | 0.10 |
| Indexed to APPROACH | 3.2 (7.0) | 2.7 (2.6) | 4.9 (11.5) | 0.10 |
| Indexed to BARI | 3.4 (5.8) | 2.3 (2.7) | 5.1 (11.5) | 0.09 |
| Salvaged massb | 5.0 (14.0) | 5.0 (8.8) | 4.7 (27.6) | 0.87 |
| MVO | ||||
| Presentc | 8 (27.6) | 2 (11.1) | 6 (54.5) | 0.03e |
| Massb | 6.1 (15.5) | 5.3 (-) | 6.8 (20.8) | 0.29 |
APPROACH: modified Alberta Provincial Project for Outcome Assessment in Coronary Heart Disease; BARI: Bypass Angioplasty Revascularization Investigation; LVEDV: left ventricular end-diastolic volume; LVEF: left ventricular ejection fraction; LVESV: left ventricular end-systolic volume; MVO: microvascular obstruction; WMSI: wall motion score index.
ECG resolution of ST elevation was numerically less frequent immediately after PCI (median 60.5% [IQR 72.0%] vs. 76.5% [IQR 41.0%]), and at 90 min after reperfusion (median 69.0% [IQR 53.0%] vs. 78.5 [IQR 28.0]) in patients with ED, although these differences were not statistically significant (p=0.23 and 0.07, respectively). However, residual total ST elevation was significantly higher on both ECGs performed immediately after PCI (median 5.0 mV [IQR 12.0 mV] vs. 2.5 mV [IQR 5.09 mV], p=0.048) and at 90 min (median 3.0 mV [IQR 7.0 mV] vs. 1.3 mV [IQR 4.0 mV]) in patients with RHI <1.67.
All angiographic measures of microvascular dysfunction after STEMI showed important trends towards worse results in patients with RHI <1.67: cTFC was higher (19.5 [IQR 12.0] vs. 16.4 [IQR 7.0], p=0.07) and TMPG 2 or 3 was less frequent (56.3% vs. 86.4%, p=0.09). Likewise, there was a clear trend toward higher values of IMR in patients with ED: median 40.5 (IQR 54.4) vs. 22.0 (IQR 26.0) (p=0.09). The prevalence of microvascular coronary damage, defined as median IMR >24, was almost two times higher in patients with ED (62.5% vs. 36.4%, p=0.11).
ceCMR showed a significant higher proportion of patients with MVO when ED was present (54.5% vs. 11.1%, p=0.03). MVO mass was higher in the group with RHI <1.67 (median 6.8 vs. 5.3), although the difference was not statistically significant.
DiscussionTo our knowledge, this is the first study reporting the relation between peripheral ED measured early (24 h) and microvascular coronary damage and myocardial infarction extension in patients with STEMI treated with P-PCI.
The presence of ED in patients with ACS has been repeatedly demonstrated. Elbaz et al. invasively assessed endothelial function in non-culprit arteries in patients with non-ST elevation acute coronary syndrome (NSTE-ACS) using intracoronary acetylcholine infusion and found that 81% of patients had a blunted response to this endothelium-dependent vasodilator.40 Spiro et al. used flow-mediated dilation and low flow-mediated constriction to demonstrate that endothelial function is significantly more compromised in patients with NSTE-ACS compared to patients with stable CAD, both before and after angioplasty.41 Careri et al. assessed endothelial function in the first 12 h in both stable and NSTE-ACS patients, and showed that flow-mediated dilation is significantly lower in acute patients.20 Finally, we also demonstrated that patients with STEMI treated with P-PCI have a high prevalence of ED as assessed with PAT 3-5 days after the event.21
Importantly, peripheral endothelial function has been shown to relate closely with coronary microvascular dysfunction, using several different techniques42–44 including PAT.45 However, the exact role of peripheral ED (as a surrogate for coronary ED) in the early phase after P-PCI has never been investigated. Testing peripheral endothelial function is particularly challenging in acute patients, for several reasons: in addition to the unpredictable nature of the acute event onset, patients’ unstable condition and the pain, anxiety and fear they usually experience, it is generally impossible to comply with several recommendations for endothelial function assessment, including fasting state, morning exam, avoidance of caffeine or smoking, etc.46 Additionally, our patients were assessed after an arterial puncture (for urgent angiography) and several venous punctures (both for blood tests and for administration of drugs). Finally, the time of day was not the same for all measurements (since it depended on the time of the primary angioplasty), and therefore patients may or may not have been in a fasting state.
Notwithstanding all these potential pitfalls, the RHI results we describe in this population are similar to the values reported by Schoenenberger et al. (1.82±0.48) in the only published study that also measured RHI 24 h after P-PCI in STEMI patients.23 Furthermore, the percentage of patients with RHI <1.67 (42.1%) is consistent with the results observed in all studies that reported this information in the acute/subacute phase of ACS: 47.9% in the study by Yamomoto et al.,25 43.1% in our pilot study21 and 45.0% in the study by Schoenenberger et al.23
Patients with RHI <1.67 had significantly higher values of both peak TnI and AUC of TnI release, both total and indexed to the area-at-risk scores. Correspondingly, they had a three-fold higher risk of transmural necrosis and a clear trend to higher total and percentage infarct mass on ceCMR. In line with these results, they also had lower LVEF and higher (worse) WMSI, both on the initial echocardiogram and on ceCMR.
Similarly, patients with RHI <1.67 had a clear trend towards worse electrocardiographic (particularly residual ST elevation after P-PCI) and angiographic (IMR, cTFC and TMPG) indicators of microvascular reperfusion. Altogether, these data suggest greater damage to the coronary microvasculature in patients with peripheral ED, which is confirmed by the ceCMR results: patients with RHI <1.67 were almost five times more likely to have MVO on ceCMR, and tended to have greater MVO mass.
The fact that patients with ED tended to have more severe CAD (the prevalence of multivessel disease was almost twice as high in patients with ED, and SYNTAX scores also tended to be higher in these patients) is in agreement with our previous work24 and suggests that at least the previous severity of CAD is related to ED. We also found a trend for lower initial TIMI flow in patients with ED, which is in agreement with a recent study by Kandhai-Ragunat et al. These authors documented lower RHI values (although measured 4-6 weeks after STEMI) in patients with an occluded artery before P-PCI, compared with patients with a patent artery (2.08±0.34 vs. 1.75±0.35; p<0.007),26 suggesting that ED may be involved in microvascular reperfusion in STEMI patients.
However, we also found a significant negative correlation between both area-at-risk scores and RHI, and there was a trend for lower RHI in patients in whom the LAD was the culprit artery. Both larger areas at risk and the LAD as culprit artery are associated with larger infarctions, implying that the documented lower RHI values may reflect the extension of the infarction, as opposed to being part of the pathophysiological process that caused it. Indeed, our finding that patients with ED in the first 24 h after STEMI have larger infarcts and lower LVEF is in line with the evidence of neurohumoral activation in patients with heart failure. It has been demonstrated that reduction in stroke volume produces lower endothelial shear stress, which causes dysregulation in gene expression of nitric oxide (NO) synthase isoforms,47,48 leading to reduced NO bioavailability.49 Furthermore, there is an additional reduction in NO bioavailability caused by direct destruction of NO by reactive oxygen species, mainly driven by an increase in angiotensin II and aldosterone activity, and purine metabolism.50
While we cannot infer from our results whether ED was a cause or a consequence of the severity of myocardial infarction, it is reasonable to conclude that peripheral ED in these patients may be a marker of the severity of myocardial disease and therefore of its systemic consequences, which makes it useful to assess the effectiveness of therapy and to predict events, independently of its exact pathophysiological role.
In patients with acute myocardial infarction, early treatment with statins, which are known to reduce events, was initially assessed through their beneficial effect on endothelial function.51,52 Likewise, in heart failure patients, peripheral endothelial function has been described as a tool to predict response to cardiac resynchronization therapy (CRT), and ED improvement after CRT correlates with functional improvement,53 related to an increase in cardiac output,54 likely mediated by shear stress.55
In summary, although it is not possible at this point to determine the exact role of ED in STEMI patients, we demonstrate that its measurement early after P-PCI is feasible and related to infarct extent and MVO, which makes it a valuable tool for identifying high-risk patients and for testing new pharmacological or device-based strategies.
Study limitationsThis study is limited by the small study sample, and larger studies will be necessary to confirm these results. Additionally, the EndoPAT exams were not performed in accordance with recommendations for assessing endothelial function: patients were not fasting, coffee or tea consumption was not excluded and the exam was not necessarily performed in the morning. However, measuring endothelial function in the acute phase was in fact the purpose of the study. Importantly, all the operators performing the EndoPAT assessment were highly trained in this procedure, having participated in several previous studies.
ConclusionsThe presence of ED assessed by PAT at 24 h after P-PCI in patients with STEMI is associated with larger infarcts, lower LVEF, higher WMSI and higher prevalence of MVO.
Ethical disclosuresProtection of human and animal subjectsThe authors declare that no experiments were performed on humans or animals for this study.
Confidentiality of dataThe authors declare that no patient data appear in this article.
Right to privacy and informed consentThe authors declare that no patient data appear in this article.
FundingThe study was sponsored by unrestricted investigational grants from St. Jude Medical™, AstraZeneca, Merck Sharp & Dohme, Medtronic and Cordis.
Conflicts of interestDr. Baptista has received consultancy and speaker fees from St. Jude Medical and AstraZeneca, not related to the present study. Dr. Pedro Farto e Abreu has received consultancy and speaker fees from AstraZeneca and Medtronic, not related to the present study. Prof. Victor Gil has received speaker fees from AstraZeneca and Merck Sharp & Dohme, not related to the present study. The other authors have no conflicts of interest to declare.
