


The cardiorespiratory optimal point (COP) is a novel index, calculated as the minimum oxygen ventilatory equivalent (VE/VO2) obtained during cardiopulmonary exercise testing (CPET). In this study we demonstrate the prognostic value of COP both independently and in combination with maximum oxygen consumption (VO2max) in community-dwelling adults.
MethodsMaximal cycle ergometer CPET was performed in 3331 adults (66% men) aged 40-85 years, healthy (18%) or with chronic disease (81%). COP cut-off values of <22, 22-30, and >30 were selected based on the log-rank test. Risk discrimination was assessed using COP as an independent predictor and combined with VO2max.
ResultsMedian follow-up was 6.4 years (7.1% mortality). Subjects with COP >30 demonstrated increased mortality compared to those with COP <22 (hazard ratio [HR] 6.86, 95% confidence interval [CI] 3.69-12.75, p<0.001). Multivariate analysis including gender, age, body mass index, and the forced expiratory volume in 1 s/vital capacity ratio showed adjusted HR for COP >30 of 3.72 (95% CI 1.98-6.98; p<0.001) and for COP 22-30 of 2.15 (95% CI 1.15-4.03, p<0.001). Combining COP and VO2max data further enhanced risk discrimination.
ConclusionsCOP >30, either independently or in combination with low VO2max, is a good predictor of all-cause mortality in community-dwelling adults (healthy or with chronic disease). COP is a submaximal prognostic index that is simple to obtain and adds to CPET assessment, especially for adults unable or unwilling to achieve maximal exercise.
O ponto ótimo cardiorrespiratório (POC) representa o menor valor do equivalente ventilatório de oxigênio (VE/VO2), obtido durante um teste cardiopulmonar de exercício (TCPE). Neste estudo, demonstramos a utilidade prognóstica do POC de forma independente e associado ao VO2max.
MétodosForam avaliados TCPE máximos em cicloergômetro de 3331 adultos (66% homens) com idades entre 40-85 anos, saudáveis (18%) e com doenças crônicas (81%). Ao POC foram atribuídos pontos de corte para a criação de grupos<22, 22-30 e>30, com base no teste log-rank. As associações de risco foram verificadas por meio de regressões de Cox, utilizando o POC como preditor independente e combinado com VO2max.
ResultadosO seguimento médio foi de 6,4 anos (7,1% das mortes). Indivíduos com POC>30 demonstraram maior mortalidade, em comparação com POC<22; HR=6,86 (intervalo de confiança [IC] 95%=3,69-12,75, p<0,001). A análise multivariada ajustada, incluindo idade, sexo, índice de massa corporal, e a capacidade vital 1-s volume expiratório forçado mostraram HR POC>30 de 3,72 (IC 95%=1,98-6,98; p<0,001) e para a POC 22-30 de 2,15 (IC 95%=1,15-4,03, p<0,001). Combinando POC e VO2max, aumentou-se a discriminação do risco.
ConclusõesO POC>30, de forma independente ou combinado com baixo VO2max, é um bom preditor de mortalidade por todas as causas em adultos (saudáveis ou com doença crónica). Simples de se obter, o POC como índice prognóstico submáximo acrescenta ao TCPE uma nova possibilidade de avaliação de risco de mortalidade, especialmente para adultos incapazes ou não dispostos a alcançar o exercício máximo.
cardiorespiratory optimal point
cardiopulmonary exercise testing
forced expiratory volume in 1 s
forced vital capacity
heart rate
oxygen uptake efficiency slope
ventilatory anaerobic threshold
ventilation
oxygen ventilatory equivalent
oxygen uptake
maximum oxygen uptake
Quantification of gas exchange during exercise with cardiopulmonary exercise testing (CPET) is used in healthy and diseased populations.1–6 Previous studies have indicated the prognostic importance of several CPET ventilatory variables,7 including maximum oxygen uptake (VO2max),8 ventilatory anaerobic threshold (VAT),9 oxygen uptake efficiency slope (OUES)10,11 and ventilatory equivalent for CO2 (VE/VCO2),12,13 as well as in the immediate recovery after CPET, such as the recently proposed O2 kinetics.14 While a submaximal measure of exercise performance may be useful in adults who are physiologically unable to reach a peak level of exercise, such theoretical utility is often offset by methodological limitations in the assessment of some of these variables.15
The cardiorespiratory optimal point (COP) constitutes a novel submaximal CPET index which provides an alternative approach to respiratory physiology.16,17 The COP represents the lowest value of the oxygen ventilatory equivalent (the ratio between ventilation [VE] in l/min and oxygen consumption [VO2] in l/min, VE/VO2) in a given minute during incremental exercise. As an index that quantifies the lowest ventilation required to extract 1 l of oxygen, COP characterizes the interplay between the circulatory and respiratory systems.17 COP is simple to identify and occurs at modest exercise levels (30-50% of VO2max), much earlier than VAT.17 While COP has been shown to be reliable16 and reference values are available,17 its utility as a clinical prognostic indicator has not been evaluated. Therefore, our objective was to assess the ability of COP, as an independent prognostic index and in combination with VO2max, to predict all-cause mortality in middle-aged and older adults with and without chronic disease.
MethodsIn a retrospective observational study, clinical data from 5643 subjects assessed in an exercise medicine clinic between January 1996 and July 2013 were reviewed. A subset that had completed maximal CPET and were aged between 40-85 years old narrowed the study population to 3331 adults. Among these subjects, 2220 (66.6%) were male, and all were censored until the date of death or September 30, 2013 by reviewing the State's official records. All subjects were unpaid volunteers and their assessments were typically requested by their attending physicians for different clinical reasons. All subjects read and signed an informed consent form before participating in the study. The consent form and retrospective data analysis were approved by the institutional research ethics committee (number 0166.0.000.399-11) in accordance with the Declaration of Helsinki and local regulations.
In the sample, 613 subjects (18.4%) were healthy (no known diseases) and were not taking regular medications that could affect exercise performance. Among the other 2718 individuals, 938 (28.2%) had coronary artery disease; of these, 456 (13.7%) were diagnosed with myocardial infarction; 534 (16.0%) had undergone angioplasty; and 396 (11.9%) had undergone coronary artery bypass graft surgery. The most prevalent risk factors were systemic hypertension (1374 [41.2%]) and diabetes (290 [8.7%]).
Assessment protocolInitially, subjects underwent a detailed medical interview and physical examination. Subsequently, anthropometric measurements and a 12-lead resting electrocardiogram were obtained. In addition, an SP-1 spirometer (Schiller, Switzerland), periodically calibrated as recommended,18 was used to determine the flow-volume curve, forced vital capacity (FVC) and forced expiratory volume in 1 s (FEV1), and the FEV1/FVC ratio was calculated.
Maximal cardiopulmonary exercise testingAll subjects underwent maximal CPET using a cycle ergometer (CatEye EC-1600, CatEye, Japan or Inbrasport CG-04, Inbrasport, Brazil), following an individualized ramp protocol, aiming to achieve exhaustion at about 8-12 min. An initial load of 25-50 watts was increased continuously in increments of 4-22 watts/min until exhaustion, defined as the inability to keep pedaling at ≥60 revolutions/min, despite strong verbal encouragement. Characterization of a true maximal physiological performance was based on a composite of three indicators: a respiratory exchange ratio of >1.05, a U-shaped curve of the ventilatory equivalents, and a maximum score of 10 on the Borg exertion scale. These physiological criteria were further validated by the impression of the CPET supervising physician. The CPETs of subjects who terminated early due to clinical abnormalities or who did not simultaneously fulfill all of these three physiological criteria were considered submaximal and excluded from the study. Prior to, during, and within 5 min after CPET, blood pressure and arterial oxygen saturation were recorded minute-by-minute, as was heart rate, the latter obtained from a single-lead digital electrocardiogram (CC5 or CM5) (ErgoPC Elite, Micromed, Brazil).19
Expired gas analysisDuring CPET, expired gases were collected with a preVent™ pneumotach (MedGraphics, USA) coupled to a mouthpiece with nasal occlusion and quantified by a VO2000 metabolic analyzer (MedGraphics, USA), enabling measurement of pulmonary ventilation and partial fractions of O2 and CO2. The output of all respiratory data was expressed as means at each minute during CPET.
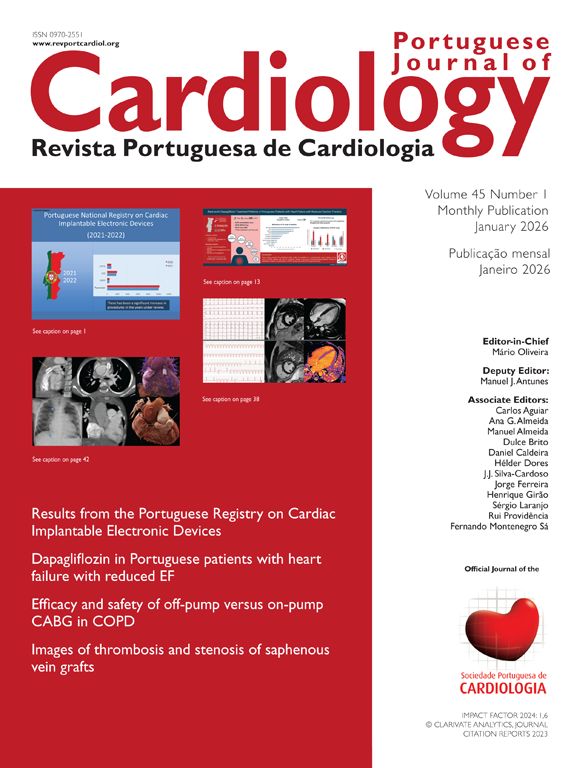
Cardiorespiratory optimal pointCOP is defined as the lowest value of VE/VO2 obtained in a given minute during incremental maximal CPET (Figure 1) and is a dimensionless variable. It is thus a simple, practical and objective measurement. COP reference values for healthy male and female adults have been previously reported and are available elsewhere.17 In addition, COP has shown excellent reliability, with an intraclass correlation coefficient of 0.87 (95% confidence interval [CI] 0.82-0.90),16 which is similar or superior to other CPET ventilatory variables.18,20
 CPET performed using a ramp protocol on a cycle ergometer.
 Identification of the cardiopulmonary optimal point in maximal CPET performed using a ramp protocol on a cycle ergometer. COP: cardiopulmonary optimal point; CPET: cardiopulmonary exercise testing; VE/VO2: oxygen ventilatory equivalent (average of six 10-s samples in a given minute of maximal CPET).
A log-rank test was used to determine the cut-off COP values for all-cause mortality. COP data were initially divided into quartiles and then the second and third quartiles were combined due to the considerable overlap between the two survival curves. The data were then stratified into three ranges: <22, 22-30, and >30, basically corresponding to the first, second and third, and fourth quartiles, respectively. VO2max was similarly stratified into three ranges: <15.75, 15.76-30, and >30, also corresponding to the first, second and third, and fourth quartiles, respectively. Additionally, in order to ascertain the contribution of COP when added to the most commonly used CPET variable, mean VO2max was calculated for each of the three COP ranges and subjects were divided into two groups for each COP range as being in the upper or lower half of VO2max for this particular range. This produced six subgroups: high COP-high VO2max, high COP-low VO2max, medium COP-high VO2max, medium COP-low VO2max, low COP-high VO2max, and low COP-low VO2max.
COP, VO2max and the combination of COP-VO2max results as described above were related to all-cause mortality by univariate and multivariate Cox regression. For multivariate analysis, the results were adjusted for age, gender, body mass index and FEV1/FVC ratio, and expressed as hazard ratios (HR). Survival curves were determined using the Kaplan-Meier method for the whole sample as well as for healthy and unhealthy subjects separately.
For other comparisons between the three COP ranges, one-way analysis of variance was calculated at a 5% significance level and a 95% confidence interval. The statistical analysis was performed using either SPSS version 17 (IBM, USA) or Prism version 5.01 (GraphPad, USA).
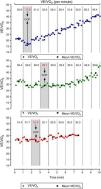
ResultsDescriptive analysis for all subjects and the three COP ranges is shown in Table 1. Median follow-up was 6.4 years (0.23-17.70 years), with a total death rate of 7.1%. The all-cause mortality rate increased from 1.4% for COP <22 to 17.1% in subjects with COP >30 (chi-square=78.34, p<0.001) (Figure 2).
Description and main results of maximal cardiopulmonary exercise testing (n=3331).
| Rest variables | All (n=3331) | Cardiorespiratory optimal point | p | ||
|---|---|---|---|---|---|
| <22 (n=803) | 22-30 (n=1792) | >30 (n=736) | |||
| Age (years) | 58±11.1 (58-59) | 54±9.6 (53-55) | 58.5±10.9 (58-59) | 64±10.4 (63-65) | <0.001 |
| Weight (kg) | 79.0±16.7 (78.4-79.6) | 79.5±15.7 (78.5-80.6) | 80.0±17.5 (79.1-80.8) | 76.2±15.6 (75.1-77.3) | <0.001 |
| Height (cm) | 169±9.2 (169-169) | 171±8.9 (170-171) | 169±9.2 (169-170) | 167±9.3 (166-167) | <0.001 |
| BMI (kg/m2) | 27.4±4.7 (27.3-27.6) | 27.1±4.4 (26.8-27.4) | 27.7±4.9 (27.5-27.9) | 27.2±4.4 (26.8-27.5) | <0.001 |
| Heart rate (bpm) | 66±11.5 (65-66) | 62±10.6 (61-63) | 67±11.4 (66-67) | 69±11.9 (68-70) | 0.002 |
| SBP (mmHg) | 132±17.7 (132-133) | 131±15.2 (130-132) | 133±17.5 (132-133) | 133±20.4 (131-134) | 0.056 |
| DBP (mmHg) | 77±10.6 (77-78) | 77±10.6 (76-78) | 78±10.6 (77-78) | 78±11.3 (77-78) | 0.279 |
| FEV1/FVC (%) | 79.1±7.9 (78.8-79.4) | 80.1±6.3 (79.6-80.5) | 79.6±7.3 (79.3-79.9) | 76.8±10.3 (76.0-77.5) | <0.001 |
| CPET variables | |||||
| Total time (min) | 9.4±2.6 (9.3-9.5) | 10.6±2.6 (10.4-10.7) | 9.4±2.5 (9.3-9.5) | 8.1±2.4 (7.9-8.3) | <0.001 |
| Maximum HR (bpm) | 148±26.8 (147-149) | 159±22.7 (157-160) | 149±25.8 (147-150) | 133±26.8 (131-135) | <0.001 |
| Maximal oxygen uptake (ml/[kg.min]) | 23.9±10.1 (23.6-24.3) | 30.5±10.7 (29.7-31.3) | 23.6±8.9 (23.2-24.0) | 17.5±7.1 (17.0-18.0) | <0.001 |
| COP | 26.3±5.9 (26.1-26.5) | 19.7±1.7 (19.5-19.8) | 25.7±2.3 (25.6-25.9) | 34.8±4.6 (34.5-35.2) | <0.001 |
BMI: body mass index; CI: confidence interval; COP: cardiorespiratory optimal point; CPET: cardiopulmonary exercise testing; DBP: diastolic blood pressure; FEV1: forced expiratory volume in 1 s; FVC: forced vital capacity; HR: heart rate; SBP: systolic blood pressure; VO2: oxygen uptake. All values mean±SD (95% CI).
 COP: cardiopulmonary optimal point.'/>
Univariate Cox regression analysis indicated that for COP >30, HR was 6.86 (95% CI 3.69-12.75, p<0.001). Furthermore, HR remained significant in multivariate analysis, confirming the predictive value of COP >30 (adjusted HR=3.72, 95% CI 1.98-6.98, p<0.001) and COP 22-30 (adjusted HR=2.15, 95% CI 1.15-4.03, p<0.001) compared to COP <22 (Table 2).
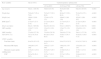
Univariate and multivariate Cox regression analysis for the cardiorespiratory optimal point and all-cause mortality (n=3331).
| Hazard ratio (95% CI) | All (n=3331) | Cardiorespiratory optimal point | p | ||
|---|---|---|---|---|---|
| <22 (n=803) | 22-30 (n=1792) | >30 (n=736) | |||
| Univariate regression | - | Ref. | 2.80 (1.50-5.23) | 6.86 (3.69-12.75) | - |
| Multivariate regression | - | Ref. | 2.15 (1.15-4.03) | 3.72 (1.98-6.98) | - |
| Follow-up (median, range) | 6.4 (0.2-17.7) | 9.6 (0.2-17.7) | 6.6 (0.2-17.7) | 4.2 (0.3-17.7) | <0.001 |
| Events (n, %) | 237 (7.1) | 11 (1.4) | 100 (5.6) | 126 (17.1) | <0.001 |
CI: confidence interval; Ref.: reference tertile.
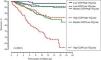
Combining the COP and VO2max results, we found that for high COP-low VO2max, i.e., COP >30 and VO2max below the average for this COP range, there was a very high mortality of 30.9% and an HR of 28.19 (95% CI 6.92-114.71) (Table 3). On the other hand, for those in the low COP-high VO2max subgroup, mortality was only 0.5% (Figure 3).
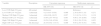
Univariate and multivariate Cox regression analysis for the cardiorespiratory optimal point and maximum oxygen uptake and all-cause mortality (n=3331).
| Variable | Description | Univariate regression | Multivariate regression | ||
|---|---|---|---|---|---|
| HR (95% CI) | p | HR (95% CI) | p | ||
| Low COP-High VO2max | All normal | Reference | - | Reference | |
| Low COP-Low VO2max | 1 abnormal | 4.21 (0.91-19.50) | 0.066 | 2.38 (0.50-11.18) | 0.271 |
| Median COP-High VO2max | 1 abnormal | 4.04 (0.96–16.97) | 0.057 | 3.13 (0.74–13.21) | 0.119 |
| Median COP-Low VO2max | 1 abnormal | 10.89 (2.67–44.42) | 0.001 | 4.98 (1.19–20.80) | 0.028 |
| High COP-High VO2max | 1 abnormal | 10.28 (2.48–42.60) | 0.001 | 5.28 (1.26–22.18) | 0.023 |
| High COP-Low VO2max | All abnormal | 28.19 (6.92–114.71) | 0.000 | 9.95 (2.36–41.91) | 0.002 |
CI: confidence interval; COP: cardiorespiratory optimal point; HR: hazard ratio; VO2max: maximum oxygen uptake.
 COP: cardiorespiratory optimal point;
 Analyzing VO2max results separately, univariate Cox regression indicated that for the lowest VO2max tertile, HR was 10.10 (95% CI 5.82-17.54, p<0.001) (Table 4).
Univariate and multivariate Cox regression analysis for maximal oxygen uptake and all-cause mortality (n=3331).
| Hazard ratio (95% CI) | All (n=3331) | Maximal oxygen uptake (ml/[kg·min]) | p | ||
|---|---|---|---|---|---|
| >30 (n=818) | 30-15.75 (n=1775) | <15.75 (n=737) | |||
| Univariate regression | - | Ref. | 3.13 (1.78-5.49) | 10.10 (5.82-17.54) | - |
| Multivariate regression | - | Ref. | 1.75 (0.98-3.13) | 3.26 (1.76-6.00) | - |
| Follow-up (median, range) | 6.4 (0.1-17.7) | 6.6 (0.3-17.7) | 6.3 (0.1-17.7) | 6.6 (0.1-17.7) | >0.05 |
| Events (n, %) | 237 (7.1) | 14 (1.7) | 94 (5.3) | 129 (17.5) | <0.001 |
CI: confidence interval; Ref.: reference tertile.
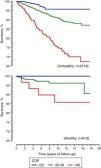
COP also performed well when the sample was separated into healthy subjects and those with chronic disease. For the latter (n=2718), univariate Cox regression analysis indicated that for COP >30, HR was 5.14 (95% CI 2.76-9.59, p<0.001) and for COP 22-30 HR was 2.18 (95% CI 1.16-4.08, p<0.001), compared to COP <22 (Figure 4). There were no deaths in healthy subjects presenting COP <22. On the other hand, 3.1% and 9.4%, respectively, of healthy subjects died with COP 22-30 and >30 (Figure 4).
Discussion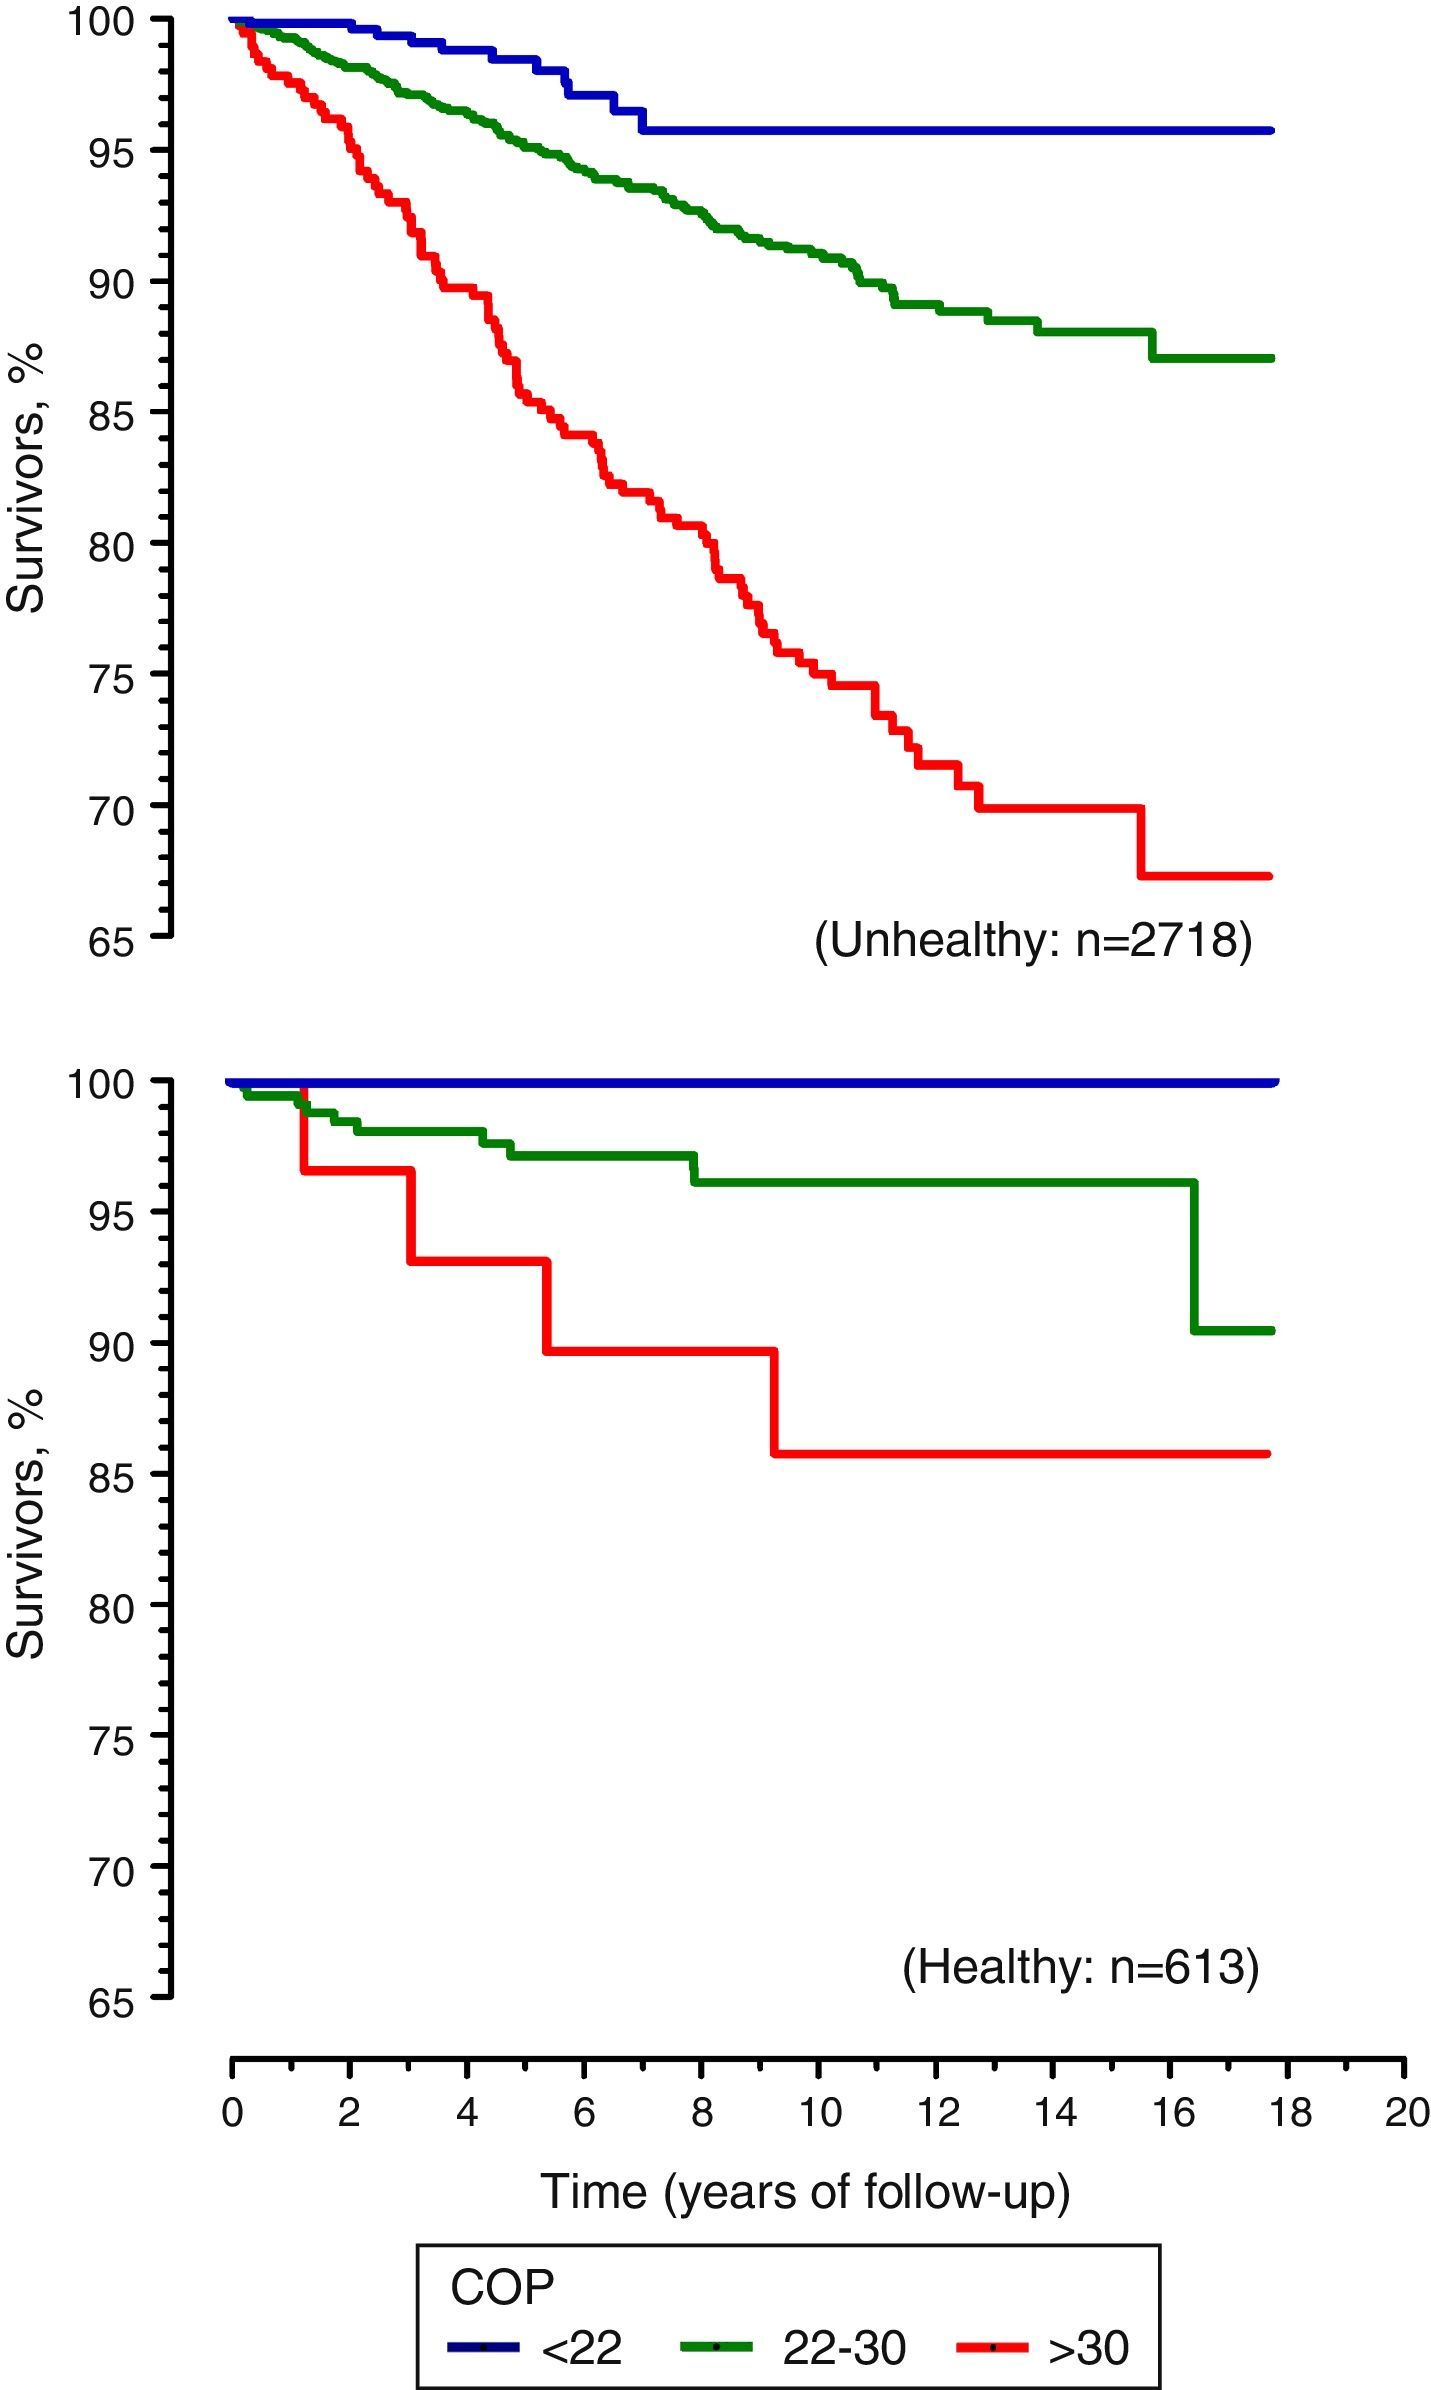
The clinical use of CPET for prognosis has gradually improved through the addition of several ventilatory and hemodynamic variables.2,8,21–23 In this context, the present retrospective study including data from 3331 subjects adds to the current state of knowledge by demonstrating the prognostic value of COP, a variable that is easily identified at low submaximal levels of CPET.
The ease with which COP can be identified derives from the physiological profile of VE/VO2 observed in the transition from rest to incremental exercise, typically a U-shaped curve with a clear lowest point. COP in fact has several advantages over other CPET variables, considering that it is obtained at relatively low-intensity exercise, i.e., at 30-50% of VO2max,17 and much earlier than VAT, thereby considerably reducing the effort required for clinical assessment. It should also be emphasized that determination of COP is free from observer error, since it is simply obtained from identification of the lowest VE/VO2 value in a listing of successive minute-by-minute CPET data. Additionally, COP is dimensionless, which makes it even simpler and easier to express and to compare. The use of COP to study prognosis using a large retrospective cohort with a broad clinical profile is thus both feasible and valuable.
Concerning our main objective, it was found that COP is a good predictor of all-cause mortality, by indicating that subjects with COP >30 exhibited an approximately six-fold higher mortality risk than those with COP <22. Interestingly, even after adjusting for age, gender, body mass index and FEV1/FVC ratio, the mortality risk of subjects with COP >30 remained significantly higher. The inclusion of these potential confounder variables in the adjusted model is theoretically justifiable. COP has been reported to be influenced by gender, with COP values in men tending to be lower than those for women in the same age-group,17 and by age, as values tends to increase proportionally with aging. Adjustment for body mass index was necessary because central adiposity and abnormalities in FEV1/FVC are known to affect ventilation,24 and therefore this adjustment reduced the possible negative influences of respiratory dysfunction.25
In a separate analysis stratified according to clinical condition (which was feasible due to the characteristics of our sample, in which both healthy and unhealthy subjects were deliberately included in order to resemble the actual profile of patients undergoing CPET in an exercise medicine clinic), COP remained a good prognostic indicator for all-cause mortality in the median 6.4 years of follow-up. Specifically, for those presenting any disease, COP >30 had an unadjusted HR of 5.14. A unique feature of our study was its demonstration that COP could also provide valuable information on prognosis for all-cause mortality in healthy middle-aged adults. In healthy subjects with COP <22, no deaths occurred in the follow-up period, suggesting that the combination of being healthy and having a good circulation-respiration interaction is an excellent indicator of good prognosis and is accompanied by a very low probability of all-cause mortality in the following six years. Further studies are warranted to determine whether for subjects in whom a maximal test is unavailable or impossible to obtain, COP is a good prognostic indicator for all-cause mortality.
As mentioned above, several previous studies, especially those using selected samples, have shown that other ventilatory variables obtained during CPET are also prognostic indicators. These variables include the lowest VE/VCO2 ratio26 and the VE/VCO2 slope,27 the latter being particularly valuable for heart failure patients. A potential advantage of COP in relation to these CO2-related variables is that physiological studies have clearly indicated that the rate of CO2 production and the VE/VCO2 ratio or minimum value, during both constant load11 and incremental exercise,12,20 are strongly influenced by the composition of food intake and the amount of muscle glycogen available prior to CPET, in clear contrast to VE/VO2, when considering the same effort intensity.15 In fact, these studies12,15 showed that a low-carbohydrate diet or a glycogen-depleted state contributed to an increase in VCO2, resulting in higher VE/VCO2 values, whereas ventilation and VO2 curves remained basically unchanged and did not significantly depend on diet composition, a variable that is rarely controlled in CPET in clinical practice.
The prognostic value of exercise capacity and VO2max are well established, as reported in several studies.8,14 For instance, Laukannen et al.28 found a 2.76 and 3.09 higher risk, respectively, of all-cause and cardiovascular death in a cohort of Finnish men, on the basis of VO2max measurements. However, obtaining a truly maximal exercise test can be difficult or undesirable. In this context, a recent study identified normal COP values, often accompanied by low VO2max, in patients who have had panic attacks with or without cardiorespiratory symptoms, a typical situation in which maximal testing is particularly difficult to obtain.29
It is worth noting that combinations of COP and VO2max data were even more powerful in differentiating mortality rates (Figure 3), as exemplified by the two extreme subgroups, low COP-high VO2max and high COP-low VO2max. Even more interesting is the canceling effect of differences in COP and VO2max, so that the survival curves of some opposite combinations – e.g. median COP-low VO2max and low COP-low VO2max – almost overlap. It can be seen by comparing the multivariate Cox regression results that COP showed slightly better prognostic discrimination than VO2max.
Regarding the variables obtained during CPET that are used as prognostic indicators, another one that combines VO2 and ventilation data is OUES,11,27,30 which was first described in 1996.31 OUES is obtained from analysis of the VE/VO2 curve during CPET, using multiple points rather than a single point, as is the case with COP. OUES has proved to be a good prognostic indicator in heart failure patients.23 However, a recent meta-analysis found only three studies in which this variable had prognostic value.2 To the best of our knowledge, the clinical or prognostic significance of OUES for healthy subjects is still unclear. As also pointed out for VE/VO2 slope, there are difficulties in standardizing the determination of OUES. In addition to these limitations, OUES can be mathematically derived using several different approaches and at different percentages of maximal CPET.32 Additionally, genuinely maximal CPET will always be required to accurately determine the percentage of the curve for these calculations, reducing the number of patients that could benefit from determination of this variable.
It should be pointed out that our study has some limitations. First is the fact that the sample was mostly made up of Caucasians with high socioeconomic status, and so different results may be found in populations with different demographic characteristics. Furthermore, we were unable to control for the specific cause of mortality or for the influence of subjects’ past history or current patterns of exercise, including sports. In addition, we chose VO2max, the most common marker of cardiorespiratory fitness, to combine with COP for further analysis. There is a need to study combinations and direct comparisons between COP and other submaximal and maximal CPET ventilatory indices that have been proposed for prognostic purposes. Lastly, it was not possible to determine the specific causes of mortality in our sample.
To summarize, this study adds a new ventilatory variable to the CPET repertoire, either alone or combined with VO2max, further extending its prognostic utility not only for specific clinical conditions such as heart failure, but in a much broader range of unhealthy and apparently healthy middle-aged adults. Unlike other CPET ventilatory variables (VAT, VE/VCO2 and OUES), COP does not require sophisticated calculations or observer judgments, it is more likely to be precisely identified in submaximal or prematurely ended CPET, and its interpretation is supported by a large age-standardized dataset of healthy adults. Interestingly, if minute-by-minute ventilation and oxygen consumption data are available, virtually any laboratory performing CPET can retrospectively determine COP by simply reviewing their current CPET dataset, and therefore help to further validate its clinical relevance.
CPET is increasingly used in sports and clinical contexts. Several ventilatory variables have been proposed to reflect different physiological aspects of normal exercise physiology and some of them have been shown to have prognostic relevance for all-cause mortality. However, various methodological constraints remain that limit a broader and more useful incorporation of some of these variables, including the subjectivity of criteria for identification and selection of the data to be used for calculations, the need for sophisticated calculations, dependence on genuinely maximal CPET, and the influence of pre-test food intake.
ConclusionCOP, defined as the lowest VE/VO2 value in a given minute of CPET and previously shown to be simple, practical, reliable and free from observer error, has now been characterized as an excellent indicator of all-cause mortality risk in six-year follow-up, either alone or strengthened by combination with VO2max, not only for specific populations of cardiac patients, but in a much broader range of middle-aged subjects, including healthy and unhealthy individuals, a population that is frequently seen for routine clinical exercise testing.
Ethical disclosuresProtection of human and animal subjectsThe authors declare that no experiments were performed on humans or animals for this study.
Confidentiality of dataThe authors declare that no patient data appear in this article.
Right to privacy and informed consentThe authors declare that no patient data appear in this article.
Conflicts of interestThe authors have no conflicts of interest to declare.
The authors express their gratitude to Dr. Daniel E. Forman for critical reading of the first version of this manuscript and acknowledge financial support of research grants from CNPq and FAPERJ.
