

Cardiopulmonary exercise testing (CPET) is the gold standard for quantifying aerobic functional capacity, yet it is costly and not widely available. The CLINIMEX Aerobic Fitness Questionnaire (C-AFQ) may be a practical alternative as it estimates oxygen consumption at peak exercise (VO2 peak) based on patients’ responses to a list of activities with known energy requirements. However, its applicability in cardiac patients is unclear and has not yet been studied. This study aims to assess the C-AFQ performance in predicting VO2 peak, measured via CPET, in adult patients with confirmed heart disease.
MethodsThis was a single-center prospective study enrolling consecutive patients who underwent CPET from April/2022 to January/2023. The main indication for CPET was measuring aerobic functional capacity for cardiovascular risk stratification.
ResultsA total of 124 patients (mean age 62±12 years, 75% male, 59% in the early phase post-myocardial infarction, 61% had heart failure, mean left ventricular ejection fraction 47±12%) with maximal CPET were included. Overall, a strong correlation was found between CPET and C-AFQ VO2 peak values (r=0.723, p<0.001). However, when performing a Bland–Altman plot analysis, we found a heightened confidence interval for the agreement between CPET and C-AFQ VO2 peak: 0.62±6.93 (95% CI −12.96–14.21) mL kg−1 min−1. CPET VO2 peak and the VO2 peak estimated by the exercise test protocol were related (r=0.777, p<0.001).
ConclusionAlthough cardiorespiratory fitness estimation from the C-AFQ performs well in a large population, the utility of this questionnaire to estimate cardiorespiratory fitness in this study's population sample has limited value. However, it may be useful to aid physicians in choosing the adequate exercise test protocol that best fits an individual patient.
A prova de esforço cardiorrespiratória (PECR) é o exame gold-standard para quantificar a capacidade funcional aeróbica, no entanto é dispendioso e não está amplamente disponível. O CLINIMEX Aerobic Fitness Questionnaire (C-AFQ) pode ser uma alternativa prática quando se estima o consumo de oxigénio no pico do exercício (VO2 pico) com base nas respostas dos doentes a uma lista de atividades com necessidades energéticas conhecidas. Contudo, a sua aplicabilidade em doentes cardíacos não é clara e ainda não foi estudada. Este estudo tem como objetivo avaliar o desempenho do C-AFQ na previsão do VO2 pico, medido via PECR, em doentes adultos com doença cardíaca confirmada.
MétodosEstudo prospetivo unicêntrico incluindo doentes consecutivos que realizaram PECR de abril/2022 a janeiro/2023. A principal indicação para a realização da PECR foi medição da capacidade funcional aeróbica para estratificação de risco cardiovascular.
ResultadosForam incluídos 124 doentes (idade media 62±12 anos, 75% homens, 59% na fase precoce pós-enfarte agudo do miocárdio, 61% com insuficiência cardíaca, fração de ejeção ventricular esquerda média 47±12%) com PECR máxima. No global, verificou-se uma correlação forte entre os valores de VO2 pico obtidos pela PECR e os estimados pelo C-AFQ (r=0,723, p<0,001). No entanto, ao realizar a análise do gráfico de Bland-Altman, identificou-se um intervalo de confiança aumentado em relação à concordância entre o VO2 pico medido pela PECR e o estimado pelo C-AFQ: 0,62±6,93 (95% CI −12,96–14,21) mL kg−1 min−1. O VO2 pico medido pela PECR e o estimado pelo protocolo do teste de exercício correlacionaram-se (r=0,777, p<0,001).
ConclusãoEmbora a estimativa da aptidão cardiorrespiratória do C-AFQ tenha tido um bom desempenho numa população numerosa, a utilidade deste questionário para estimar a aptidão cardiorrespiratória na amostra populacional deste estudo tem um valor limitado. No entanto, pode ser útil na escolha do protocolo de teste de exercício que melhor se adapta a cada doente.
Measuring aerobic cardiorespiratory fitness (CRF) holds significant importance as it offers an objective assessment of the physical well-being of patients and their ability to cope with daily life activities. Furthermore, there is strong scientific evidence linking the level of aerobic fitness to survival and prognosis, particularly among individuals with heart conditions.1 The cardiopulmonary exercise test (CPET), which provides the measurement of maximum or peak oxygen consumption (VO2 max or VO2 peak, respectively), in mL kg−1 min−1, is currently recognized as the most accurate method of measurement. Yet, it requires specialized equipment and is not readily available in most cardiac centers. Indeed, despite being considered in the most relevant international guidelines,2 the use of CPET for quantifying CRF remains limited around the world,3 due to financial restraints, lack of training, and its complex interpretation.4 The conventional exercise test, which monitors the heart's electrical activity though electrocardiogram and evaluates blood pressure and heart rate (HR) during exercise, is widely available, but is a less accurate alternative.
Therefore, methods of assessing functional status without exercise testing, by means of self-rated physical fitness level questionnaires, may be useful in some cases. Still, little is known about the precision and validity of these questionnaires for estimating CRF in cardiac patients and the existing evidence is hampered by heterogeneous definitions and measurement methods.5
Araújo et al.3 developed and validated the CLINIMEX Aerobic Fitness Questionnaire (C-AFQ), which aims to predict an individual's CRF according to the responses to a series of simple questions regarding the maximum physical activity that the individual believes he/she would be able to undertake or perform.3 These activities have an attributed known metabolic equivalent task (METs), from which VO2 peak or VO2 max can be derived. Yet, as far as we know, its use in patients with cardiac disease has not been validated, in heart failure (HF) patients.3
ObjectivesThe aim of this study was to evaluate the applicability and utility of the C-AFQ in an adult population of patients with cardiac disease referred for CPET at an outpatient clinic of a tertiary hospital.
MethodsStudy populationThis prospective single-center study was performed at the Cardiac Rehabilitation Unit of the Hospital de Santa Cruz (ULSLO), Lisbon, Portugal. All consecutive patients referred for CPET from April 2022 to January 2023 were considered for this study. The main indication for CPET was to assess functional capacity. The inclusion criteria were:
- •
Adult patients (>18 years)
- •
Cardiac disease (except recent HF hospitalization or myocardial infarction <14 days).
Patients fulfilling the inclusion criteria received explanations about the study and its objectives; written informed consent was obtained from those willing to participate.
Patients were excluded from the analysis if CPET were submaximal (in this study, defined as respiratory exchange ratio (RER) <1.10). The study protocol was approved by the institutional ethics committee of our institution (Approval Code 22117), in accordance with the principles of the Declaration of Helsinki.
Clinical data and study designAfter obtaining informed consent, clinical parameters (demographic, major cardiovascular risk factors, cardiac disease characterization and symptomatic status) were collected. After collecting the patient's answers to the C-AFQ, CPET was performed.
CLINIMEX – C-AFQ QuestionnaireThe C-AFQ was administered by the physicians supervising the CPET (MRL, RA and JP) by asking a series of questions to determinate the maximum self-perceived exercise capacity or physical activity of the patient. Administration of the C-AFQ was in a two-step sequence following the standard application instructions (please refer to supplementary material – C-AFQ Questionnaire for further details). This survey encompasses a list of daily routine activities presented in a progressively increasing MET order. This two-step approach enabled us to refine the estimation of maximal exercise capacity and, consequently, self-perceived maximal aerobic power in METs.3 By applying C-AFQ, it was possible to estimate self-perceived maximal CRF in one or two minutes, from <1 to >20 METs.3 Then, the estimated VO2 peak was obtained by multiplying the number of METs by 3.5.6
Cardiopulmonary exercise testingThe main indications for CPET were assessment of CRF for cardiovascular risk stratification or exercise prescription for a hospital-based cardiac rehabilitation program. CPET was performed on a treadmill in accordance with American Thoracic Society and the American College of Chest Physicians recommendations.7 Before each CPET, the physician conducted a conventional estimation of CRF by asking the patient about their typical physical activity levels. This information was used to select an exercise test protocol designed to bring the patient to exhaustion within 8–12 minutes of exercise. We used a RER cut-off ≥1.10 to identify a near-maximal/maximal exercise test and to exclude patients from the analysis whose test did not reach this value.
The CPET was conducted using a computerized Vyntus CPX metabolic cart (Vyaire Medical, Chicago, USA). Each patient was connected to a 12-lead ECG that was recorded continuously. Blood pressure was recorded at rest and in the last minute of each protocol stage, at peak exercise, and at the end of the first and the third minute of post-exercise period. Inspired and expired gases were collected through a Hans-Rudolph facemask. Gas analysis started for a minimum of two minutes before walking. Patients warmed up for two to three minutes by walking at 1.5–2.0 km/h and at 0% inclination before velocity and inclination established by the chosen protocol were progressively increased. CPET ended when the patient was unable to maintain exercise (typically due to fatigue or dyspnea) or developed a new severe arrhythmia, limiting angina, >1.0 mm ST elevation in ≥2 non-Q waves leads, angina and ST horizontal or downsloping depression ≥1 mm, asymptomatic horizontal or downsloping ST depression ≥3 mm, systolic blood pressure fall >20 mmHg from the highest value during CPET, systolic blood pressure ≥250/115 mmHg (relative criterion).8 The patient was monitored in the post-exercise period for three minutes or until any ECG changes resolved. The maximum MET value was calculated, by dividing VO2 peak, in mL kg−1 min−1, by 3.5.
Statistical analysisCategorical variables were reported as numbers and percentages, and continuous variables as mean±standard deviations (normal distribution), or as median and interquartile range for variables with skewed distributions. Normality of distribution was checked using Shapiro–Wilk test. Clinical characteristics of the subgroups of interest were compared using the χ2-test and Fisher's exact test (when applicable) for dichotomous variables; and the Student's t-test or Mann–Whitney U test (when applicable) for continuous variables. Pearson or Spearman's correlation coefficients were used to assess the correlation between the CPET VO2 peak vs. the C-AFQ VO2 peak and the VO2 peak predicted by the type of protocol used (equation-estimated/per protocol).9 Correlation coefficients 0.0–0.19, 0.2–0.39, 0.4–0.59, 0.6–0.79, and 0.8–1.0 represented very weak, weak, moderate, strong, and very strong correlations, respectively.10 Also, a Bland–Altman plot11 was constructed to visually evaluate the agreement between the CPET VO2 peak and the C-AFQ estimated VO2 peak. Ninety-five percent limits of agreement were calculated from the mean difference between the two methods ±1.96 times the standard deviation of the differences. Paired samples t-tests were used to estimate the margin of error (average estimation error) between CPET VO2 peak values (considered the gold standard) and the two other estimates used in the study (C-AFQ and equation-estimated VO2 peak values).
A two-sided p-value <0.05 was considered statistically significant. The statistical analysis was performed with IBM SPSS Statistics 26.0 (IBM Corp, Armonk, NY, USA).
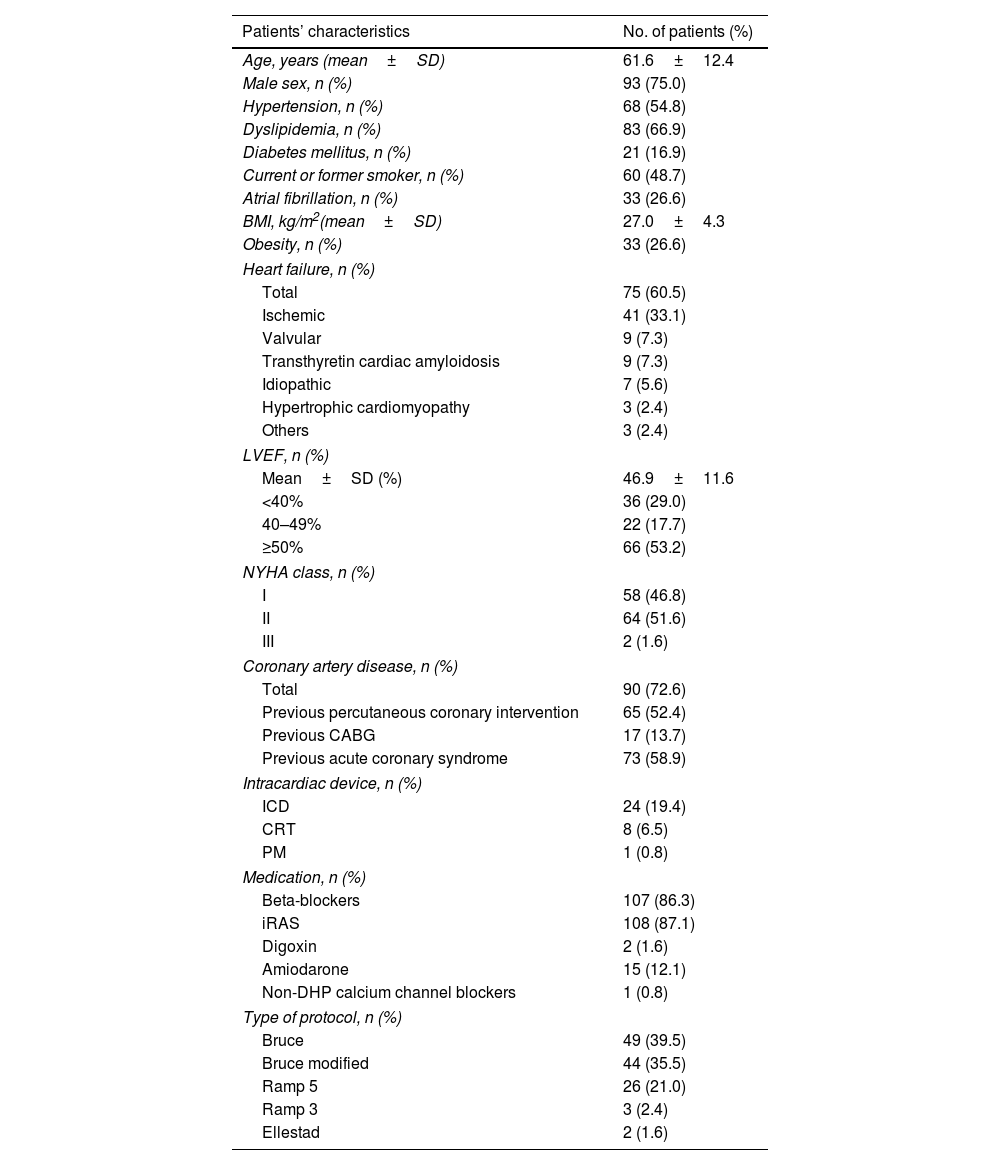
ResultsOverall characterizationA total of 246 CPETs were performed at our cardiac rehabilitation Unit between April 2022 to January 2023. Figure 1 exhibits the number of patients fulfilling exclusion criteria. Only data from the first maximal CPET was considered in the 15 patients who had two consecutive CPETs. A total of 124 patients (124 CPETs) were included; HF the most frequent diagnosis and was present in 61% of our cohort. Baseline patient characteristics are shown in Table 1. Within the subgroup of ischemic HF patients, the mean left ventricular ejection fraction (LVEF) was 47±12%. The mean duration of CPETs was nine minutes and 30 seconds.

Patients’ characteristics.
| Patients’ characteristics | No. of patients (%) |
|---|---|
| Age, years (mean±SD) | 61.6±12.4 |
| Male sex, n (%) | 93 (75.0) |
| Hypertension, n (%) | 68 (54.8) |
| Dyslipidemia, n (%) | 83 (66.9) |
| Diabetes mellitus, n (%) | 21 (16.9) |
| Current or former smoker, n (%) | 60 (48.7) |
| Atrial fibrillation, n (%) | 33 (26.6) |
| BMI, kg/m2(mean±SD) | 27.0±4.3 |
| Obesity, n (%) | 33 (26.6) |
| Heart failure, n (%) | |
| Total | 75 (60.5) |
| Ischemic | 41 (33.1) |
| Valvular | 9 (7.3) |
| Transthyretin cardiac amyloidosis | 9 (7.3) |
| Idiopathic | 7 (5.6) |
| Hypertrophic cardiomyopathy | 3 (2.4) |
| Others | 3 (2.4) |
| LVEF, n (%) | |
| Mean±SD (%) | 46.9±11.6 |
| <40% | 36 (29.0) |
| 40–49% | 22 (17.7) |
| ≥50% | 66 (53.2) |
| NYHA class, n (%) | |
| I | 58 (46.8) |
| II | 64 (51.6) |
| III | 2 (1.6) |
| Coronary artery disease, n (%) | |
| Total | 90 (72.6) |
| Previous percutaneous coronary intervention | 65 (52.4) |
| Previous CABG | 17 (13.7) |
| Previous acute coronary syndrome | 73 (58.9) |
| Intracardiac device, n (%) | |
| ICD | 24 (19.4) |
| CRT | 8 (6.5) |
| PM | 1 (0.8) |
| Medication, n (%) | |
| Beta-blockers | 107 (86.3) |
| iRAS | 108 (87.1) |
| Digoxin | 2 (1.6) |
| Amiodarone | 15 (12.1) |
| Non-DHP calcium channel blockers | 1 (0.8) |
| Type of protocol, n (%) | |
| Bruce | 49 (39.5) |
| Bruce modified | 44 (35.5) |
| Ramp 5 | 26 (21.0) |
| Ramp 3 | 3 (2.4) |
| Ellestad | 2 (1.6) |
BMI: body mass index; CABG: coronary artery bypass graft; CRT: cardiac resynchronization therapy: CPET: cardiopulmonary exercise testing; DHP: dihydropyridine; ICD: implantable cardio defibrillator; LVEF: left ventricular ejection fraction; NYHA: New York Heart Association class; PCI: percutaneous coronary intervention; PM: pacemaker; SD: standard deviation.
The results from the CPET revealed a mean VO2 peak of 21.9±7.4 mL kg−1 min−1, with a corresponding mean MET of 6.2±2.1. The results from the C-AFQ showed a mean VO2 peak estimate of 21.4±10.0 mL kg−1 min−1, with a corresponding mean MET of 6.1±2.9.
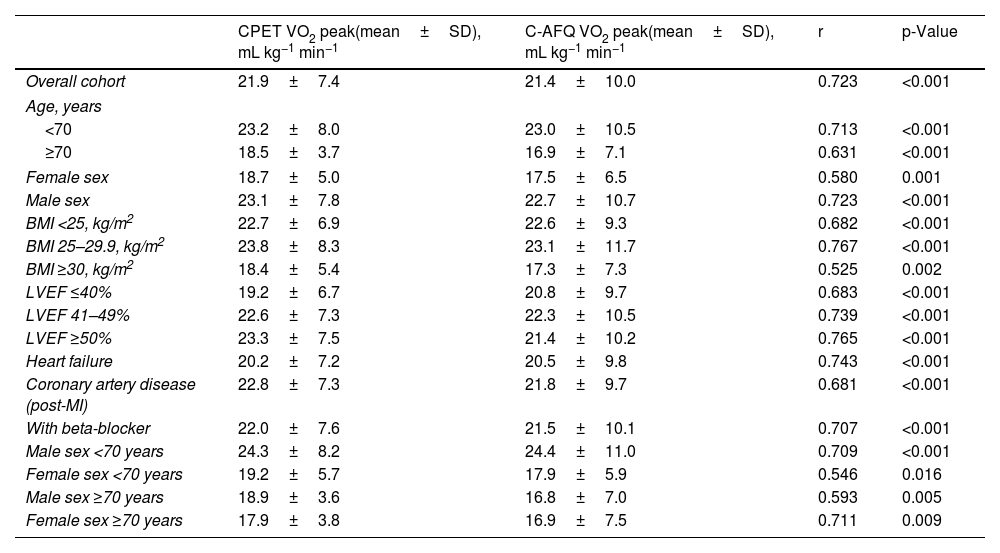
Correlation between CPET and C-AFQ VO2 peak valuesIn this cohort of patients, we found a strong, positive, and significant correlation between the mean VO2 peak measured by CPET and the one estimated by the questionnaire (r=0.723, p<0.001) (Table 2). These correlations remained significant across different and independent subgroups of patients when analyzing age and sex individually, albeit stronger in male patients (regarding sex) and in patients younger than 70 years old (regarding age). When we considered age and sex together in subgroup analysis, the performance of C-AFQ was better in women >70 years old (r=0.711, p=0.009) and in men <70 (r=0.709, p=0.001) (Table 2). VO2 peak estimated by C-AFQ was analyzed according to body mass index (BMI). Obese patients (BMI ≥30 kg/m2) presented a weaker, yet significant, correlation between CPET and C-AFQ VO2 peak (r=0.525, p=0.002) compared to non-obese patients (Table 2).
Pearson correlation coefficients between measured vs. estimated C-AFQ VO2 peak for all and specific patient characteristics.
| CPET VO2 peak(mean±SD), mL kg−1 min−1 | C-AFQ VO2 peak(mean±SD), mL kg−1 min−1 | r | p-Value | |
|---|---|---|---|---|
| Overall cohort | 21.9±7.4 | 21.4±10.0 | 0.723 | <0.001 |
| Age, years | ||||
| <70 | 23.2±8.0 | 23.0±10.5 | 0.713 | <0.001 |
| ≥70 | 18.5±3.7 | 16.9±7.1 | 0.631 | <0.001 |
| Female sex | 18.7±5.0 | 17.5±6.5 | 0.580 | 0.001 |
| Male sex | 23.1±7.8 | 22.7±10.7 | 0.723 | <0.001 |
| BMI <25, kg/m2 | 22.7±6.9 | 22.6±9.3 | 0.682 | <0.001 |
| BMI 25–29.9, kg/m2 | 23.8±8.3 | 23.1±11.7 | 0.767 | <0.001 |
| BMI ≥30, kg/m2 | 18.4±5.4 | 17.3±7.3 | 0.525 | 0.002 |
| LVEF ≤40% | 19.2±6.7 | 20.8±9.7 | 0.683 | <0.001 |
| LVEF 41–49% | 22.6±7.3 | 22.3±10.5 | 0.739 | <0.001 |
| LVEF ≥50% | 23.3±7.5 | 21.4±10.2 | 0.765 | <0.001 |
| Heart failure | 20.2±7.2 | 20.5±9.8 | 0.743 | <0.001 |
| Coronary artery disease (post-MI) | 22.8±7.3 | 21.8±9.7 | 0.681 | <0.001 |
| With beta-blocker | 22.0±7.6 | 21.5±10.1 | 0.707 | <0.001 |
| Male sex <70 years | 24.3±8.2 | 24.4±11.0 | 0.709 | <0.001 |
| Female sex <70 years | 19.2±5.7 | 17.9±5.9 | 0.546 | 0.016 |
| Male sex ≥70 years | 18.9±3.6 | 16.8±7.0 | 0.593 | 0.005 |
| Female sex ≥70 years | 17.9±3.8 | 16.9±7.5 | 0.711 | 0.009 |
BMI: body mass index; C-AFQ: CLINIMEX Aerobic Fitness Questionnaire; CPET: cardiopulmonary exercise test; LVEF: left ventricular ejection fraction; MI: myocardial infarction; SD: standard deviation; VO2 peak: highest oxygen consumption at peak exercise. Correlation coefficients (r) 0.0–0.19, 0.2–0.39, 0.4–0.59, 0.6–0.79, and 0.8–1.0 represented very weak, weak, moderate, strong, and very strong correlations, respectively.10
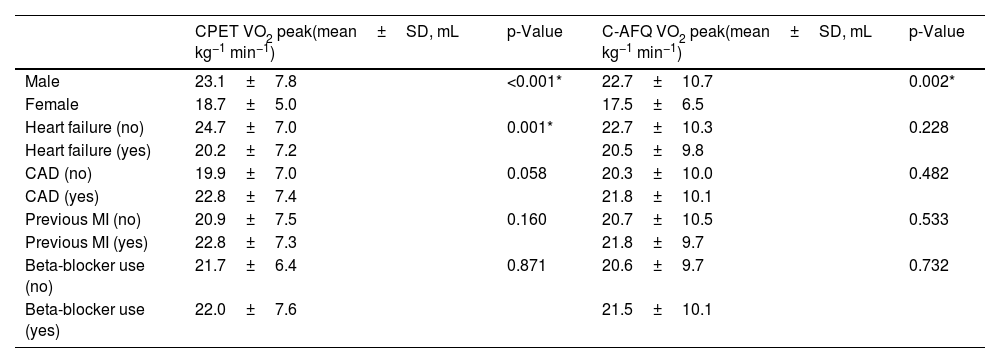
Regarding baseline heart disease, patients with HF had a statistically significant lower CPET VO2 peak compared with patients without HF (mean difference 4.4 [95% CI 1.9–7.0] mL kg−1 min−1, p=0.001), but there was no statistically significant difference between the C-AFQ estimated vs. CPET-measured VO2 peak (mean difference 2.2 [95% CI −1.4–5.9] mL kg−1 min−1, p=0.228) (Table 3). There were no differences regardless of the presence of coronary artery disease (CAD) (mean difference of CPET VO2 peak 2.8 [95% CI −5.7–0.1] mL kg−1 min−1, p=0.058; mean difference of C-AFQ VO2 peak 1.4 [95% CI −5.4–2.6] mL kg−1 min−1, p=0.482) (Table 3). Likewise, patients with a previous myocardial infarction had a similar CPET and C-AFQ VO2 peak values compared with patients without a previous myocardial infarction, mean differences of −1.4 [95% CI −4.2–1.4] mL kg−1 min−1 (p=0.328) and −0.9 [95% CI −4.7–2.7] mL kg−1 min−1 (p=0.593); respectively (Table 3).
Comparison between CPET and C-AFQ VO2 peak in different subgroups of patients.
| CPET VO2 peak(mean±SD, mL kg−1 min−1) | p-Value | C-AFQ VO2 peak(mean±SD, mL kg−1 min−1) | p-Value | |
|---|---|---|---|---|
| Male | 23.1±7.8 | <0.001* | 22.7±10.7 | 0.002* |
| Female | 18.7±5.0 | 17.5±6.5 | ||
| Heart failure (no) | 24.7±7.0 | 0.001* | 22.7±10.3 | 0.228 |
| Heart failure (yes) | 20.2±7.2 | 20.5±9.8 | ||
| CAD (no) | 19.9±7.0 | 0.058 | 20.3±10.0 | 0.482 |
| CAD (yes) | 22.8±7.4 | 21.8±10.1 | ||
| Previous MI (no) | 20.9±7.5 | 0.160 | 20.7±10.5 | 0.533 |
| Previous MI (yes) | 22.8±7.3 | 21.8±9.7 | ||
| Beta-blocker use (no) | 21.7±6.4 | 0.871 | 20.6±9.7 | 0.732 |
| Beta-blocker use (yes) | 22.0±7.6 | 21.5±10.1 |
CAD: coronary artery disease; C-AFQ: CLINIMEX Aerobic Fitness Questionnaire; CPET: cardiopulmonary exercise testing; MI: myocardial infarction; SD: standard deviation; VO2 peak: highest oxygen consumption at peak exercise.
Additionally, patients under beta-blocker drugs had similar CPET and C-AFQ VO2 peak values (mean difference of CPET VO2 peak −0.32 [95% CI −4.2–3.5] mL kg−1 min−1, p=0.871; mean difference of C-AFQ VO2 peak −0.9 [95% CI −6.1–4.3] mL kg−1 min−1, p=0.732) compared with patients without beta-blocker prescription (Table 3). There was a strong correlation between CPET and C-AFQ VO2 peak values in patients under beta-blockers (r=0.707, p<0.001) (Table 2).
Agreement between CPET and C-AFQ VO2 peak measurementsWhen analysing the agreement between CPET and C-AFQ VO2 peak values using Bland-Altman plots, we found a bias of 0.62±6.93 (95% CI −12.96–14.21) mL kg−1 min−1 between the two measurements (Figure 2). Bland–Altman graph analysis shows eight patients outside the limits of agreement, meaning that, in 6.5% of patients, the C-AFQ estimative of CPET VO2 peak was likely invalid. Although the estimation from the questionnaire performs well in a large population, the utility of this questionnaire to estimate cardiorespiratory fitness in individual patients is limited, considering the wide confidence interval between measurements.
, the dotted line is the line of equality, and the dashed lines represent the 95% limits of agreement of the mean differences, corresponding to −12.96–14.21, n=124.")
Bland–Altman plot. Bland–Altman plot for the individual differences between VO2 peak measured by CPET and C-AFQ VO2 peak values. Solid green line represents mean difference of the two methods (in mL kg−1 min−1), the dotted line is the line of equality, and the dashed lines represent the 95% limits of agreement of the mean differences, corresponding to −12.96–14.21, n=124.
CPET VO2 peak and the equation-estimated VO2 peak (estimated by the exercise test protocol) were correlated (r=0.777, p<0.001). When analyzing the average estimation errors between CPET and C-AFQ VO2 peak values vs. CPET and equation-estimated VO2 peak values, we found a statistically significant higher mean difference between the latter: mean differences of 0.62 (95% CI −0.61–1.85), p=0.319; and −12.17 (95% CI −13.68–10.65), p<0.001; respectively.
DiscussionThe main findings of this study were: (1) C-AFQ does not accurately estimate the CRF in this study population (consisting mostly of patients with cardiac disease), despite good correlations; (2) in subgroup analysis, C-AFQ performance remains acceptable across different subgroups of patients, independently to age, sex, BMI, underlying cardiac disease and LV function, (3) C-AFQ performs better than the per protocol VO2 peak in estimating CRF and may be useful in guiding CPET protocol selection.
Cardiopulmonary exercise testing is the gold standard for assessing CRF and cardiopulmonary performance and prognostication based on VO2 peak and VE/VO2 slope among others, namely in HF. When performed in appropriate patients, maximal CPET provides a wealth of clinically useful information, including data on function, symptoms, ischemia, hemodynamic, and other diagnostic and prognostic information.12 However, its availability is limited at many centers. To address this, alternative strategies have been investigated. Questionnaires offer a user-friendly, cost-effective, reliable, and reproducible option, particularly in second line cardiology departments and developing countries where CPET is less available.13 Various surrogates, such as submaximal walking tests and non-exercise functional tools, besides symptom questionnaires, have been proposed.14 Currently, there are several other fitness questionnaires,4,12,13 which are primarily used in healthy populations and provide a quick, inexpensive, and safe way for physicians to gauge patients’ functional capacity. These questionnaires are based on the patient's physical self-perception, which correlates relatively well with measured physical fitness indicators.15 Assessment of C-AFQ accuracy in relation to other questionnaires is beyond the scope of our research.
The first questionnaire developed to assess physical perception was the Veterans Specific Activity Questionnaire (VSAQ), a 13-item self-administered questionnaire used to estimate aerobic fitness in METs.4 More recently, the C-AFQ, a questionnaire to assess aerobic fitness, was developed to surpass the unavailability of CPET and to overcome some VSAQ limitations, as previously reported.3 In a cohort of 1000 subjects, only 23.3% with known CAD and no report of patients with HF, Araújo et al.3 found a significant and very strong correlation coefficient of 0.91 between estimated (C-AFQ) and measured (CPET) VO2 peak, a correlation higher than that previous reported by Myers et al.4 for the VSAQ questionnaire (r=0.79). Indeed, the authors draw our attention to the difference in the range of exercise intensities and the scale covered in both questionnaires: VSAQ with intensities going from 1 to 13-METs compared to 1 to 20-METs in C-AFQ. Also, regarding the interval scales, in the VSAQ a 1 MET increment was used, while in the C-AFQ a 0.5 MET interval scale was adopted in the lower range of the scale. These adjustments enabled C-AFQ to be applied to both severely unfit and fitter subjects, with better discrimination and quantification.3 Also, C-AFQ has a two-step approach vs. the single-step approach in VSAQ, which enables the patients to be guided directly to a very simple and straightforward answer.
Yet, although subjective self-assessment questionnaires may be useful, they have some limitations, especially if used in complex populations, such as in patients with cardiac and pulmonary diseases. They may lead to inaccurate conclusions if applied to different populations without proper validation and may not generalize well to objective measures or broader contexts. Individuals might overestimate or underestimate their abilities or symptoms due to distorted self-perception or self-awareness, affecting areas like fitness, cognitive ability, or mental health.
These questionnaires provide an estimation of CRF, a crucial information for prognosis, although with some pitfalls. Compared to CPET, they lack the ability to offer objective measurements of various biometric parameters, many of them with prognostic implications, such as blood pressure values and ECG data regarding silent ischemia or arrhythmias, essential for comprehensive risk stratification. Additionally, the questionnaire's estimated CRF is insufficient for exercise training prescription in the context of cardiac rehabilitation programs since it does not provide HR corresponding to the first and second ventilatory threshold, which are crucial for identifying the optimal training HR range for cardiac patients, as well as HR chronotropic response and decay during recovery period.
In this prospective study, in which only cardiac patients were included, we found that C-AFQ was not sufficiently accurate to predict functional capacity, measured by VO2 peak, because even though there was a numerically strong and positive correlation (r=0.723, p<0.001) between measured VO2 peak and estimated by C-AFQ VO2 peak, there were unacceptably high levels of disagreement in the Bland–Altman plot analysis. Despite a minimal mean difference between the CPET and the C-AFQ VO2 peak values (0.62±6.93 mL kg−1 min−1), there was a wide confidence interval ranging from −13 to +14.2 mL kg−1 min−1. This 27 mL kg−1 min−1 interval is too broad, approximately equivalent to 8 METs, exactly 40% of the C-AFQ score range from 0 to 20 METs. Although the mean difference is small and negligible, the individual variation is very high, which makes the questionnaire a largely inadequate tool in our population. When interpretating Figure 2, it is worth noting an underestimation of VO2 peak in patients with lower VO2 peak and an overestimation in patients with higher VO2 peak, which confirms the inability of the C-AFQ to adequately predict VO2 peak in this population. At the individual level, this suggests that a patient could fall at either extreme end of this confidence interval. Therefore, our opinion is that C-AFQ has not yet proved to be sufficiently accurate to be used in such a complex population.
Our cohort was different from the original CLINIMEX cohort.3 Our cohort exhibited a lower mean VO2 peak values (mean 21.9±7.4 mL kg−1 min−1 vs. 25.7±0.4 mL kg−1 min−1), was older (61±12 vs. 55±16 years old), had a higher burden of major cardiovascular risk factors, had a higher proportion of patients with previously diagnosed cardiac disease and a higher number of patients medicated with antianginal drugs, mainly beta-blockers (86.3% vs. 25.6%) compared to the original CLINIMEX cohort. These results indicate there is a greater cardiovascular risk and a more pronounced limitation in functional capacity within our population.
Despite the previously reported limitations, in subgroup analysis, C-AQF VO2 peak strongly correlated with CPET VO2 peak independently of LVEF: the correlations were stronger in patients with LVEF >40% but they remain significant even in patients with LVEF ≤40%. Correlation between measurements remained significant across all subgroups of patients, regardless of age, sex, BMI, presence or absence of HF or after acute MI.
However, when analyzed individually, a moderate correlation was found in women compared to the strong correlation in male patients (r=0.580 vs. r=0.723; respectively). When age and sex were considered together in subgroup analysis, the performance of C-AFQ was better in men younger than 70 (r=0.709, p=0.001) and in women older than 70 years (r=0.711, p=0.009). The strength of the correlations found in women (below or over 70 years) must be analyzed with caution since the total number of female patients included was 31 (25% of the overall population), with only 12 older than 70 years. These findings are consistent with previous observations of female subjective insight into their functional capacity and real effort limitations.16
Additionally, the correlations were weaker (r=0.682) in obese patients, who had higher VO2 peak measured values when compared to the ones estimated by the questionnaire (18.4±5.4 vs. 17.3±7 mL kg−1 min−1; respectively). This phenomenon can be attributed to a trend for obese patients to underestimate their CRF levels, which is likely to stem from greater physical deconditioning and a lifestyle characterized by physical inactivity.
The circumstances in which a questionnaire-derived estimate of peak VO2 might be applicable are likely limited to healthy individuals who seek to gauge their functional capacity in terms of METs. C-AFQ may be useful in healthy individuals whose aim is to assess their functional capacity. However, in cardiac patients, where accurate measurement of CRF and biometric parameters are crucial for risk assessment, for managing their condition and prescribing exercise based on data derived from CPET, relying on biometric data such as HR at the level of first and second ventilatory thresholds becomes essential. Our findings highlight the wide confidence interval seen with C-AFQ measured VO2, meaning that it exhibits an unacceptable variation at the individual level, despite demonstrating relative accuracy at the population level with a minimal mean difference. Indeed, the questionnaire does not offer an objective measurement of real/true peak VO2 associated with CRF in a population where fatigue may have a multifactorial etiology. We infer that, even though this questionnaire may be useful in healthy individuals, it may have limited value in cardiac patients, where the objective definition of functional capacity and ventilatory thresholds are of major importance for risk assessment and cardiac rehabilitation programs, which require objective biometric measurements.
Nevertheless, the C-AFQ can aid in tailoring CPET protocols to individual patients, enabling physicians to select protocols that align with each patient's subjective perception of maximal physical effort. Indeed, the C-AFQ aims to objectively capture a subjective perception of maximal physical effort, thus offering potential utility in guiding CPET protocol selection.
We also assessed the association between measured, per protocol and C-AFQ VO2 peak values, an analysis not yet reported in the literature to our knowledge. We found that CPET VO2 peak strongly correlates to the exercise protocol-estimated VO2 peak (r=0.777, p<0.001). Albeit weaker, C-AFQ VO2 peak also had a strong correlation to the protocol-estimated (r=0.673, p<0.001), suggesting the potential role of C-AFQ in assisting the physician to adequately choose the appropriate protocol accordingly to patient's perception of their physical capabilities, maximizing CPET results, particularly regarding protocols with a 2–3 minute stage duration. Additionally, we also found that C-AFQ better estimates CPET VO2 peak values compared to VO2 peak estimated by the protocol in the population, since the latter has a wider range of estimated METs with subsequent lower discriminative power to predict true CRF.
To our knowledge, this is the first study to externally evaluate C-AFQ in a cohort of adult patients with heart disease, assessing the relationship between measured and perceived physical exertion, regarding heart disease etiology and across all spectra of LVEF.
Additionally, we used objective VO2 peak measured by a CPET and not estimated METs, compared to most studies evaluating the estimation of physical aerobic fitness using questionnaires.12
LimitationsOur study has several limitations. First, it is a single-center and observational study with a reduced population, particularly considering female sex and patients >70 years. The C-AFQ was administered by three physicians, which could have increased heterogeneity in the results and possibly contributes to the lower association between C-AFQ and CPET VO2 peak values. Our primary findings might have differed if our sample population had included a greater number of patients with heart disease, particularly females, and a more homogenous group. Our cohort consisted of individuals with diverse HF etiologies, which may have affected C-AFQ behavior and its correlation with CPET values across these distinct populations. Analyzing a larger patient sample could offer valuable insights, as it would allow enable more detailed subgroup analyses with a larger sample size in each group. However, we aimed to test the questionnaire's performance in a real-world setting. Additionally, the usual physical activity habits and socioeconomic level of the patients were not assessed, and it might have influenced the interpretation of the C-AFQ questions, as well as the responses.
ConclusionPhysical activity and symptom questionnaires have been used as surrogates for exercise testing to estimate a patient's functional capacity and to individualize the choice of an exercise testing protocol in accordance with guidelines. In this prospective cohort study including exclusively cardiac patients, we demonstrated that the C-AFQ has limited utility in estimating CRF in this population, despite its good correlation with CPET-measured VO2 peak values. C-AFQ main utility may be to help to individualize CPET protocols.
CRediT authorship contribution statementAll authors have contributed to this manuscript, reviewed, and approved the current form of the manuscript. MRL and RA were specifically responsible for manuscript conceptualization. MRL, JP, RA were responsible for data collection, analysis and first manuscript edition. MRL and JP were specifically responsible for statistical analysis. GC, LM, AD and MM specifically made the first revision and editing. AD, CGA and MM were responsible for the editing of the final version of the manuscript. All authors have contributed to this manuscript, reviewed, and approved the current and final form of the manuscript.
FundingNone declared.
Conflict of interestThe author involved in the development and publication of the C-AFQ Questionnaire also contributed as a co-author to this manuscript. This potential conflict of interest has been disclosed to ensure transparency and maintain the integrity of the research presented.
Data availabilityAll data exposed in this article was acquired from our institution, after obtaining informed consent from patients. The data underlying this article are available in the article and in its online supplementary material.
The following are the supplementary data to this article:
C-AFQ Questionnaire (English version).
