

Biomarkers have emerged as interesting predictors of risk in patients with acute coronary syndromes (ACS). The aim of this study was to determine the utility of the combined measurement of cystatin C (CysC), C-reactive protein (CRP), N-terminal pro-brain natriuretic peptide (NT-proBNP) and red blood cell distribution width (RDW) in the risk stratification of patients with ACS.
MethodsIn this prospective study including 682 patients consecutively admitted to a coronary care unit for ACS, baseline measurements of CysC, CRP, NT-proBNP and RDW were performed. Patients were categorized on the basis of the number of elevated biomarkers at presentation. The primary outcome was 6-month mortality.
ResultsThe number of biomarkers elevated on admission (study score) was an independent predictor of 6-month mortality; patients with four biomarkers elevated on admission had a significantly higher risk of 6-month mortality compared with patients with none or one. In addition, in patients with high risk defined by the GRACE score, our multimarker score was able to further categorize their risk of 6-month mortality.
ConclusionsA multimarker approach using CysC, NT-proBNP, CRP and RDW was an independent predictor of 6-month mortality and added prognostic information to the GRACE risk score in patients with ACS and high risk defined by GRACE, with increasing mortality in patients with a higher number of elevated biomarkers on admission.
Os biomarcadores têm surgido como interessantes preditores de risco em doentes com síndrome coronária aguda (SCA). O objetivo deste estudo foi definir a utilidade da combinação da cistatina C (CysC), da proteína C reativa (CRP), a porção N-terminal do peptídeo natriurético tipo B (NT-proBNP) e do índice de anisocitose (RDW) na estratificação de risco dos doentes com SCA.
MétodosEstudo prospetivo, incluindo 682 doentes admitidos consecutivamente na nossa unidade coronária por SCA. À admissão foi feito o doseamento plasmático da CysC, CRP, NT-proBNP e RDW. Os doentes foram categorizados de acordo com o número de biomarcadores elevados à admissão. O evento primário estudado foi a mortalidade aos seis meses.
ResultadosO número de biomarcadores elevados à admissão (score estudado) foi preditor independente de mortalidade aos seis meses; os doentes com quatro biomarcadores elevados à admissão tiveram um risco de morte aos seis meses significativamente superior aos doentes sem nenhum ou com apenas um biomarcador elevado. Adicionalmente, nos doentes com alto risco definido pelo score GRACE, o nosso score multimarcadores teve a capacidade de os categorizar adicionalmente quanto ao risco de morte aos seis meses.
ConclusãoA abordagem multimarcadores baseada na CysC, NT-proBNP, CRP e RDW foi preditor independente de mortalidade aos seis meses e proporcionou informação prognóstica adicional nos doentes de alto risco definido pelo score GRACE, com maior da mortalidade nos doentes com maior número de biomarcadores elevados à admissão.
acute coronary syndrome
area under the receiver operating characteristic curve
brain natriuretic peptide
Cockcroft-Gault equation
confidence interval
C-reactive protein
cardiac troponin I
cystatin C
glomerular filtration rate
high sensitivity C-reactive protein
myocardial infarction
N-terminal pro-brain natriuretic peptide
left ventricular
non-ST-segment elevation acute coronary syndrome
odds ratio
percutaneous coronary intervention
red blood cell distribution width
ST-segment elevation acute coronary syndrome
Various risk factors have been identified in patients with acute coronary syndrome (ACS) and incorporated into scoring systems that enable the clinician to stratify risk and guide treatment.1 In recent years, a deeper understanding of the pathobiology of atherothrombosis as the underlying mechanism of ACS has directed studies towards the evaluation of novel serum biomarkers as potential diagnostic tools for the clinical setting.2,3 Recognition of the importance of including all the major mechanisms of ACS in risk stratification has increased the appeal of the multimarker approach. However, the ideal biomarkers and the ideal combination to improve risk stratification have not been defined.
The aim of this study was to assess the value of a multimarker approach with cystatin C (CysC), C-reactive protein (CRP), N-terminal pro-brain natriuretic peptide (NT-proBNP) and red blood cell distribution width (RDW) in the risk stratification of patients with ACS.
Another objective of the study was to determine the hierarchy of these biomarkers in terms of predictive power for 6-month mortality.
MethodsStudy design and populationOf a total of 902 consecutive patients admitted to our department's coronary care unit between July 1, 2009 and June 30, 2011 with a diagnosis of ACS, we prospectively studied 682 patients. The time between the onset of ACS symptoms and the time of blood sampling to assess biomarkers was <24 hours. The remaining 220 patients were excluded for two main reasons: more than 24 hours between symptom onset and the time of blood sampling; or if at least one of the four laboratory predictors had not been assessed on admission (clotted blood sample or failure to request the laboratory study). The excluded patients were slightly older than the study population, but did not differ significantly in other baseline characteristics (Table 1).
Differences in baseline characteristics between included and excluded patients.
| Included (n=682) | Excluded (n=220) | p | |
| Demographic | |||
| Age (years) | 64±13 | 66±13 | 0.027 |
| Male (%) | 77.9 | 76.8 | 0.747 |
| CV risk factors (%) | |||
| Diabetes | 26.4 | 27.3 | 0.797 |
| Hypertension | 63.5 | 68.2 | 0.206 |
| Dyslipidemia | 53.5 | 53.6 | 0.976 |
| Active smoker | 30.2 | 25.9 | 0.223 |
| CV history (%) | |||
| MI | 15.2 | 17.7 | 0.382 |
| Stroke | 7.5 | 8.2 | 0.733 |
| PAD | 2.9 | 3.2 | 0.850 |
| PCI | 6.6 | 7.3 | 0.729 |
| CABG | 4.1 | 3.6 | 0.757 |
| Chronic kidney disease | 3.4 | 4.1 | 0.632 |
| Previous medication (%) | |||
| Aspirin | 24.5 | 26.4 | 0.576 |
| Thienopyridines | 7.2 | 6.4 | 0.678 |
| Beta-blockers | 22.1 | 19.1 | 0.337 |
| ACEIs/ARBs | 45.0 | 43.6 | 0.721 |
| Statins | 34.2 | 36.8 | 0.006 |
| Clinical presentation | |||
| ST-segment elevation (%) | 52.2 | 55.0 | 0.400 |
| Killip class >I (%) | 21.8 | 26.4 | 0.382 |
| SBP (mmHg) | 129±26 | 126±29 | 0.204 |
| DBP (mmHg) | 78±15 | 76±16 | 0.128 |
| HR (bpm) | 76±19 | 78±21 | 0.128 |
| Hemoglobin (g/dl) | 13.9±2.2 | 13.6±1.9 | 0.109 |
ACEIs: angiotensin-converting enzyme inhibitors; ARBs: angiotensin receptor blockers; CABG: coronary artery bypass grafting; CV: cardiovascular; DBP: diastolic blood pressure; HR: heart rate; MI: myocardial infarction; PAD: peripheral arterial disease; PCI: percutaneous coronary intervention; SBP: systolic blood pressure.
The study was approved by the ethics committee and all patients provided written informed consent.
The patients included in the study presented a history of chest pain at rest or symptoms suggestive of ACS, the most recent episode being up to 24 hours before admission. Symptoms could be associated with persistent or transient ST-segment elevation, ST-segment depression, or T-wave inversion on the ECG, or elevated biomarkers of cardiac injury. The biomarkers used were cardiac troponin I (cTnI) and the MB fraction of creatinine kinase (CK-MB) and the 99th percentile of a reference population was employed as the diagnostic threshold. Patients with unstable angina and normal admission ECG were also included (n=24). Left ventricular (LV) ejection fraction was assessed by transthoracic echocardiography 1–2 days after admission. In patients with ST-segment elevation ACS (STE-ACS) echocardiography was performed after cardiac catheterization as long as a mechanical complication was not suspected. In patients with non-ST-segment elevation ACS (NSTE-ACS) echocardiography was performed before cardiac catheterization and usually within 24 hours of admission.
The four laboratory predictors were considered to be elevated when CysC >0.95 mg/l (normal 0.53–0.95); CRP >5.0 mg/l (<5); NT-proBNP >125 pg/ml (<125) and RDW >14% (11.6–14.0), which were the upper limit values of a normal population. Glomerular filtration rate (GFR) was estimated by the Cockcroft-Gault (CG) formula and renal dysfunction was defined as GFR <60 ml/min/1.73 m2.4
Follow-up and adverse eventsThe study's primary outcome was cumulative all-cause mortality at six months. Follow-up and confirmation of adverse events were by telephone contact and by consultation of the hospital's databases and records. Six-month follow-up was achieved in 633 patients (92.8% of the study population). The majority of patients lost for follow-up had moved away or were from other areas of reference and so contact was not possible; their baseline characteristics did not differ significantly from those of the study population (Table 2).
Differences in baseline characteristics between patients with follow-up and those lost to follow-up.
| With follow-up(n=827) | Without follow-up(n=75) | p | |
| Demographic | |||
| Age (years) | 64±13 | 63±14 | 0.794 |
| Male (%) | 78.0 | 75.5 | 0.681 |
| CV risk factors (%) | |||
| Diabetes | 26.4 | 26.5 | 0.982 |
| Hypertension | 64.0 | 57.1 | 0.338 |
| Dyslipidemia | 54.2 | 44.9 | 0.209 |
| Active smoker | 29.7 | 36.7 | 0.301 |
| CV history (%) | |||
| MI | 15.3 | 14.3 | 0.846 |
| Stroke | 7.7 | 4.1 | 0.348 |
| PAD | 2.8 | 4.1 | 0.621 |
| PCI | 7.0 | 2.0 | 0.182 |
| CABG | 4.1 | 4.1 | 0.993 |
| Chronic kidney disease | 3.3 | 4.5 | 0.661 |
| Previous medication (%) | |||
| Aspirin | 25.6 | 10.2 | 0.016 |
| Thienopyridines | 7.4 | 4.1 | 0.383 |
| Beta-blockers | 22.3 | 20.4 | 0.762 |
| ACEIs/ARBs | 44.9 | 46.9 | 0.779 |
| Statins | 35.1 | 22.4 | 0.073 |
| Clinical presentation | |||
| ST-segment elevation (%) | 52.0 | 55.1 | 0.673 |
| Killip class >I (%) | 21.8 | 26.4 | 0.303 |
| SBP (mmHg) | 129±26 | 130±27 | 0.666 |
| DBP (mmHg) | 78±15 | 81±15 | 0.172 |
| HR (bpm) | 76±19 | 73±15 | 0.315 |
| Hemoglobin (g/dl) | 14.0±2.2 | 13.4±2.0 | 0.092 |
ACEIs: angiotensin-converting enzyme inhibitors; ARBs: angiotensin receptor blockers; CABG: coronary artery bypass grafting; CV: cardiovascular; DBP: diastolic blood pressure; HR: heart rate; MI: myocardial infarction; PAD: peripheral arterial disease; PCI: percutaneous coronary intervention; SBP: systolic blood pressure.
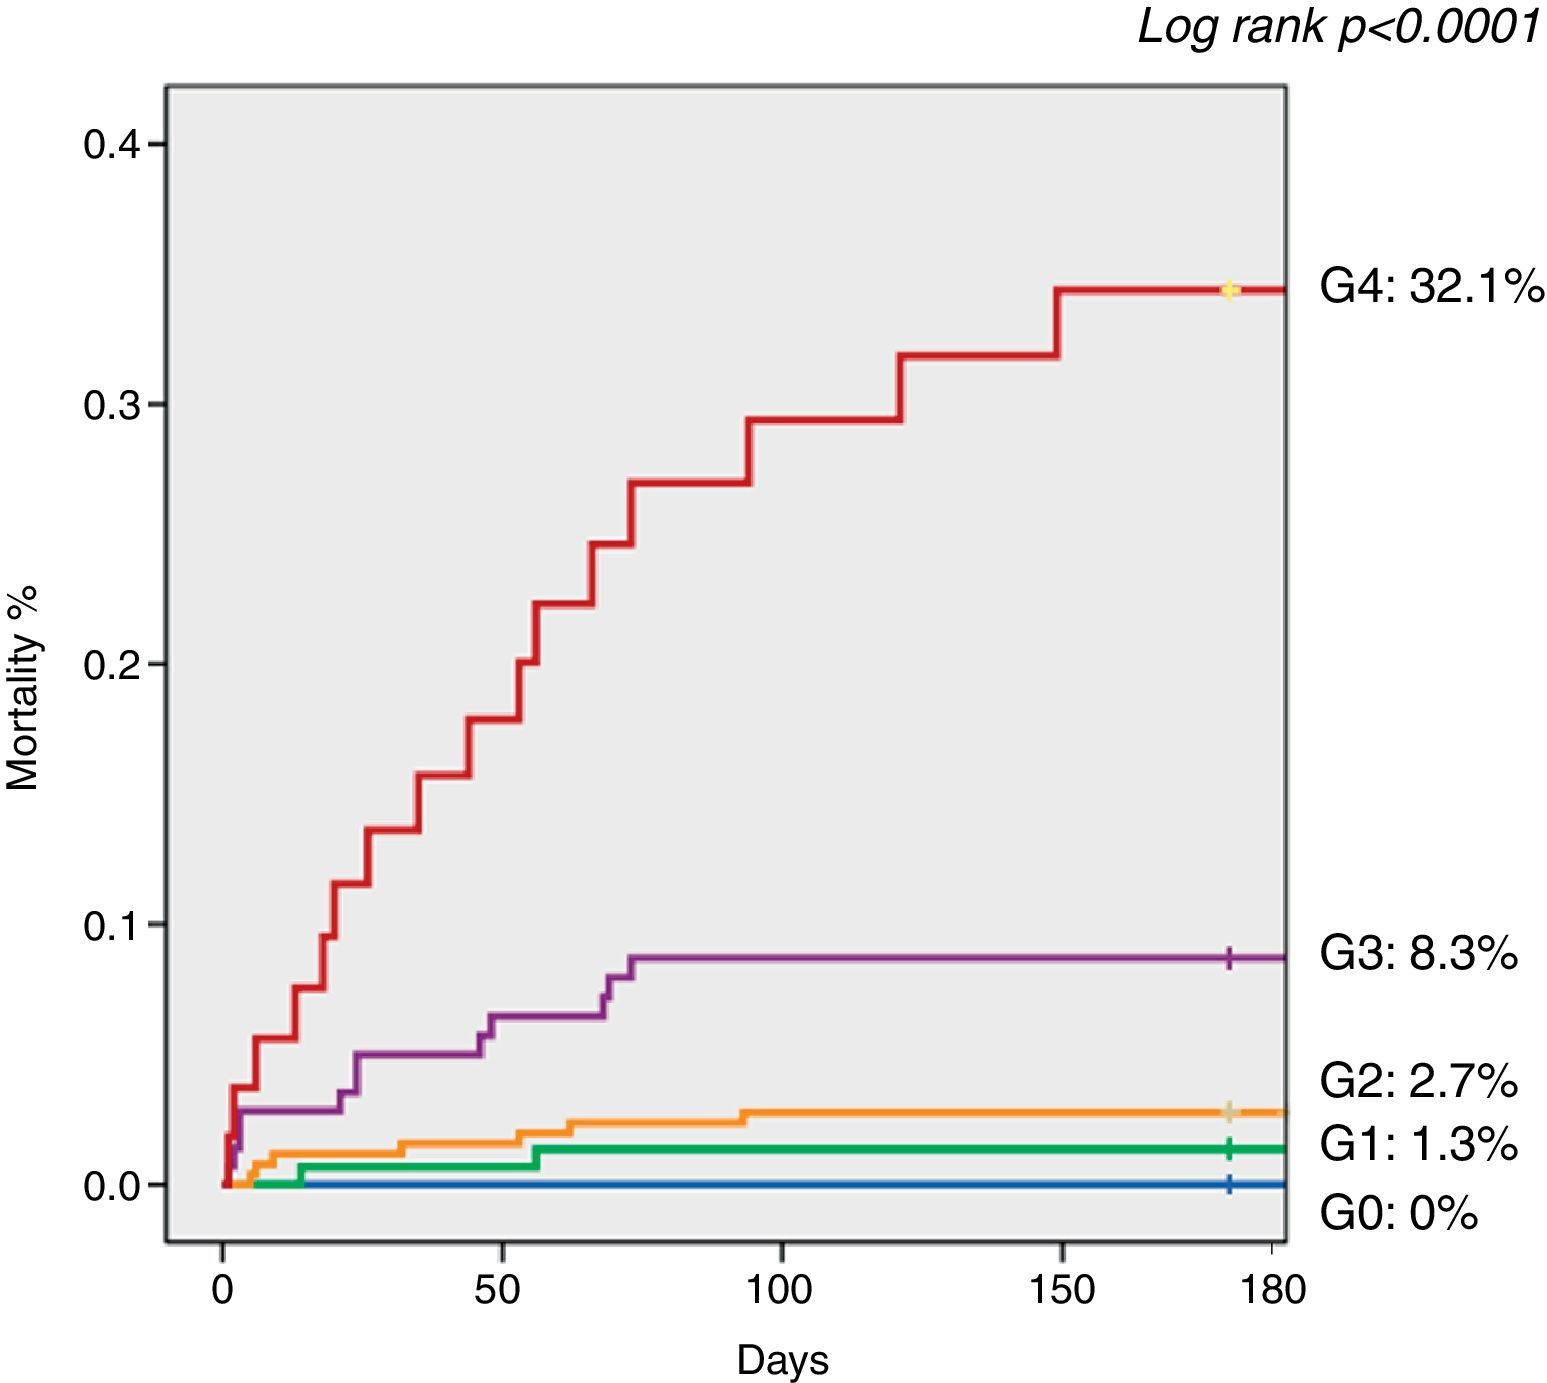
Patients were divided into five groups according to the number of elevated laboratory predictors on admission: G0 (n=24), in whom none of the four biomarkers was elevated at admission; G1 (n=158), in whom one biomarker was elevated at admission; G2 (n=281), in whom two biomarkers were elevated at admission; G3 (n=156), in whom three biomarkers were elevated at admission; and G4 (n=63), in whom all biomarkers were elevated at admission. The groups were compared in terms of baseline characteristics. Categorical variables were expressed as percentages and continuous variables as means ± standard deviation or medians with ranges. Between-group differences were compared using the Student's t test or the Mann-Whitney U test for continuous variables and the chi-square test or Fisher's exact test for categorical variables, as appropriate. Multivariate linear regression analysis was performed to determine which of the following variables were associated with a higher number of laboratory predictors elevated on admission: age and gender; history of diabetes, hypertension, smoking, myocardial infarction (MI), renal failure, stroke/transient ischemic attack, atrial fibrillation, or coronary artery bypass grafting (CABG); previous medication with aspirin, thienopyridines, beta-blockers, angiotensin-converting enzyme inhibitors or angiotensin receptor blockers and statins; Killip class, heart rate, GFR, hemoglobin and type of ACS on admission.
To assess the association between a higher number of biomarkers elevated on admission and 6-month mortality, multivariate logistic regression analysis was performed, the models being constructed with the number of predictors elevated on admission as a categorical variable and including four other covariables associated with 6-month mortality, given the small number of events in the study. The threshold for retaining a variable in the final model was set at p<0.1. The variables included were age, Killip class on admission, LV systolic dysfunction, coronary revascularization and the number of elevated biomarkers on admission. To assess whether the study score (number of laboratory predictors elevated on admission) was a predictor of mortality independent of the GRACE score,5 the GRACE score was included in a second multivariate logistic regression model which included the multimarker score, LV systolic dysfunction, coronary revascularization and GRACE score. Age and Killip class were not included in this second model because they are already included in the GRACE score.
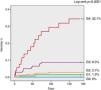
Kaplan-Meier survival curves were constructed to compare event-free survival at six months according to the number of elevated laboratory predictors on admission, using the log-rank test. A value of p<0.05 was considered statistically significant. All statistical tests were two-sided. The statistical software used was Statistical Package for the Social Sciences (SPSS) version 17.0 (SPSS Inc., Chicago, Ill).
The hierarchy of the biomarkers in terms of predictive power for 6-month mortality was assessed by comparing the areas under the receiver-operating characteristic curve (AUCs). This calculation and comparison was performed with MedCalc version 12.2.1.0 (MedCalc Software, Mariakerke, Belgium).
Given the known value of the GRACE score in the risk stratification of patients with ACS, we conducted a stratified analysis of 6-month mortality according to the number of elevated biomarkers in patients with low, intermediate and high risk according to their GRACE score (in both NSTE-ACS and STE-ACS).
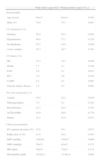
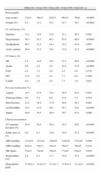
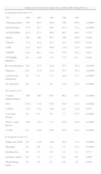
ResultsBaseline characteristicsOf the 682 patients enrolled in the study, 356 (52.2%) had ST-segment elevation MI, 302 (44.3%) had non-ST-segment elevation MI, and 24 (3.5%) had a final diagnosis of unstable angina. On admission, 24 (3.5%) patients were in group G0, 158 (23.2%) in G1, 281 (41.2%) in G2, 156 (22.9%) in G3 and 63 (9.2%) in G4. The demographic characteristics of the study population according to the number of elevated biomarkers on admission are shown in Table 3. Patients with a higher number of elevated biomarkers on admission were older (p for trend <0.001), more likely to be female (p<0.001), and had a higher prevalence of diabetes (p=0.001) and hypertension (p<0.001). These patients more often had a history of MI (p<0.001), CABG (p=0.021) and stroke (p<0.001), and on admission more often presented with NSTE-ACS (p<0.001), Killip class >I (p<0.001) and lower mean hemoglobin (p<0.001).
Baseline patient characteristics according to the number of biomarkers elevated on admission.
| G0(n=24) | G1(n=158) | G2(n=281) | G3(n=156) | G4(n=63) | p | |
| Demographic | ||||||
| Age (years) | 53±11 | 58±12 | 62±13 | 68±13 | 76±9 | <0.0001 |
| Female (%) | 8.3 | 15.2 | 18.1 | 32.7 | 36.5 | <0.0001 |
| CV risk factors (%) | ||||||
| Diabetes | 33.3 | 14.6 | 27.0 | 32.1 | 36.5 | 0.001 |
| Hypertension | 58.3 | 55.7 | 60.1 | 67.9 | 88.9 | <0.0001 |
| Dyslipidemia | 66.7 | 52.5 | 54.4 | 53.2 | 47.6 | 0.607 |
| Active smoker | 50.0 | 37.3 | 35.2 | 17.9 | 12.7 | <0.0001 |
| CV history (%) | ||||||
| MI | 4.2 | 14.6 | 10.3 | 21.2 | 28.6 | <0.0001 |
| Stroke | 0.0 | 4.4 | 3.9 | 10.3 | 27.0 | <0.0001 |
| PAD | 4.2 | 1.3 | 3.6 | 4.5 | 4.8 | 0.579 |
| PCI | 12.5 | 8.2 | 4.6 | 7.1 | 6.6 | 0.400 |
| CABG | 0.0 | 1.9 | 2.8 | 7.7 | 7.9 | 0.021 |
| Previous medication (%) | ||||||
| Aspirin | 16.7 | 23.4 | 19.2 | 28.8 | 42.9 | 0.001 |
| Thienopyridines | 0.0 | 3.2 | 6.8 | 12.8 | 7.9 | 0.010 |
| Beta-blockers | 12.5 | 18.4 | 17.8 | 28.8 | 38.1 | 0.001 |
| ACEIs/ARBs | 33.3 | 35.4 | 39.1 | 55.1 | 74.6 | <0.0001 |
| Statins | 50.0 | 28.5 | 29.9 | 39.7 | 47.6 | 0.006 |
| Clinical presentation | ||||||
| ST-segment elevation (%) | 45.8 | 58.2 | 58.4 | 45.5 | 28.6 | <0.0001 |
| Killip class >I (%) | 0.0 | 6.3 | 18.9 | 34.0 | 52.4 | <0.0001 |
| SBP (mmHg) | 131±19 | 127±24 | 128±25 | 129±28 | 137±29 | 0.098 |
| DBP (mmHg) | 82±12 | 78±13 | 79±15 | 76±17 | 79±16 | 0.222 |
| HR (bpm) | 72±17 | 74±18 | 76±18 | 77±19 | 83±23 | 0.030 |
| Renal failure (%)a | 4.2 | 6.3 | 11.7 | 35.9 | 74.2 | <0.0001 |
| Hemoglobin (g/dl) | 15.0±1.4 | 14.2±1.5 | 14.2±1.7 | 13.6±3.2 | 12.1±2.3 | <0.0001 |
ACEIs: angiotensin-converting enzyme inhibitors; ARBs: angiotensin receptor blockers; CABG: coronary artery bypass grafting; CV: cardiovascular; DBP: diastolic blood pressure; HR: heart rate; MI: myocardial infarction; PAD: peripheral arterial disease; PCI: percutaneous coronary intervention; SBP: systolic blood pressure.
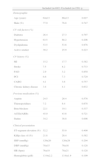
Table 4 shows patients’ in-hospital treatment and angiographic and echocardiographic characteristics according to the number of laboratory predictors elevated on admission. Three-vessel and left main disease (p<0.001) and LV dysfunction (p<0.001) were more frequent in patients with a higher number of laboratory predictors elevated on admission, who were also less often revascularized (p<0.001). Furthermore, percutaneous coronary intervention (PCI) (p<0.0001) and thienopyridines (p<0.0001) and beta-blockers were used less often in these patients, whereas diuretics (p=0.003), aldosterone antagonists (p<0.0001) and intravenous inotropics (p<0.0001) were used more frequently.
Treatment, angiographic and echocardiographic characteristics, and in-hospital events according to the number of laboratory predictors elevated on admission.
| G0(n=24) | G1(n=158) | G2(n=281) | G3(n=156) | G4(n=63) | p | |
| In-hospital medication (%) | ||||||
| (%) | 100 | 100 | 100 | 100 | 100 | |
| Thienopyridines | 100 | 99.4 | 98.6 | 100 | 88.9 | <0.0001 |
| Beta-blockers | 87.0 | 93.7 | 89.3 | 87.2 | 71.4 | <0.0001 |
| ACEIs/ARBs | 91.3 | 87.3 | 89.0 | 90.3 | 84.1 | 0.710 |
| Statins | 100 | 100 | 99.3 | 100 | 99.6 | 0.420 |
| Nitrates | 17.4 | 22.2 | 34.3 | 33.3 | 20.0 | 0.003 |
| UFH | 41.7 | 40.5 | 40.6 | 27.6 | 27.0 | 0.024 |
| LMWH | 62.5 | 60.1 | 63.3 | 75.0 | 76.2 | 0.017 |
| GP IIb/IIIa inhibitors | 0.0 | 14.6 | 11.7 | 11.5 | 6.3 | 0.190 |
| Revascularization | 95.3 | 87.2 | 82.4 | 67.3 | 55.8 | <0.0001 |
| Diuretics | 0.0 | 15.6 | 22.6 | 54.7 | 76.7 | <0.0001 |
| Aldosterone antagonists | 0.0 | 6.3 | 15.7 | 28.0 | 33.3 | <0.0001 |
| IV inotropics | 0.0 | 1.3 | 3.6 | 11.0 | 14.3 | <0.0001 |
| Procedures (%) | ||||||
| Cardiac catheterization | 100 | 100 | 99.3 | 96.2 | 87.3 | <0.0001 |
| PCI | 81.0 | 71.8 | 65.5 | 59.3 | 41.0 | <0.0001 |
| CABG | 14.3 | 15.4 | 16.9 | 8.0 | 14.8 | 0.167 |
| Left main disease | 0.0 | 6.3 | 8.9 | 7.3 | 23.2 | <0.0001 |
| Three-vessel disease | 29.2 | 18.4 | 17.1 | 25.8 | 42.9 | <0.0001 |
| LVSD | 9.1 | 44.9 | 58.5 | 59.4 | 63.3 | <0.0001 |
| In-hospital events (%) | ||||||
| Killip class II-IV | 0.0 | 12.0 | 28.8 | 48.1 | 71.4 | <0.0001 |
| Mortality | 0.0 | 0.6 | 1.1 | 3.2 | 11.1 | <0.0001 |
| Reinfarction | 0.0 | 2.5 | 3.6 | 1.9 | 3.2 | 0.771 |
| Ischemic stroke | 0.0 | 1.3 | 1.1 | 0.6 | 0.0 | 0.868 |
| Hemorrhagic stroke | 0.0 | 0.9 | 0.7 | 0.6 | 1.6 | 0.692 |
ACEIs: angiotensin-converting enzyme inhibitors; ARBs: angiotensin receptor blockers; CABG: coronary artery bypass grafting; CV: cardiovascular; GP: glycoprotein; IV: intravenous; LMWH: low molecular weight heparin; LVSD: left ventricular systolic dysfunction (ejection fraction <50% on echocardiography); PCI: percutaneous coronary intervention; UFH: unfractionated heparin.
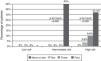
Sixteen (2.4%) patients died during initial hospitalization and 23 (3.4%) died within six months of hospital discharge. The primary outcome (all-cause mortality) was recorded in 39 (5.7%) patients during 6-month follow-up. Patients with a higher number of laboratory predictors elevated on admission had increased in-hospital (p<0.0001) and 6-month mortality (p<0.0001). Table 4 lists the in-hospital events and Figure 1 shows Kaplan-Meier curves for the primary outcome during follow-up according to the number of laboratory predictors elevated on admission.
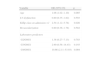
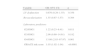
In Table 5, the results of multivariate logistic regression analysis are presented for 6-month mortality according to the number of laboratory predictors elevated on admission. After adjustment for the previously mentioned possible confounding factors, patients with four laboratory predictors elevated on admission had a higher incidence of 6-month mortality compared to patients with none or one, with an odds ratio (OR) of 10.66 (95% confidence interval [CI], 2.11–53.93; p=0.004). When the GRACE risk score was included in the second model (Table 6), the number of biomarkers elevated on admission was still an independent predictor of 6-month mortality; patients with four laboratory predictors elevated on admission had almost 14 times greater risk of 6-month mortality than patients with none or one.
Independent predictors of 6-month mortality on multivariate logistic regression analysis.
| Variable | OR (95% CI) | p |
| Age | 1.06 (1.02–1.10) | 0.005 |
| LV dysfunction | 0.80 (0.35–1.82) | 0.593 |
| Killip class on admission >1 | 2.54 (1.12–5.78) | 0.026 |
| Revascularization | 0.80 (0.36–1.78) | 0.582 |
| Laboratory predictors | ||
| G2/G0G1 | 1.38 (0.27–7.13) | 0.703 |
| G3/G0G1 | 2.90 (0.58–14.43) | 0.193 |
| G4/G0G1 | 10.66 (2.11–53.93) | 0.004 |
CI: confidence interval; G0G1: groups 0 and 1; G3: group 3; G4: group 4 (see text); LV: left ventricular.
Independent predictors of 6-month mortality on multivariate logistic regression analysis.
| Variable | OR (95% CI) | p |
| LV dysfunction | 0.676 (0.29–1.55) | 0.356 |
| Revascularization | 1.55 (0.67–3.57) | 0.304 |
| Laboratory predictors | ||
| G2/G0G1 | 1.22 (0.23–6.41) | 0.811 |
| G3/G0G1 | 2.96 (0.60–14.61) | 0.182 |
| G4/G0G1 | 13.86 (2.83–67.97) | 0.001 |
| GRACE risk score | 1.03 (1.02–1.04) | <0.0001 |
CI: confidence interval; G0G1: groups 0 and 1; G3: group 3; G4: group 4 (see text); LV: left ventricular.
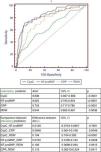
The AUCs for 6-month mortality of CysC, NT-proBNP, CRP and RDW (Figure 2) of all the patients included in the study were, respectively, 0.84 (p<0.0001), 0.83 (p<0.0001), 0.75 (p<0.0001) and 0.64 (p=0.0036). There was no statistically significant difference between the predictive power of CysC and NT-proBNP (differences in AUC); however, CysC and NT-proBNP had stronger predictive power than CRP and RDW, and CRP had stronger predictive power than RDW (Figure 2).
 AUCs of the four biomarkers for 6-month mortality.
 Receiver-operating curves and AUCs of the four biomarkers for 6-month mortality. AUC: area under the receiver-operating characteristic curve for 6-month mortality; CRP: C-reactive protein; CysC: cystatin C; NT-proBNP: N-terminal pro-brain natriuretic peptide; RDW: red blood cell distribution width.
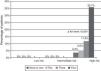
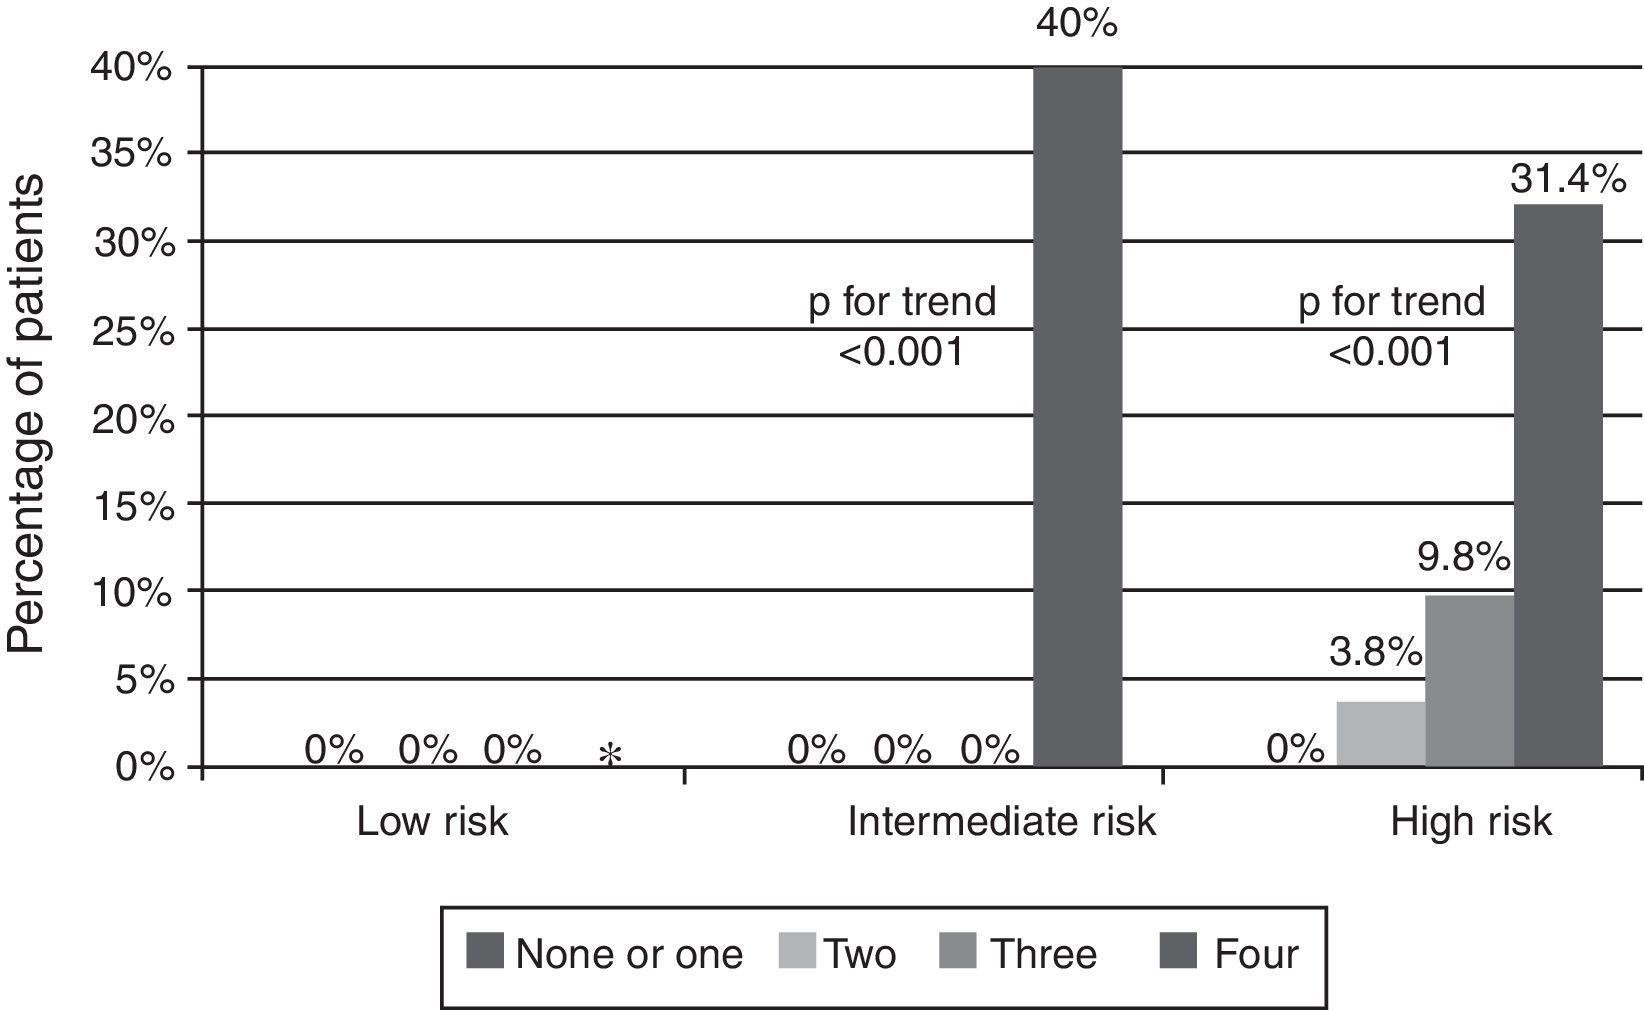
Among patients with a high GRACE risk score, our score was able to further stratify risk, in both patients with STE-ACS (Figure 3) and patients with NSTE-ACS (Figure 4). Patients with low and intermediate risk had a very low mortality in our population. In patients with NSTE-ACS and intermediate GRACE risk, those with four elevated biomarkers on admission had high mortality; in patients admitted for STE-ACS, all patients with four biomarkers elevated on admission were in the high risk group defined by the GRACE score (Figure 3), while in patients admitted for NSTE-ACS and with low risk according to the GRACE score, there were no patients with four elevated biomarkers.
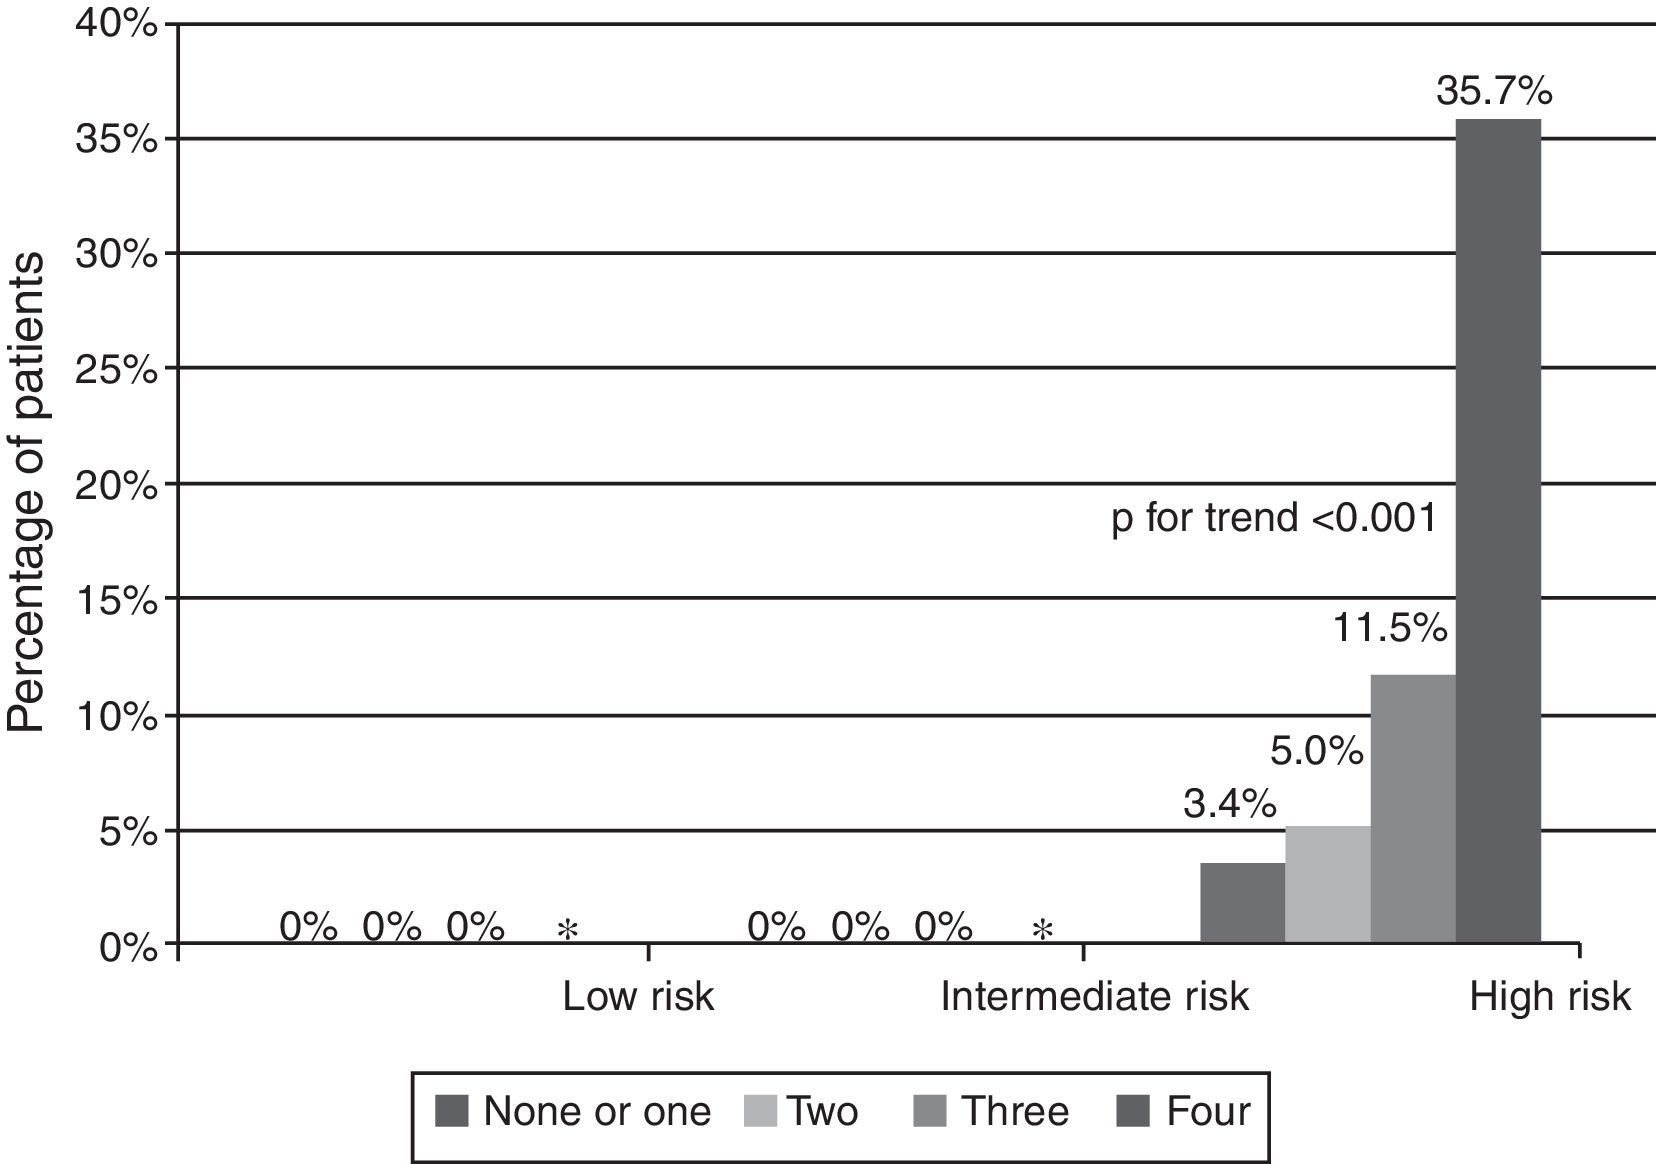
The present study demonstrates that a multimarker approach with CysC, NT-proBNP, CRP and RDW has value in the risk stratification of patients admitted with ACS. We found that a higher number of elevated biomarkers, measured on admission by the same laboratory, was progressively associated with an increased incidence of in-hospital and 6-month mortality in an unselected population of patients admitted for ACS. Moreover, in multivariate logistic regression analysis, the study score (number of biomarkers elevated on admission) was a predictor of mortality independently of other important variables, including the GRACE score; patients with four biomarkers elevated on admission had a significantly higher risk of 6-month mortality than those with none or one. When the population was divided by GRACE risk score into groups of low, intermediate and high risk, our score was able to further stratify risk in both STE-ACS and NSTE-ACS. Patients with low risk had a very low mortality in our population. In patients with NSTE-ACS and intermediate GRACE risk, those with four elevated biomarkers on admission had high mortality. This may be taken into account in the risk stratification of these patients and help in clinical decision-making and management. Another important fact is that patients with four biomarkers elevated on admission were only at intermediate or high risk defined by GRACE, with none in the low risk category. Therefore, having four biomarkers elevated on admission indicates significantly higher risk and may be used in addition to conventional risk scores to complement risk stratification.
As in other registries, patients at higher risk (as reflected by higher biomarker scores) were treated less often with an invasive treatment strategy, which goes against current guidelines. This ‘treatment paradox’ may have contributed to greater risk in patients with a higher score.
CysC and NT-proBNP were the strongest predictors, similar in terms of discriminatory power, followed by CRP and finally RDW. This result may be also taken into account in clinical practice when stratifying risk.
In the present study, we included a marker of hemodynamic stress (NT-proBNP), one of inflammation (CRP), one of renal dysfunction (CysC), and RDW, which covers more than one mechanism (nutritional deficiencies, renal failure and inflammatory stress).6,7 Various studies have shown that NT-proBNP, CRP, CysC, and RDW are also associated with adverse outcomes in patients with ACS independently of hemodynamic stress, inflammation and renal dysfunction.6–18 In addition, all of these biomarkers are commonly used in clinical assessment of patients with ACS and are readily available, which is also an important factor when choosing a biomarker. This specific combination was chosen not only on the basis of the evidence in the above-mentioned studies, but also because they were used individually in the risk stratification of our population of ACS patients in other studies, in which they were good predictors of outcome.7
A large number of candidate biomarkers have been investigated in numerous studies, with the aim of further improving diagnosis and risk assessment in patients with ACS.6–31
Some studies have shown that a multimarker approach provides prognostic information in patients with ACS. To the best of our knowledge, this is the first study adopting a multimarker approach with these specific markers. James et al. made an important contribution to the growing evidence demonstrating that combining a biomarker of hemodynamic stress (brain natriuretic peptide [BNP] or NT-proBNP) or of inflammation (high sensitivity C-reactive protein [hsCRP]) with a biomarker of necrosis (cTnI) enhances risk assessment in patients with ACS.32 Another study, assessing the same biomarkers simultaneously (cTnI, CRP and BNP), showed that a multimarker approach improves the risk stratification of patients with NSTE-ACS.33 Tello-Montoliu et al. found that a multimarker approach based on cTnT, CRP, and NT-proBNP, but not D-dimers, provides added information to the TIMI risk score in terms of ACS prognosis at six months.34 Möckel et al. evaluated the importance of various biomarkers (cTnI, NT-proBNP, hsCRP, placental growth factor, lipoprotein-associated phospholipase A2 (Lp-PLA2), D-dimers, whole blood choline and plasma choline) in patients with ACS and aimed to define their hierarchy with respect to the prediction of major adverse cardiac events over a 42-day follow-up period.35 They used logistic regression synergistically with classification and regression tree (CART) analysis to define a multimarker strategy and the cutoff values and sequencing needed to optimize risk stratification in a low- to moderate-risk emergency department population. They found that a combination of NT-proBNP, whole blood choline and Lp-PLA2 with cutoffs identified by CART analysis was optimal for risk stratification and superior to all other possible combinations of markers.
LimitationsAlthough our study was prospective in nature, it was a non-randomized observational study conducted in a single center, so the results may have been influenced by confounding factors, identified or not, and thus no causality can be determined. Besides, few events occurred, which may limit extrapolation of the results to the general population of patients with ACS. In addition, our analysis is based on only one measurement of all biomarkers, and other studies, perhaps using sequential samples, are warranted to explore whether the prognostic information changes over time.
ConclusionsA multimarker approach using CysC, NT-proBNP, CRP and RDW was an independent predictor of 6-month mortality and added prognostic information to the GRACE risk score in patients with ACS and high risk defined by GRACE, with increasing mortality in patients with a higher number of elevated biomarkers on admission.
Individually, CysC and NT-proBNP are the strongest predictors.
Since the pathophysiology of ACS is complex, a combination of markers representing different mechanisms may be used in the future instead of a single marker. Other studies are needed to find combinations of ideal markers in addition to clinical risk factors.
Ethical disclosuresProtection of human and animal subjectsThe authors declare that no experiments were performed on humans or animals for this study.
Confidentiality of dataThe authors declare that they have followed the protocols of their work center on the publication of patient data and that all the patients included in the study received sufficient information and gave their written informed consent to participate in the study.
Right to privacy and informed consentThe authors declare that no patient data appear in this article.
Conflicts of interestThe authors have no conflicts of interest to declare.
