


Population aging is associated with increased prevalence of cardiovascular diseases that have a significant impact on overall morbidity and mortality. Insulin resistance (IR) and visceral obesity are risk factors for vascular damage and cardiometabolic diseases.
AimsEstimating the correlation between lipid accumulation product (LAP) and IR in elderly individuals and comparing them to traditional anthropometric indices.
MethodsCross-sectional study comprising 411 individuals >60 years, who were treated in a primary care service. Body mass index (BMI), neck circumference (NC), waist circumference (WC), hip circumference (HC), arm circumference (AC), sagittal abdominal diameter (SAD) and waist-hip ratio (WHR) were recorded. IR was estimated based on HOMA-IR (homeostasis model assessment IR index). LAPa index was calculated as [WC-65]×[triglyceride (TG)] in men, and as [WC-58]×[TG] in women, whereas LAPb was calculated by using the minimum WC values recorded for the current sample, i.e., 61.5 cm for women and 71.5 cm for men.
ResultsThere was correlation among LAPa (0.506), LAPb (0.515) and HOMA-IR. LAP was better correlated to HOMA-IR and showed higher area under the curve than BMI, NC, WHR and SAD. Based on the receiver operating characteristic curve analysis, LAPb≥47.40 and LAPa≥52.5 were the best cut-off values used to identify individuals with IR presenting 68.8% and 68.2% sensitivity, and 68.6% and 68.6% specificity, respectively.
ConclusionLAP may be a useful and simple clinical marker to assess cardiometabolic risk factors in the elderly population treated at a primary care service.
O envelhecimento da população associa-se ao aumento da prevalência de doenças cardiovasculares, com um impacto significativo na morbimortalidade geral. Resistência à insulina (RI) e obesidade visceral são fatores de risco para lesão vascular e doença cardiometabólica.
ObjetivoEstimar a correlação entre produto de acumulação de lípidos (LAP) e IR em indivíduos idosos e compará-los com os índices antropométricos tradicionais.
MétodosEste estudo transversal incluiu 411 indivíduos acima de 60 anos, atendidos na atenção primária. Foram registradas índice de massa corporal (IMC), circunferência do pescoço (CP), circunferência da cintura (CC), circunferência do quadril (CQ), circunferência do braço (CA), diâmetro abdominal sagital (DAS) e relação cintura-quadril (RCQ). A RI foi estimada pelo HOMA-IR (índice de avaliação do modelo de homeostase). O índice de PALa foi calculado como [WC-65] × [TG] em homens, e [WC-58] × [TG] em mulheres e PALb foi calculada usando o valor mínimo da CC sendo 61,5 cm para mulheres e 71,5 cm para homens.
ResultadosHouve correlação entre LAPa (0,506), LAPb (0,515) e HOMA-IR. O LAP foi melhor correlacionado com o HOMA-IR e mostrou maior área sob a curva do que o IMC, NC, WHR e SAD. Com base na análise da curva característica operacional do receptor, LAPb ≥47.40 e LAPa ≥52.5 foram os melhores valores de corte utilizados para identificar indivíduos com IR apresentando 68,8% e 68,2% de sensibilidade, e 68,6% e 68,6% de especificidade, respectivamente.
ConclusãoO LAP pode ser um marcador clínico útil e simples para avaliar os factores de risco cardiometabólico na população idosa tratada num serviço de cuidados primários.
Population aging worldwide contributes to increased prevalence of cardiovascular diseases, which have significant impact on overall morbidity and mortality rates.1 Insulin resistance and visceral obesity are risk factors for vascular damage and cardiometabolic diseases; they represent increased risk (2.5 fold) for cardiovascular disease and (5 fold) for diabetes.2,3 Homeostasis model assessment of IR (HOMA-IR) is the method most often used to assess IR in clinical practice4; however, it is high cost and has complex applicability in epidemiological studies about primary care. Visceral fat tissue is an important endocrine organ capable of secreting several adipokines involved in IR5 genesis, as well as in pro-inflammatory and prothrombotic states.
Lipid accumulation product (LAP), calculated based on waist circumference and triglycerides level, has recently been considered a better predictor of all-cause and cardiovascular mortality, as well as the development of diabetes in different age groups and ethnic populations, than BMI, WC and WHR.6–8 In addition, LAP has a stronger correlation to visceral adiposity, in addition to increased levels of lipolysis and adipocytokines, such as interleukin-6, and of plasminogen activator inhibitor-1.9
Several studies have shown that LAP is a simple, accurate and inexpensive index disregarded IR,10 cardiovascular disease,11 diabetes12 and metabolic syndrome.13 Nonetheless, so far, the literature lacks epidemiological data on the clinical significance of LAP among individuals >60 years in Brazil. Aging changes body composition, since it reduces individuals’ lean mass and increases their fat mass, which tends to be redistributed in the body. Consequently, anthropometric measures of central adiposity, such as BMI or abdominal circumference, may not be accurate in elderly individuals.14 The aims of the current study were to assess the correlation between LAP and IR in individuals >60 years who were treated in a primary care service, and to compare them to other traditional anthropometric indices.
Materials and methodsCross-sectional study comprising a convenience sample of 411 volunteer patients (74% women and 26% men) >60 years who were treated at the Geriatric and Medical outpatient Clinic of Municipal Health Foundation, Niteroi, Rio de Janeiro, Brazil. The project was approved by the Research Ethics Committee at the Fluminense Federal University, under protocol number 0183.0.258.10; all participants signed the informed consent form.
Individuals presenting the following issues were excluded from the study: severe obesity (BMI>40 kg/m2), previous liver failure diagnosis, chronic kidney disease requiring renal replacement therapy, corticosteroid and immunosuppressant use, and cognitive impairments.
Medical history, social data collection and drug-use analysis were performed. Patients’ blood pressure was measured with the aid of automatic OMRON HEM 742INT sphygmomanometer (Bannockburn, Illinois, 60015, USA), which was positioned on their left upper limb, after they remained in sitting position to rest for at least five minutes; the mean at the last two measurements was taken into consideration.15
Anthropometric data comprised weight (kg)) and height (cm); they were measured with the aid of a FILIZOLA anthropometric scale (São Paulo, SP, Brazil), based on standards set by the Brazilian National Institute of Metrology Standardization and Industrial Quality. Body mass index was calculated by dividing the weight expressed in kg by the square height expressed in meters. Anthropometric and body composition were assessed by a single appraiser.
Neck circumference (NC) was measured at the base of the patients’ neck, below the thyroid cartilage, by keeping their raised. Waist circumference (WC) was measured at the midpoint between iliac ridges and the last rib, by keeping patients in standing position at the end of expiration. Hip circumference (HC) was measured at the most prominent part between the patients’ waist and thigh.16 All aforementioned measurements were taken with the aid of SANNY inelastic measuring tape (São Bernardo do Campo, SP, Brazil).
Blood samples were taken at 12-hour fasting and analyzed at the Central Public Health Laboratory. Serum fasting glucose (FG), total cholesterol (TC), HDL-cholesterol (HDL-c) and triglycerides (TG) were measured with the aid of commercial Labtest kits (Lagoa Santa, Belo Horizonte, Brazil). LDL-cholesterol (LDL-c) was calculated using the Friedewald equation. Samples were analyzed based on enzymatic method in automated Labmax 240 equipment (Belo Horizonte, Brazil).
Insulin measurements were performed in ELECSYS equipment (Roche, Japan), based on the electrochemiluminescence method. HOMA-IR was calculated by multiplying fasting glucose (mmol/L) by fasting insulin (μIU/mL), divided by 22.5. Insulin resistance was defined by HOMA-IR>2.71.17
Triglyceride-glucose index logarithm (TyG ln) was calculated based on the product of TG (mg/dl) and FG (mg/dl).18
Lipid accumulation product was calculated based on one formula, using difference reference values. LAPa: for women, (WC [cm]-58)×(TG [mmol/L]); men, (WC [cm]-65)×(TG [mmol/L])18-LAPb was calculated based on the minimum WC values recorded for the sample under investigation: 61.5 cm for women and 71.5 cm for men.
Statistical analyses were performed in SPSS software for Windows (version 21.0). P value <0.05 was considered statistically significant. Data were presented in relative frequencies and differences were tested with Pearson's chi-square test, Fisher's exact test and continuity correction, whenever necessary; or in median and interquartile range, where differences were tested with the Mann Whitney test. Spearman correlations were estimated. Receiver operating characteristic (ROC) curve was used to assess LAP performance, whereas anthropometric measurements such as BMI, WC and NC were used to assess sensitivity and specificity in HOMA-IR identification. The area under the curve (AUC) and the ROC curve were calculated by taking into consideration a 95% confidence interval.
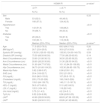
ResultsDemographic, clinical and anthropometric features of the 441 individuals under study (304 women and 107 men) were classified based on the presence or absence of IR (HOMA-IR>=2.71/<2.71), as shown in Table 1. All anthropometric, lipidic profile, uric acid, FG, hypertension and diabetes measurements were positively associated with IR (p<0.01).
Demographics, anthropometric measurements and cardiometabolic risk factors classified based on the presence and absence of insulin resistance.
| HOMA IR | p-value* | ||
|---|---|---|---|
| <2.71 | >=2.71 | ||
| N (%) | N (%) | ||
| Sex | 0.33 | ||
| Male | 53 (52.0) | 49 (48.0) | |
| Female | 168 (57.5) | 124 (42.5) | |
| Hypertension | <0.01 | ||
| Yes | 143 (51.8) | 133(48.2) | |
| No | 78 (66.7) | 39 (33.3) | |
| Diabetes | <0.01 | ||
| Yes | 28 (32.2) | 59 (67.8) | |
| No | 193 (63.1) | 113 (36.9) | |
| Median (25%-75%) | Median (25%-75%) | p-value** | |
| Age | 71.0 (65.0-76.0) | 69.0 (64.0-74.0) | 0.26 |
| BMI (kg/m2) | 26.7 (23.4-29.5) | 30.8 (27.8-33.9) | <0.01 |
| Systolic BP (mmHg) | 135.50 (120.00-152.00) | 135.50 (124.00-149.75) | 0.59 |
| Diastolic BP (mmHg) | 75.50 (68.50-80.50) | 77.50 (69.25-83.00) | 0.14 |
| Neck Circumference (cm) | 33.60 (31.80-36.15) | 36.50 (33.85-39.25) | <0.01 |
| Arm Circumference (cm) | 28.60 (26.20-30.60) | 31.30 (28.50-34.05) | <0.01 |
| Waist Circumference (cm) | 91.60 (84.77-97.65) | 101.10 (94.50-108.95) | <0.01 |
| Hip Circumference (cm) | 96.70 (91.60-104.20) | 103.30 (96.85-109.75) | <0.01 |
| Waist-Hip Ratio | 0.92 (0.88-0.97) | 0.98 (0.93-1.01) | <0.01 |
| SAD (cm) | 20.4 (18.8-22.7) | 23.2 (21-25.5) | <0.01 |
| FG (mg/dL) | 93.0 (86.0-103.0) | 107 (95.5-131.5) | <0.01 |
| Cholesterol (mg/dL) | 205 (179.25-228) | 193 (166.5-226) | 0.07 |
| TG (mg/dL) | 109.0 (84-139.75) | 140 (111.5-187.5) | <0.01 |
| HDL-C (mg/dL) | 56.0 (47.0-65.0) | 51.0 (42.5-60.0) | <0.01 |
| LDL-C (mg/dL) | 120.0 (104-141) | 116 (82-140) | 0.01 |
| Uric Acid (mg/dL) | 3.75 (3.1-4.5) | 4.2 (3.4-5.1) | <0.01 |
| TyG (ln) | 8.52 (8.24-8.89) | 8.96 (8.65-9.35) | <0.01 |
| LAPa | 40.69 (28.83-56.85) | 68.63 (47.36-103.59) | <0.01 |
| LAPb | 36.83 (24.50-51.91) | 63.85 (41.92-96.65) | <0.01 |
BMI: body mass index; BP: blood pressure; FG: fasting glucose; HDL-C: high-density lipoprotein cholesterol l; Homa-IR: homeostatic model assessment of insulin resistance; LAPa: lipid accumulation product index Kahn's sample; LAPb: lipid accumulation product index calculated based on the minimum waist circumference of the study sample; LDL-C: low-density lipoprotein cholesterol; SAD: sagittal abdominal diameter; TG: Triglycerides, TyG (ln): Triglyceride-glucose index logarithm.
Table 2 shows the Spearman's correlation of anthropometric features such as TyG, LAPa and LAPb to HOMA-IR. Correlations ranged from 0.357 (WHR) to 0.515 (LAPb); they were all positive and statistically significant. More specifically, Spearman's correlation among HOMA-IR, LAPa, LAPb was moderate.
Spearman's Correlation among anthropometric features, TyG, LAPa, LAPb and HOMA-IR.
| Spearman's correlation | p value* | |
|---|---|---|
| BMI (kg/m2) | 0.481 | <0.01 |
| Neck Circumference (cm) | 0.396 | <0.01 |
| Arm Circumference (cm) | 0.429 | <0.01 |
| Waist Circumference (cm) | 0.513 | <0.01 |
| Hip Circumference (cm) | 0.381 | <0.01 |
| Waist-Hip Ratio | 0.357 | <0.01 |
| SAD (cm) | 0.497 | <0.01 |
| TyG (ln) | 0.486 | <0.01 |
| Uric Acid (mg/dL) | 0.219 | <0.01 |
| LAPa | 0.506 | <0.01 |
| LAPb | 0.515 | <0.01 |
BMI: body mass index; HOMA-IR: homeostatic model assessment of insulin resistance; LAPa: lipid accumulation product index Kahn's sample; LAPb: lipid accumulation product index calculated based on the minimum waist circumference of the study sample; SAD: sagittal abdominal diameter; TyG (ln): Triglyceride-glucose index logarithm.
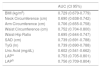
Table 3 presents AUC values recorded for different anthropometric features, TyG, LAPa and LAPb associated with IR. Lapb recorded the highest AUC, and it was followed by LAPa and WC in the overall study population.
Area under the curve values recorded for different anthropometric measures, TyG, LAPa, LAPb and insulin resistance (HOMA IR>=2.71/<2.71).
| AUC (CI 95%) | |
|---|---|
| BMI (kg/m2) | 0.729 (0.679-0.779) |
| Neck Circumference (cm) | 0.690 (0.638-0.742) |
| Arm Circumference (cm) | 0.706 (0.655-0.758) |
| Waist Circumference (cm) | 0.752 (0.704-0.800) |
| Waist-Hip Ratio | 0.695 (0.644-0.747) |
| SAD (cm) | 0.739 (0.691-0.788) |
| TyG (ln) | 0.739 (0.690-0.788) |
| Uric Acid (mg/dL) | 0.602 (0.541-0.662) |
| LAPa | 0.753 (0.705-0.801) |
| LAPb | 0.756 (0.709-0.804) |
BMI: body mass index; HOMA-IR: homeostatic model assessment of insulin resistance; LAPa: lipid accumulation product index Kahn's sample; LAPb: lipid accumulation product index calculated based on the minimum waist circumference of the study sample; SAD: sagittal abdominal diameter; TyG (ln): triglyceride-glucose index logarithm.
Based on the ROC curve analysis, LAPb≥47.40, LAPa≥52.5 and TyG≥8.75 were the best cut-off values used to identify individuals whose IR presented 68.8%, 68.2% and 66.5% sensitivity, and 68.6%, 68.6% and 66.4% specificity, respectively.
DiscussionThe present study assessed the correlation between LAP and IR estimated through HOMA-IR in an elderly population treated at the primary care service under study. LAPb and LAPa were better correlated to HOMA-IR and recorded a higher AUC than BMI, NC, WHR, SAD and TyG.
Kahn19 suggested using gender-specific minimum WC values to represent a hypothetical state according to which TG concentrations are arbitrarily set to zero and WC comprised primarily lean truncal tissue. Clearly, these values are population specific, so the herein performed analysis took into consideration WC values found by Kahn19 - LAPa; and the ones specific to the sample analyzed in the present study - LAPb. LAPb recorded slightly better results than LAPa (Spearman rho: 0.506; 0.515 and AUC: 0.753; 0.756, respectively); this outcome has indicated that the use of sex-specific minimum WC values recorded for the analyzed population is a better alternative than the use of original data.
Visceral lipid accumulation accounts for fat deposition in ectopic tissues such as the liver, pancreas and skeletal muscle,20,21 which leads to metabolic changes such as IR, hypertension, diabetes, hyperuricemia and steatohepatitis and are associated with cardiovascular risk.22 The combination of IR and ectopic fat deposition increases the risk of cardiometabolic diseases and disability in elderly individuals.
Aging leads to increased WC, which is a physiological hazard. Waist circumference is the clinical parameter most frequently used for the indirect assessment of visceral obesity.23 However, it does not differentiate visceral from subcutaneous tissue24 and presents variations depending on the individuals’ breathing, diet, age and ethnicity, which limit its use.25 LAP refers to high lipolysis level in the visceral tissue associated with interleukin-6 and plasminogen production - these cytokines have significant influence on metabolic changes associated with obesity.26 Several studies have shown that LAP, which is the product of TG and WC, is a reliable visceral obesity index and a predictor of IR, diabetes and cardiovascular diseases.19,27 Wakabayashi et al. found an odds ratio for diabetes of 7.40 and 19.09 in Japanese men and women with high LAP, respectively.7
The National Health and Nutrition Examination Survey III cohort study conducted by Kahn19 revealed that higher LAP was associated with higher apolipoprotein B and uric acid levels, lower HDL-C levels and with low density lipoprotein cholesterol (LDL-C), in comparison to BMI. Likewise, LAP was better than BMI at the time to predict changes in glycemic homeostasis and to diagnose diabetes.28 Results in the current study corroborate Kahn's findings, with the exception of apolipoprotein B, which was not tested. Kahn described the association between visceral obesity and atherosclerosis in a Caucasian cohort by comparing LAP to BMI. The author concluded that LAP can be used to predict cardiovascular disease and mortality.
LAP was also positively correlated to higher postprandial glucose levels, insulin response and homeostatic IR assessment model in young healthy Korean women.29 A study conducted among healthy Chinese individuals showed that LAP was positively associated with IR and presented better performance than BMI and WC.30 Based on a study conducted with Brazilian participants (30-74 years), LAP demonstrated independence from multiple confounders, strong association with lipoprotein subfractions and ability to predict diabetes, IR and cardiovascular diseases.31
According to Tanko et al.,32 TG and WC are strong predictors of cardiovascular mortality and aortic calcification progression rates. LAP is an obesity index comprising a lipid variable (TG) and a variable associated with abdominal obesity (WC), which can be considered a useful marker of cardiovascular risk. LAP indicates the excessive lipid accumulation that results in a critical stage at the beginning of the atherogenesis process. The correlation between LAP and IR in the elderly population investigated in the current study may indicate greater risk of incidence of cardiovascular events. Therefore, LAP is a low-cost and easy-to-obtain index capable of identifying elderly individuals at high cardiovascular risk; it can, thus, help preventing cardiometabolic diseases.
The present study has some limitations: the cross-sectional study design, based on small sample size and on individuals >60 years, does not enable the results to be extrapolated to other age groups.
The results showed that the LAP index was better associated with IR in the elderly population than all other known anthropometric measures, which is an important finding since anthropometric measures of central adiposity, such as BMI or abdominal circumference, may not be accurate in elderly individuals. LAP may be a useful and simple clinical marker to assess cardiometabolic risk factors used to prevent cardiovascular diseases among the elderly treated at primary care services.
Disclosure statementThis study did not have financial support. None of the authors has financial ties to commercial entities that could be interested in the subject addressed in this manuscript.
Conflicts of interestThe authors have no conflicts of interest to declare.
