


To analyze the relationship between leptin and obesity expressed as body mass index (BMI) and certain components of the metabolic syndrome (MS) in an adult population.
MethodsThe study included 103 subjects, 42 men and 61 women, aged over 30 years, clinically defined as non-diabetic but with personal or family history of cardiovascular disease. All subjects underwent fasting blood measurement of leptin, insulin, glucose, glucose after ingestion of 75g glucose, HDL cholesterol and triglycerides, and insulin resistance (IR) and BMI were calculated.
ResultsBMI as an index of overall adiposity was strongly associated with serum leptin. BMI rose as serum leptin levels increased from the first to the third tertile; the correlation between leptin and BMI was strong, r=0.524 in men and r=0.603 in women, with high statistical significance (p<0.001); BMI was the best predictor of hyperleptinemia on ROC analysis, with area under the curve (AUC)=0.81 in men and 0.84 in women.
The association between leptin and obesity (BMI≥30kg/m2) showed high odds ratios (OR) in both sexes (10.11 in men, 6.00 in women) on univariate regression analysis and 9.30 in men and 8.21 in women on multivariate regression analysis.
Hyperinsulinemia and IR strongly influenced hyperleptinemia. Leptin was the best predictor of IR in both sexes (AUC=0.89 in men and 0.85 in women), and IR in men (AUC=0.79) and hyperinsulinemia in women (AUC=0.78) were the best predictors of hyperleptinemia after BMI. The correlations between leptin and IR, and leptin and insulinemia, were strong in both sexes.
With regard to MS components, increased serum levels of the study variables were observed as leptin concentrations rose from the first to the third tertile (with the exception of HDL cholesterol, which decreased).
ConclusionElevated serum leptin, particularly in obese individuals, should be taken as a warning sign of energy imbalance, poor diet, hyperinsulinemia, insulin resistance, or changes in other metabolic risk factors that are strongly associated with cardiovascular disease and type 2 diabetes.
Estudar a relação que a leptina tem com a obesidade (expressa em índice de massa corporal) e alguns componentes da síndrome metabólica (SM) numa amostra da população adulta.
População e métodosEm 103 indivíduos, 42 homens e 61 mulheres, com idades superiores a 30 anos, clinicamente definidos como não diabéticos mas com patologia cardiovascular e/ou antecedentes familiares de doenças cardiovasculares (DCV), determinaram-se, além da leptina, a insulina, a glicémia em jejum e após ingestão de 75g de glicose, HDL-c, triglicéridos e calcularam-se os índices de resistência à insulina (IR-HOMA) e de massa corporal (IMC).
ResultadosO IMC, tomado como índice de obesidade geral, condicionou os níveis séricos da leptina.
O IMC subiu, em ambos os sexos, à medida que os níveis séricos da leptina se elevaram do 1.° para o 3.° tercil da respetiva distribuição.
Foi muito forte a correlação leptina/IMC com r=0,524 nos homens e r=0,603 nas mulheres, significância estatística elevada.
Na previsão da hiperleptinémia, a posição cimeira foi assumida pelo IMC com AUC (area under curve) de 0,81 nos homens e 0,84 nas mulheres.
Ao avaliar-se a magnitude da associação da leptina, aos diferentes fatores de risco (regressão logística binária univariada) observaram-se valores muito altos de odds ratio (OR) para a relação leptina/IMC, em ambos os sexos (10,11 nos homens e 6,00 nas mulheres).Verificou-se mesmo (regressão logística multivariada) que a hiperleptinémia foi condicionada, em ambos os sexos, pela obesidade com OR de 9,30 nos homens e 8,1 nas mulheres, considerando IMC≥30kg/m2.
- A hiperinsulinémia e a IR influenciaram profundamente a hiperleptinémia.
Na previsão da IR, a leptina surgiu, em ambos os sexos, como primeiro elemento (AUC=0,89 nos homens e 0,85 nas mulheres) e, na previsão da hiperleptinémia, vêm logo a seguir à obesidade (IMC), a IR nos homens e a hiperinsulinémia nas mulheres com AUC respetivamente de 0,79 e 0,78.
Foram fortes as correlações leptina/IR-HOMA e leptina/insulina, em ambos os sexos e enorme a influência que nos homens teve a hiperinsulinémia (OR=11,71) e a IR nas mulheres (OR=21,22).
- Relativamente aos componentes da SM:.
Observou-se elevação dos respetivos níveis séricos, à medida que as concentrações da leptina subiram do 1.° para o 3.° tercil da respetiva distribuição (com exceção do HDL-c, que desceu).
ConclusãoO aumento da leptina sérica, sobretudo nos indivíduos obesos, deve constituir sinal de alerta para desiquilíbrios energéticos e do regimen alimentar, para a existência de hiperinsulinémia, de IR, de alterações em outros fatores de risco metabólicos que têm profunda influência nas DCV e diabetes tipo 2.
Leptin is a protein hormone mainly produced in adipose tissue, the mass of which it regulates through its effects on food intake and energy metabolism. It is also involved in other physiological processes including reproduction; it has its own receptors that are distributed throughout the body and the mechanisms by which it acts are beginning to be understood.1
This population-based study is in the same ambit as research under way in different countries into the relationships between insulin, insulin resistance (IR), metabolic syndrome (MS) and elevated leptin levels. However, due to limitations in the study and in the scope of our work, certain important aspects of these issues will not be addressed here, as at present no firm conclusions can be drawn. These include the pathophysiological mechanisms that link obesity and the atherosclerotic process and hence cardiovascular disease (CVD) and MS; how the adipose tissue of general obesity leads to the development of systemic IR; the cellular and molecular mechanisms underlying insulin secretion and sensitivity; the causes of leptin resistance; and the reasons for the marked differences in leptin levels between men and women.
The aim of the present study is to examine the relationship between leptin and obesity and MS, specifically hyperinsulinemia and IR but also other components of the syndrome including hyperglycemia, hypertriglyceridemia and low HDL cholesterol. All of these elements influence the atherogenic process and need to be better understood if they are to be prevented or treated, in order to reduce the already high prevalence of CVD and type 2 diabetes.
Three main aspects will be analyzed: leptin and obesity, leptin and MS, and gender differences in leptin levels.
MethodsThe study population consisted of 103 individuals aged over 30 years, 42 men and 61 women, being treated at a preventive cardiology clinic, clinically defined as non-diabetic but with CVD and/or family history of CVD or type 2 diabetes. Mean age was 48.3±9.7 years, with no significant difference between the sexes.
Laboratory testsBlood samples were taken with subjects having fasted for at least 12 hours. Serum leptin levels were determined by enzyme-linked immunosorbent assay (ELISA) using a DSL-10-23100 Active human leptin ELISA kit (Diagnostic Systems Laboratories, Webster, Texas).
Biochemical parameters were quantified by colorimetric enzymatic methods in a Hitachi 911 auto-analyzer (Boehringer Mannheim, Kobe, Japan), using reagents from Roche Diagnostics GmbH. Serum insulin concentrations were determined in an IMMULITE analyzer using a solid-phase chemiluminescence enzyme immunometric assay with IMMULITE reagents from Diagnostic Products Corporation.
Body mass index (BMI) was calculated as weight in kg divided by height in m2. The homeostasis model assessment of insulin resistance (HOMA-IR) score was calculated using the formula proposed by Matthews et al.2 (fasting blood insulin concentration in μU/ml×fasting blood glucose in mmol/l/22.5)2.
Definitions and reference valuesHyperglycemia was defined as fasting glucose >110mg/dl (6.1mmol/l), and hyperinsulinemia as fasting insulin above the 75th percentile of the respective distributions: 16.3μU/ml (117pmol/l) for men and 11.7μU/ml (84pmol/l) for women.
The 75th percentile for the HOMA-IR score in our population was 3.0, and insulin resistance was accordingly defined as HOMA-IR score ≥3 and/or glucose intolerance (fasting glucose ≥110mg/dl [≥6.1mmol/l] and/or an oral glucose tolerance test ≥126mg/dl [≥7.8mmol/l] twohours after ingestion of 75g glucose).
Individuals were defined as dyslipidemic if they had one or both of the following: HDL cholesterol <35mg/dl (<0.9mmol/l) for men and <39mg/dl (<1.0mmol/l) for women, and triglycerides ≥150mg/dl (≥1.7mmol/l).
Obesity was defined as BMI ≥30kg/m2.3
The World Health Organization criteria4 for the metabolic syndrome were used – insulin resistance plus two of the following: BMI ≥30kg/m2, triglycerides ≥150mg/dl (≥1.7mmol/l), and HDL cholesterol <35mg/dl (<0.9mmol/l) for men and <39mg/dl (<1.0mmol/l) for women.
Statistical analysisIn the comparison between the three tertiles of leptin levels, one-way ANOVA was used to compare continuous quantitative variables with normal distribution and the non-parametric Kruskal–Wallis test otherwise. Correlations between data sets were calculated by Pearson's correlation coefficient.
The strength of associations was expressed as odds ratios (OR) and 95% confidence intervals (CI) through logistic regression analysis. Variables showing a statistically significant association with elevated leptin levels on univariate binary logistic regression were then analyzed by multivariate logistic regression. Receiver operator characteristic (ROC) curves were constructed for leptin and the MS components under study.
SPSS for Windows version 14.0 (Chicago, Illinois, USA) was used for the statistical analysis. A p value <0.05 was considered statistically significant.
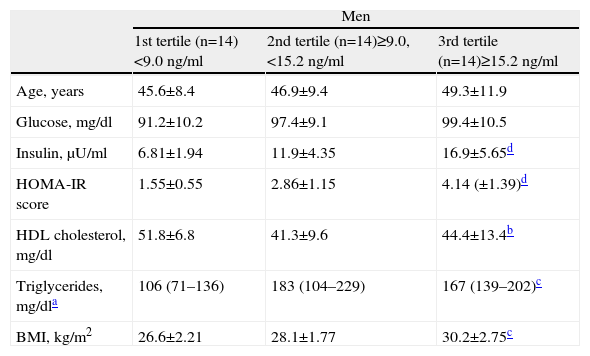
ResultsTable 1 shows the general characteristics of the study population, divided by gender and grouped by tertiles of leptin levels.
Characteristics of the study population by gender and by tertiles of leptin concentrations.
| Men | |||
| 1st tertile (n=14)<9.0ng/ml | 2nd tertile (n=14)≥9.0, <15.2ng/ml | 3rd tertile (n=14)≥15.2ng/ml | |
| Age, years | 45.6±8.4 | 46.9±9.4 | 49.3±11.9 |
| Glucose, mg/dl | 91.2±10.2 | 97.4±9.1 | 99.4±10.5 |
| Insulin, μU/ml | 6.81±1.94 | 11.9±4.35 | 16.9±5.65d |
| HOMA-IR score | 1.55±0.55 | 2.86±1.15 | 4.14 (±1.39)d |
| HDL cholesterol, mg/dl | 51.8±6.8 | 41.3±9.6 | 44.4±13.4b |
| Triglycerides, mg/dla | 106 (71–136) | 183 (104–229) | 167 (139–202)c |
| BMI, kg/m2 | 26.6±2.21 | 28.1±1.77 | 30.2±2.75c |
| Women | |||
| 1st tertile (n=20)<24.6ng/ml | 2nd tertile (n=20)≥24.6, <47.1ng/ml | 3rd tertile (n=21)≥47.1ng/ml | |
| Age, years | 47.4±9.0 | 48.3±9.6 | 48.1±8.7 |
| Glucose, mg/dl | 85.5±7.7 | 93.7±11.5 | 89.7±13.2 |
| Insulin, μU/ml | 6.9 (5.05–7.30) | 9.00 (7.43–11.55) | 11.7 (8.15–14.45)d |
| HOMA-IR score | 1.35 (1.01–1.69) | 2.07 (1.61–2.59) | 2.28 (1.68–3.15)d |
| HDL cholesterol, mg/dl | 63.2±11.9 | 63.7±16.2 | 57.9±10.1 |
| Triglycerides, mg/dla | 84±53.8 | 108±44.1 | 111±43.7 |
| BMI, kg/m2 | 24.2±2.93 | 27.1±3.19 | 30.2±5.20d |
Data presented as means±standard deviation for continuous variables with normal distribution and medians (interquartile range) for non-normal distributions. Conversion factors: to convert blood glucose from mg/dl to mmol/l multiply by 0.0555; to convert blood insulin from μU/ml to pmol/l multiply by 6.946; to convert HDL cholesterol from mg/dl to mmol/l multiply by 0.0259; to convert triglycerides from mg/dl to mmol/l multiply by 0.0113.
In both sexes, as leptin levels rose from the first to the third tertile the values of the other variables also rose, with the exception of HDL cholesterol. Most of these associations were statistically significant, particularly for blood insulin and HOMA-IR in both sexes and BMI in women.
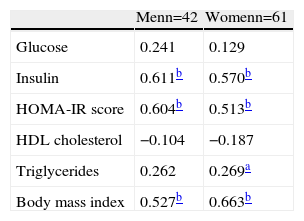
In Table 2 it can be seen that the correlations between leptin levels and insulin, HOMA-IR and BMI were very strong (p<0.001); the association was less strong for triglycerides in women, but still statistically significant (p<0.01). As expected, leptin levels correlated negatively with HDL cholesterol.
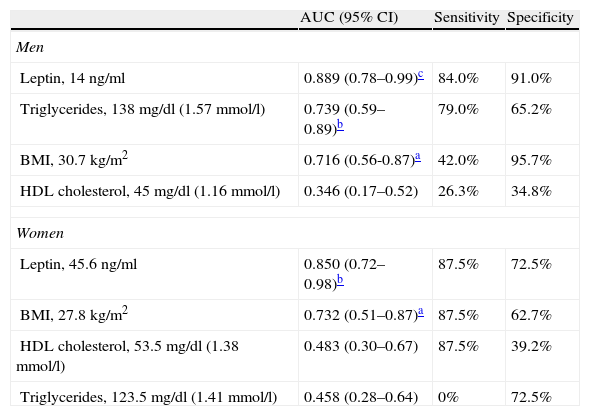
ROC curves and area under the curve (AUC) for the ability of the variables and risk factors under study to predict IR are shown in Figure 1 and Table 3. It can be seen that the cutoff for leptin was 14ng/ml for men and 45.6ng/ml for women, with 84% sensitivity and 91% in men, and 87.5% sensitivity and 72.5% specificity in women, followed by triglycerides and BMI in men and by BMI in women.

Area under the ROC curve, sensitivity, specificity and cutoff values for leptin, triglycerides, body mass index and HDL cholesterol as predictors of insulin resistance, by gender.
| AUC (95% CI) | Sensitivity | Specificity | |
| Men | |||
| Leptin, 14ng/ml | 0.889 (0.78–0.99)c | 84.0% | 91.0% |
| Triglycerides, 138mg/dl (1.57mmol/l) | 0.739 (0.59–0.89)b | 79.0% | 65.2% |
| BMI, 30.7 kg/m2 | 0.716 (0.56-0.87)a | 42.0% | 95.7% |
| HDL cholesterol, 45mg/dl (1.16mmol/l) | 0.346 (0.17–0.52) | 26.3% | 34.8% |
| Women | |||
| Leptin, 45.6ng/ml | 0.850 (0.72–0.98)b | 87.5% | 72.5% |
| BMI, 27.8kg/m2 | 0.732 (0.51–0.87)a | 87.5% | 62.7% |
| HDL cholesterol, 53.5mg/dl (1.38mmol/l) | 0.483 (0.30–0.67) | 87.5% | 39.2% |
| Triglycerides, 123.5mg/dl (1.41mmol/l) | 0.458 (0.28–0.64) | 0% | 72.5% |
AUC: area under the curve; BMI: body mass index; CI: confidence interval.
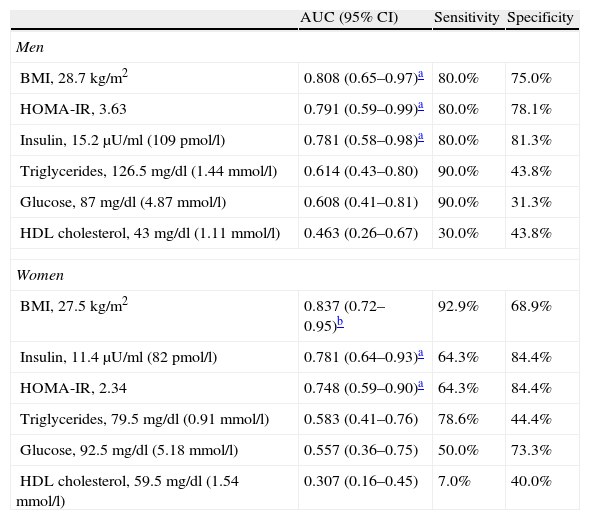
BMI was the best predictor of high leptin levels in both sexes, with a cutoff of 28.7kg/m2 in men and 27.5kg/m2 in women having specificity and sensitivity of 75%/80% and 68.9%/92.9%, respectively, followed by insulin levels in women and HOMA-IR in men (Figure 2 and Table 4).

Area under the ROC curve, sensitivity, specificity and cutoff values for body mass index, HOMA-IR, insulin, triglycerides, glucose and HDL cholesterol as predictors of high leptin levels, by gender.
| AUC (95% CI) | Sensitivity | Specificity | |
| Men | |||
| BMI, 28.7kg/m2 | 0.808 (0.65–0.97)a | 80.0% | 75.0% |
| HOMA-IR, 3.63 | 0.791 (0.59–0.99)a | 80.0% | 78.1% |
| Insulin, 15.2μU/ml (109pmol/l) | 0.781 (0.58–0.98)a | 80.0% | 81.3% |
| Triglycerides, 126.5mg/dl (1.44mmol/l) | 0.614 (0.43–0.80) | 90.0% | 43.8% |
| Glucose, 87mg/dl (4.87mmol/l) | 0.608 (0.41–0.81) | 90.0% | 31.3% |
| HDL cholesterol, 43mg/dl (1.11mmol/l) | 0.463 (0.26–0.67) | 30.0% | 43.8% |
| Women | |||
| BMI, 27.5kg/m2 | 0.837 (0.72–0.95)b | 92.9% | 68.9% |
| Insulin, 11.4μU/ml (82pmol/l) | 0.781 (0.64–0.93)a | 64.3% | 84.4% |
| HOMA-IR, 2.34 | 0.748 (0.59–0.90)a | 64.3% | 84.4% |
| Triglycerides, 79.5mg/dl (0.91mmol/l) | 0.583 (0.41–0.76) | 78.6% | 44.4% |
| Glucose, 92.5mg/dl (5.18mmol/l) | 0.557 (0.36–0.75) | 50.0% | 73.3% |
| HDL cholesterol, 59.5mg/dl (1.54mmol/l) | 0.307 (0.16–0.45) | 7.0% | 40.0% |
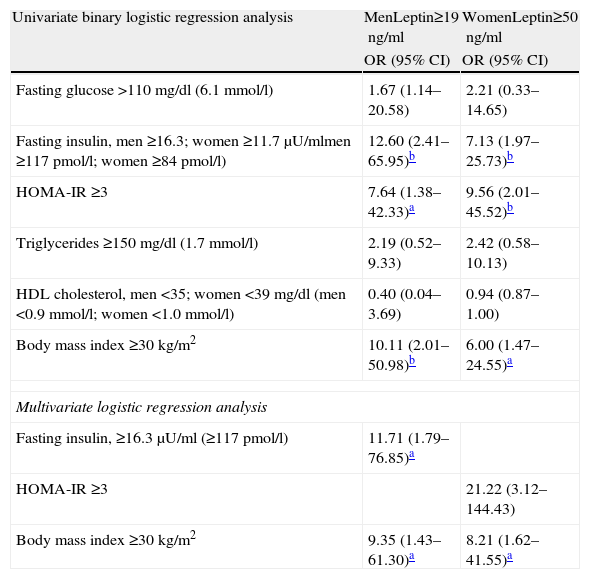
Assessment of the associations between leptin levels and the risk factors under study expressed as ORs (Table 5) reveals that they were consistently strongest in both sexes for hyperinsulinemia (12.60 in men and 7.13 in women), HOMA-IR (7.64 and 9.56) and obesity (10.11 and 6.00).
Risk factors associated with high leptin values.
| Univariate binary logistic regression analysis | MenLeptin≥19ng/ml | WomenLeptin≥50ng/ml |
| OR (95% CI) | OR (95% CI) | |
| Fasting glucose >110mg/dl (6.1mmol/l) | 1.67 (1.14–20.58) | 2.21 (0.33–14.65) |
| Fasting insulin, men ≥16.3; women ≥11.7μU/mlmen ≥117pmol/l; women ≥84pmol/l) | 12.60 (2.41–65.95)b | 7.13 (1.97–25.73)b |
| HOMA-IR ≥3 | 7.64 (1.38–42.33)a | 9.56 (2.01–45.52)b |
| Triglycerides ≥150 mg/dl (1.7mmol/l) | 2.19 (0.52–9.33) | 2.42 (0.58–10.13) |
| HDL cholesterol, men <35; women <39mg/dl (men <0.9mmol/l; women <1.0mmol/l) | 0.40 (0.04–3.69) | 0.94 (0.87–1.00) |
| Body mass index ≥30kg/m2 | 10.11 (2.01–50.98)b | 6.00 (1.47–24.55)a |
| Multivariate logistic regression analysis | ||
| Fasting insulin, ≥16.3μU/ml (≥117pmol/l) | 11.71 (1.79–76.85)a | |
| HOMA-IR ≥3 | 21.22 (3.12–144.43) | |
| Body mass index ≥30kg/m2 | 9.35 (1.43–61.30)a | 8.21 (1.62–41.55)a |
CI: confidence interval; OR: odds ratio.
On multivariate logistic regression analysis the variables associated with high leptin levels were hyperinsulinemia and obesity in men and IR and obesity in women.
DiscussionLeptin and obesityLeptin is produced mainly in adipose tissue in quantities proportional to its mass and is governed by the Ob gene. It is now known to be an important regulator of body weight, triggering various physiological mechanisms according to the state of the body's energy balance: serum leptin levels act as sensors of the energy balance, communicating information on energy accumulated in adipose tissue to the hypothalamus. High levels lead to reduced appetite and increased energy expenditure, while low levels, reflecting weight loss, increase appetite and reduce energy expenditure. However, in obese individuals, these mechanisms are impaired: high leptin levels do not have these effects. This is leptin resistance.
The physiological mechanisms behind leptin synthesis, secretion and receptor binding and its regulation of appetite and energy expenditure involve numerous hormones and neurotransmitters. These mechanisms are complex and are not fully understood.1,5,6
In this study BMI was used as an indicator of general obesity. In both sexes the rise in BMI from the first to the third tertile of leptin levels was statistically significant (p<0.05 in men and <0.001 in women), practically mirroring the cutoff for obesity (30.9kg/m2 in men and 29.1kg/m2 in women) for the highest tertile (Table 1). Similarly, the correlation coefficients of this association were very strong (r=0.524 in men and r=0.603 in women), with high statistical significance (p<0.001) (Table 2).
BMI was also the strongest predictor of high leptin levels, as shown by AUC of 0.81 in men and 0.84 in women (Figure 2 and Table 4).
The same relation between leptin and obesity was seen in the strong association between elevated leptin levels and the different risk factors and MS components under study, with BMI ≥30kg/m2 showing ORs of 10.11 in men and 6.00 in women on univariate analysis and 9.30 in men and 8.21 in women on multivariate analysis (Table 5).
Leptin and metabolic syndromeThe results of this study show that hyperinsulinemia and IR strongly influence leptin levels (Figures 1 and 2, Tables 3 and 4); leptin was the main predictor of IR in both sexes (AUC=0.89 in men and 0.85 in women), while after obesity, IR in men and hyperinsulinemia in women were the strongest predictors of high leptin levels (AUC=0.79 and 0.78, respectively).
The correlations between leptin levels and HOMA-IR and insulinemia were also strong (Table 2), particularly insulinemia in men (OR=11.71) and IR in women (OR=21.22) (Table 5).
Hyperinsulinemia and IR are major elements of MS, reflecting the strong interconnections between metabolic risk factors for CVD (especially coronary disease), type 2 diabetes and hypertension; when present together, these risk factors have multiplicative rather than additive effects, greatly increasing the morbidity and mortality caused by these conditions.7 This inter-relation can be seen in Table 1, which shows that, with the exception of HDL cholesterol, the study variables (which are in fact MS components), all rose in a statistically significant fashion from the first to the third tertile of leptin levels.
The relationship between leptin, hyperinsulinemia, and other MS components is so clear that serum leptin could be considered an additional component of MS and a new cardiovascular risk factor.8 The prevalence of MS continues to rise (27.5% in Portugal9) in parallel with the obesity pandemic and is now seen in children and adolescents10,11; for some authors it is the main mechanism in the pathogenesis of CVD.7
The precise mechanisms behind the development of IR in the adipose tissue characteristic of general obesity, and the role of leptin, are still the subject of debate, despite considerable research and the clinical implications.
Adipocytes are among the cells most affected by the action of insulin, which induces preadipocytes to differentiate into adipocytes and then stimulates energy storage in the form of triglycerides. In obesity-related IR this mechanism is impaired, in both skeletal muscle and the liver.
The location of adipose tissue influences the development of IR, with abdominal deposits being more strongly associated with IR (and hence with risk for type 2 diabetes and CVD) than peripheral (gluteal or subcutaneous) fat deposits. One possible but as yet unproven explanation is that intra-abdominal adipocytes are more lipolytically active, which would increase the flow of free portal fatty acids, leading to IR by acting on insulin receptors, reducing their sensitivity and that of subsequent metabolic pathways.12
Adipose tissue is no longer considered merely as storing energy in the form of triglycerides; adipocytes in fact function as endocrine glands, producing and secreting protein hormones including leptin, adiponectin, and adiposin, cytokines such as TNF-α and PAI-1 that are important for homeostasis, angiotensinogen (which regulates vascular tone), steroid hormones like estrogens and cortisol, and substrates such as free fatty acids. Through these products adipocytes influence not only local biology but also overall metabolism in different areas including the brain, liver, muscle, pancreatic beta cells, gonads, lymph glands and blood vessels.
At the same time, some of the products secreted mean that adipose tissue plays a part in the development of IR. This is the case with TNF-α, leptin, peroxisome proliferator-activated receptor gamma (PPAR-γ)13 and cAMP response element-binding protein (CREB).14 PPAR-γ, a transcription factor expressed abundantly in adipose tissue, has a central role in adipocyte differentiation and in the development of obesity caused by fat-rich diets and of IR. CREB is activated in adipocytes in obesity, leading to IR through reduction of adiponectin production and hence the loss of its protective effect against IR, and in atherosclerosis, which also modulates insulin sensitivity. Increased adipose tissue, together with probable changes in liver function, will raise TNF-α levels and promote lipolysis, leading to the release of free fatty acids, which would also trigger IR. Investigation of the possible role of leptin in the different stages of non-alcoholic fatty liver disease, which is also linked to obesity and IR, has led to the conclusion that there is no association, although leptin seems to have some effect in preventing progression of the disease.15,16
Leptin has pleiotropic effects, and besides its important role in energy homeostasis described above, it contributes to maintenance of insulin sensitivity via the hypothalamus, acting in tissues that are sensitive to insulin, and profoundly influencing glucose and lipid metabolism. Defects in these mechanisms that reduce leptin's action (leptin resistance) are linked to the etiopathogenesis of obesity and IR, but the precise relationship is not fully understood.
Gender differences in leptin levelsIn this study, serum leptin levels ranged from 1.8 to 47.1ng/ml in men and from 6.4 to 88.4ng/ml in women, with first and third tertiles respectively of <9 and >15.2ng/ml, in men and <24.6 and >47.1ng/ml in women (Table 1), while cutoff values based on the 75th percentile for leptin levels were 19 and 50ng/ml in men and women, respectively. We thus found, as have many authors, that serum leptin levels in females are approximately three times higher than in males, a ratio that is found in children and adolescents, pre- and post-menopausal women, and in the elderly. This difference raises various questions.17–19
In our study, obesity defined by BMI was the strongest predictor of high leptin levels (Figure 2 and Table 4). It is suggested, though not without controversy, that the influence of fat mass on leptin levels depends on its location, with greater expression of leptin mRNA in the subcutaneous adipose tissue characteristic of women than in the abdominal adiposity that predominates in men. Some authors relate this gender difference in fat distribution to differences in lipid profile and glucose–insulin homeostasis that are more favorable in women, which was also found in our study (Table 1), since for similar BMI values, women had lower levels of lipids, glucose and insulin, which would make them less vulnerable to the effects of obesity.19
ConclusionsThere is a direct positive association between serum leptin levels and obesity as measured by BMI. Leptin levels were strongly associated with hyperinsulinemia and IR, with small differences between the sexes, but only weakly related to other components of MS.
In this population-based study, women had much higher leptin levels than men. Analysis of the reasons for this difference is beyond the scope of our study; the subject is controversial, particularly with regard to the role of the sex hormones.
Elevated serum leptin, particularly in obese individuals, should be taken as a warning sign of energy imbalance, insulin resistance, hyperinsulinemia, and the changes in glucose and lipid metabolism that are strongly associated with the onset and development of CVD and type 2 diabetes.
The small sample size and the fact that the participants were being treated at a preventive cardiology clinic are limitations of the study.
Conflicts of interestThe authors have no conflicts of interest to declare.
Please cite this article as: Martins MC, et al. Relação entre a leptina, a massa corporal e a síndrome metabólica numa amostra da população adulta. Rev Port Cardiol 2012. doi:10.1016/j.repc.2012.08.002.
