


To determine the prevalence of microalbuminuria (MAU) in outpatients with hypertension and/or type 2 diabetes mellitus (DM) and in normotensive, non-diabetic outpatients (control group); and, as secondary objectives, to examine the differences in the distribution of MAU in the four subgroups and the association of different clinical and epidemiological variables with MAU.
MethodsRACE (micRoAlbumin sCreening survEy) was a multicenter, descriptive observational cross-sectional study, which enrolled outpatients followed in primary care in Portugal. Patients with potential reasons for a false-positive MAU test were excluded. The main outcome measures were the prevalence of MAU as assessed by Micral® test strips and blood pressure. Demographic variables, presence of comorbidities, use of cardiovascular and antidiabetic drugs and biochemical variables were also analyzed.
ResultsA total of 9198 patients (3769 with hypertension, 3100 with both DM and hypertension, 423 with DM and without hypertension, and 1906 controls), 54.7% women, were included in the primary analysis. Overall prevalence of MAU was 58% in patients with DM and hypertension, 51% in patients with DM, 43% in patients with hypertension, and 12% in controls (chi-square: p<0.001 for all subgroups). In multivariate analysis, predictors for MAU were the presence of DM or hypertension, HbA1C, male gender, age, systolic blood pressure and total cholesterol.
ConclusionsMAU is extremely common in outpatients with DM and/or hypertension followed in primary care, especially in those with both hypertension and DM and high cardiovascular risk. MAU screening would help identify individuals at risk and increase awareness of kidney disease and target organ damage.
Determinar a prevalência de microalbuminúria (MAU) em doentes hipertensos (HTA) e/ou diabéticos tipo 2 (DM2) e em normotensos não diabéticos (grupo controlo). Como objetivos secundários, analisar as diferenças de distribuição da MAU nas quatro subpopulações e observar a associação de variáveis clínicas e epidemiológicas diversas com a MAU.
MétodosO RACE (micRoAlbumin sCreening survEy) é um estudo epidemiológico descritivo, observacional de corte transversal, multicêntrico, que incluiu doentes acompanhados nos Cuidados de Saúde Primários (CSP) em Portugal. Os doentes com causas potenciais de falsos positivos para MAU foram excluídos. As avaliações principais foram a frequência da MAU, determinada pelo teste da tira reativa Micral-Test®, a pressão arterial (PA), as variáveis demográficas, as doenças concomitantes, a medicação cardiovascular e antidiabética e as variáveis bioquímicas.
ResultadosUm total de 9198 participantes (3769 hipertensos, 3.100 diabéticos tipo 2 hipertensos, 423 diabéticos normotensos e 1906 controlos), 54,7% do sexo feminino, foram incluídos na análise primária. A prevalência de MAU foi de 58% nos doentes com HTA+DM2, 51% nos doentes com DM2, 43% nos doentes com HTA e de 12% no grupo controlo (χ2: p<0,001 para todos os subgrupos). Numa análise multivariada, os preditores de MAU foram presença de DM2 ou de HTA, a HbA1c, o sexo masculino, a idade, a PA sistólica e o colesterol total.
ConclusõesA MAU é extremamente frequente nos doentes em CSP com diabetes e/ou hipertensão, particularmente em doentes com HTA e DM2 com risco cardiovascular elevado. O rastreio da MAU poderá facilitar a identificação de indivíduos em risco e aumenta a atenção para a doença renal e as lesões nos órgãos alvo.
blood pressure
body mass index
coronary artery disease
confidence interval
chronic renal failure
diabetes mellitus
glomerular filtration rate
general practitioner
glycated hemoglobin
heart failure
low-density lipoprotein
left ventricular hypertrophy
microalbuminuria
oral antidiabetic
odds ratio
primary health center
peripheral vascular disease
renin-angiotensin system
transient ischemic attack
target organ damage
Recent studies highlight the importance of microalbuminuria (MAU) as a strong marker of cardiovascular risk, in both hypertensive and diabetic patients, as well as in the general population.1–6 Clinical trials have reported associations between MAU and left ventricular hypertrophy, carotid intima-media thickening and various subclinical cardiovascular states in patients at high cardiovascular risk.7–11 Furthermore, several epidemiological and experimental studies have highlighted the relationship between urinary albumin excretion and cardiovascular and total mortality, particularly in at-risk patients,2,6,11–14 with an independent and cumulative effect in the presence of renal dysfunction.13–15 The association with increased cardiovascular mortality in high-risk individuals has been observed even for albumin levels lower than those generally regarded as MAU.13,16,17
Thus, screening for albuminuria, following the indications in the latest guidelines for the management of arterial hypertension,11 allows rapid and accurate identification of individuals who would benefit from a more aggressive approach to risk reduction, particularly for primary prevention; it is also a valuable additional risk measure in secondary prevention. Nevertheless, it is frequently overlooked in clinical practice,18 as awareness of its value as a marker of target organ damage (TOD) and a strong prognostic factor is generally poor.
Data on the prevalence of albuminuria and MAU in Portugal are scarce and results are often contradictory, due to differences in methodology and heterogeneous populations.8
RACE (micRoAlbumin sCreening survEy) is an observational epidemiological study, the primary objective of which was to determine the prevalence of MAU in patients with hypertension and/or type 2 diabetes mellitus (DM) and in normotensive, non-diabetic patients followed in primary health centers (PHCs) in Portugal. The secondary objectives were to examine the differences in the distribution of MAU in the four subgroups studied and the association of different clinical and epidemiological variables with MAU in each of the subgroups.
MethodsThe study was conducted in accordance with the 1991 International Guidelines for Ethical Review of Epidemiological Studies (Council for the International Organizations of Medical Sciences), the Declaration of Helsinki and the International Conference on Harmonization of Good Clinical Practice. All participants gave their written informed consent. The methodology used to collect the data was approved by the Portuguese Data Protection Commission.
PatientsParticipants who met the inclusion and exclusion criteria were divided into four groups (hypertensive, diabetic, hypertensive diabetic and normotensive non-diabetic).
The inclusion criteria for patients with hypertension and/or type 2 DM were: age ≥18 years, with hypertension (blood pressure [BP] ≥140/90 mmHg or under antihypertensive therapy) and/or diagnosed DM (fasting blood glucose ≥126 mg/dl or 2-hour glucose level ≥200 mg/dl or under oral antidiabetics [OADs] and/or insulin) and laboratory test results in the previous 12 months. Pregnant, menstruating or breastfeeding women were excluded, as were patients monitored regularly in nephrology consultations, those with febrile disease or concomitant urinary tract infection, type 1 DM, autoimmune disease or receiving treatment with oxytetracycline, and those participating in vigorous physical activity in the previous 24 hours, all of which increase the likelihood of a false positive result for MAU.
Inclusion criteria for the control group were: age ≥18 years, BP<140/90 mmHg, fasting blood glucose <110 mg/dl and not taking antihypertensive medication or OADs or insulin.
Study design and proceduresRACE was a multicenter, descriptive, observational, cross-sectional epidemiological study. Recruitment took place between October 2010 and January 2011 and 469 general practitioners (GPs) participated (145 from the North region, 150 from the Central region, 101 from the Lisbon region, 36 from the Alentejo, 17 from the Algarve, 7 from Madeira and 13 from the Azores).
In order to minimize selection bias, each GP recorded the inclusion and exclusion criteria of the first four patients seen each day until 20 participants fulfilled the inclusion criteria of the respective groups – 15 with hypertension and/or DM and five normotensive non-diabetic controls – and did not present any exclusion criteria. Those not fulfilling all the criteria were considered ineligible.
In order to ensure the consistency of the results, all PHCs screened for MAU using Micral® test strips, which have a sensitivity of over 80%,19,20 following a standard procedure for sample collection and testing. The levels of MAU considered in the analysis were <20 mg/l (negative result), ≥20 mg/l to <50 mg/l, ≥50 mg/l to <100 mg/l and ≥100 mg/dl. The results were entered in the patients’ records and data were collected on the following variables: demographic (age, gender, weight, height, body mass index [BMI], smoking and physical activity); comorbidities (dyslipidemia, stroke or transient ischemic attack [TIA], peripheral vascular disease [PVD], coronary artery disease [CAD], left ventricular hypertrophy [LVH], heart failure [HF] or other); and cardiovascular medication (lipid-lowering drugs, antihypertensives, digoxin, antiarrhythmics and antianginals); anticoagulants, antiplatelets, and OADs or insulin. Two BP measurements were taken at least 1 min apart, following standard procedures. The following laboratory test results were also recorded if assessed at least once in the previous 12 months: fasting blood glucose, glycated hemoglobin (HbA1c), serum creatinine, total cholesterol, high-density and low-density lipoprotein (LDL) cholesterol and triglycerides.
Statistical analysis and sample sizeThe sample size was calculated based on estimates for the four patient groups under study (hypertensives, diabetics, hypertensive diabetics and controls). Estimates of the prevalence of MAU range between 4% and 46%; the higher value was used to determine the sample size. With a sample error of 5% (for a 95% confidence interval), 382 individuals per patient subgroup from each of the seven regions (five NUTS II regions plus two autonomous regions) would be required. Each region would thus include 1528 participants, a total of 9168; on the assumption that 10% would be ineligible, the overall size of the sample would be 10085 participants.
Descriptive statistics were used to analyze all the data collected. Means, medians and standard deviations were determined for quantitative variables, and absolute and relative frequencies for qualitative variables. All estimates were accompanied by 95% confidence intervals. The normality of distribution of the quantitative variables was assessed using the Kolmogorov-Smirnov test, bivariate tests (t tests, ANOVA, chi-square test) and multivariate analyses in accordance with the study objectives. Independent factors associated with MAU were obtained using a stepwise logistic regression model (Wald test) (p<0.05 for entry and p>0.10 for exit). The level of significance for all analyses was 0.05 (two-tailed).
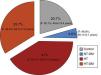
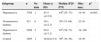
ResultsStudy population, demographic data and cardiovascular historyDuring the three and a half months of the study a total of 11288 participants were recruited, of whom 1641 (14.5%) were ineligible. The final study population included 9198 individuals, of whom 41% were hypertensive (n=3769), 33.7% hypertensive diabetic (n=3100) and 4.6% normotensive diabetic (n=423), the remaining 20.7% constituting the control group (normotensive non-diabetic; n=1906) (Table 1 and Figure 1).
Distribution of the sample among the four groups studied.
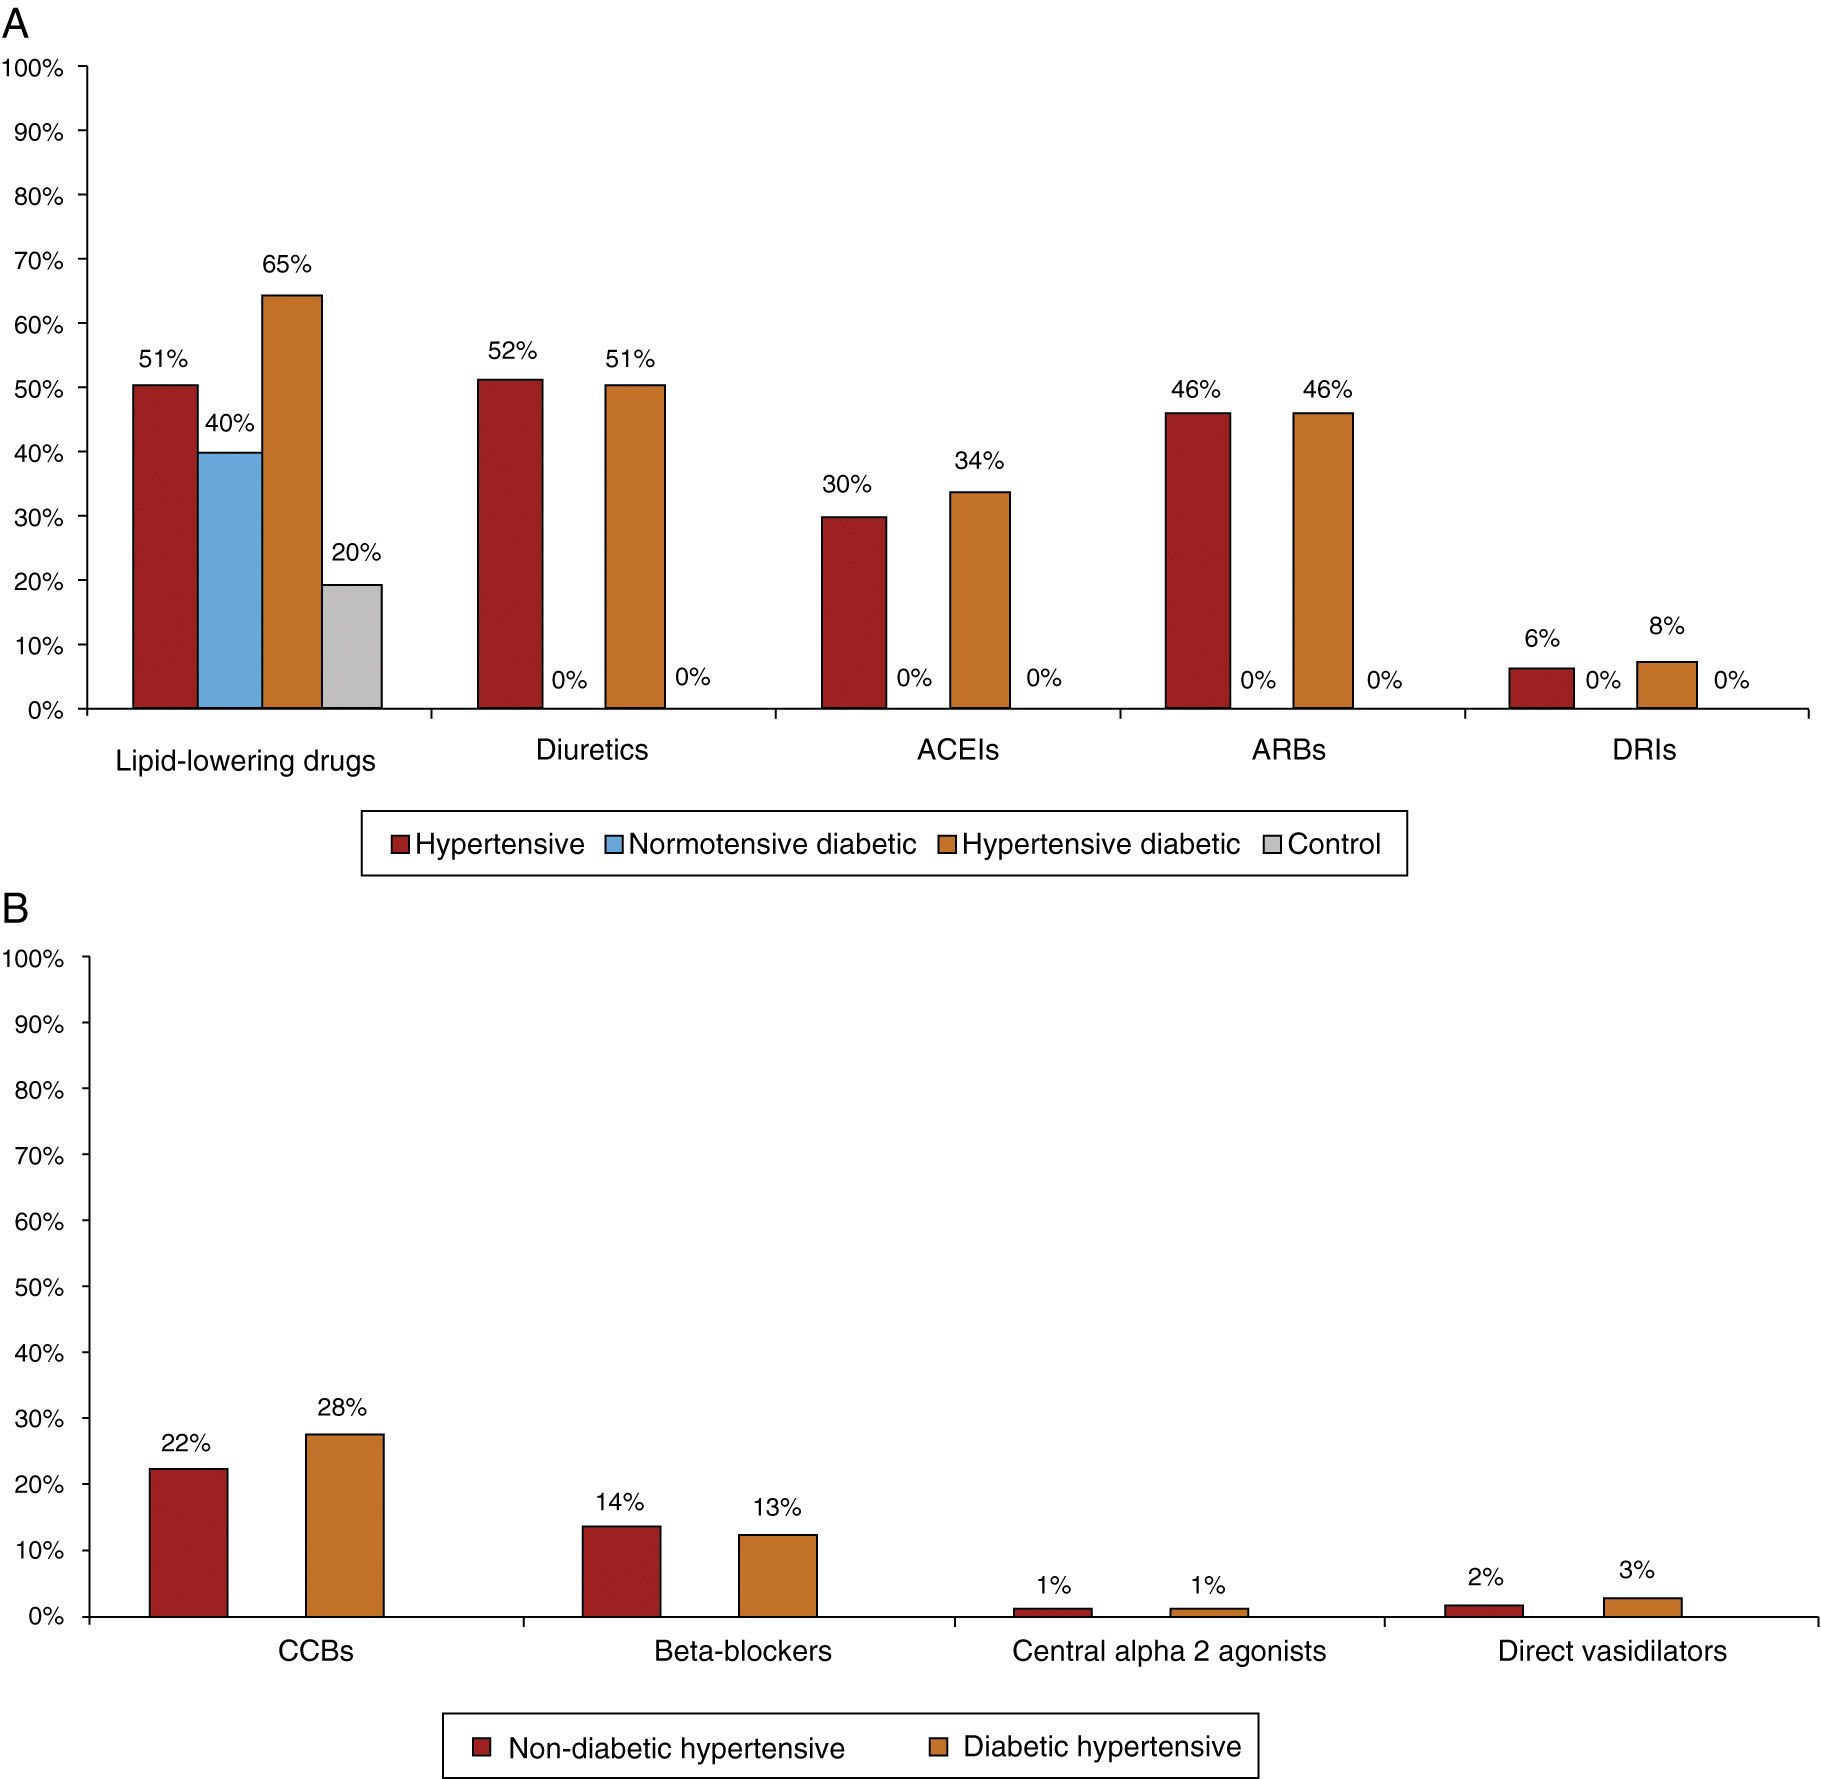
| Subgroup | n | % | 95% CI* |
|---|---|---|---|
| Hypertensive | 3769 | 41.0 | 40.0–42.0% |
| Normotensive diabetic | 423 | 4.6 | 4.2–5.1% |
| Hypertensive diabetic | 3100 | 33.7 | 32.7–34.7% |
| Control | 1906 | 20.7 | 19.9–21.6% |
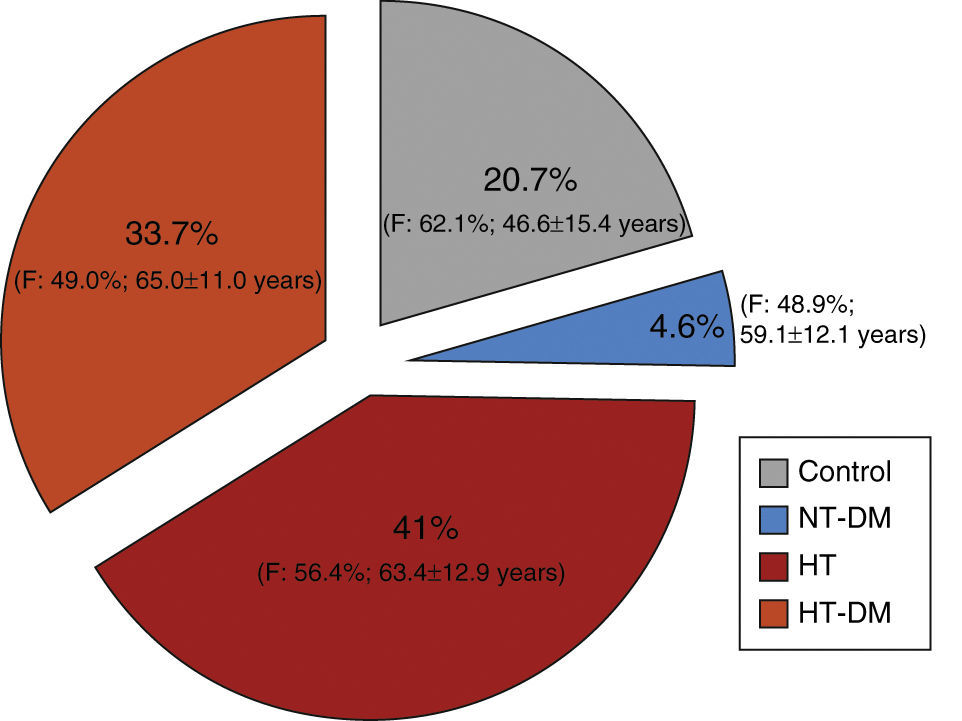
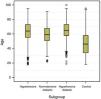
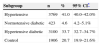
Overall, there was a slight predominance of women (54.7%), which was significantly higher in the control and hypertensive groups. The normotensive diabetic group was the only one in which the gender distribution did not differ significantly from the general Portuguese population (Table 2). Mean and median ages of the four subgroups are shown in Table 3 and Figure 2. Median age differed significantly in all subgroups (p<0.001); the hypertensive diabetic group was significantly older (mean age 65±11.1 years), followed by the hypertensive group (mean age 63.4±12.9 years), the normotensive diabetic group (mean age 59±12.2 years) and the control group (mean age 46.6±15.4 years).
Distribution of the sample by gender for each of the groups studied.
Age (years) in the four groups studied.
| Subgroup | n | No data | Mean (±SD) | Median (P25-P75) | Min.-max. | p* |
|---|---|---|---|---|---|---|
| Hypertensive | 3768 | 1 | 63.4 (±12.9) | 64b (55–73) | 18–95 | <0.001 |
| Normotensive diabetic | 423 | 0 | 59.1 (±12.2) | 59c (51–68) | 22–91 | |
| Hypertensive diabetic | 3098 | 2 | 65.0 (±11.1) | 65a (58–73) | 19–100 | |
| Control | 1905 | 1 | 46.6(±15.4) | 46d (34–58) | 18–95 |
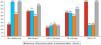
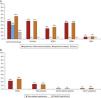
Most hypertensives were uncontrolled (only 34% had BP<140/90 mmHg), although BP control was better in the hypertensive diabetic group (63.7% had BP<140/90 mmHg). More than a third of participants were obese; the percentage of obese individuals was higher among hypertensive diabetics (only 59% had BMI<30 kg/m2). Blood glucose control was also poor (HbA1c<7% in 32–33% of diabetics). Overall, dyslipidemia was present in 73% of the hypertensive diabetic group, 62.5% of non-diabetic hypertensives, and 51% of normotensive diabetics. More than 60% of the study population had LDL-cholesterol <130 mg/dl. However, with regard to the risk profile of the study population, LDL-cholesterol <100 mg/dl was observed in only 25% of hypertensives, 31% of normotensive diabetics and 34% of hypertensive diabetics. There was a tendency for favorable triglyceride values (<150 mg/dl) in these populations, although this was less common among hypertensive diabetics (Figure 3). Smoking was more common in the control group (16%), and less common in the remaining subgroups (11% in normotensive diabetics, 10% in hypertensives and 9.3% in hypertensive diabetics).
 BMI: body mass index;
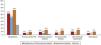
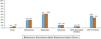
 Figure 4 shows comorbidities by subgroup. Previous stroke/TIA was rare in the control group and highest (8.3%) in the hypertensive diabetic group. PVD and CAD were also infrequent in the control group; PVD prevalence was 14.7% in hypertensive diabetics, 9% in hypertensives and 5.4% in normotensive diabetics, while CAD prevalence was highest in hypertensive diabetics (12.3%).
 TIA: transient ischemic attack.'/>
Only 1% of controls and 1.4% of normotensive diabetics had LVH; this figure rose to 9.9% in hypertensives and 14.4% in hypertensive diabetics, giving an overall prevalence in hypertensives of 11.9%. A history of HF was observed in 9.4% of hypertensive diabetics, with much lower percentages in non-diabetic hypertensives (4.9%) and normotensive diabetics (0.2%).
Lastly, with regard to chronic renal failure (CRF), 17.8% of diabetic and non-diabetic hypertensives had stage 3 CRF, with estimated glomerular filtration rate (GFR) of <60 ml/min/1.73 m2.
Global cardiovascular risk and cardiovascular and antidiabetic medicationBased on risk factors, with poor BP and blood glucose control, and cardiovascular comorbidities, the population presented a high global cardiovascular risk profile. According to the 2012 and 2013 European guidelines on cardiovascular risk,11,21 of the 8823 patients analyzed (risk assessment was not possible in 375) 22.3% were at very high risk and 39.6% at high risk (a total of 61.9%), while 18% were at intermediate risk and 20.2% at low risk.
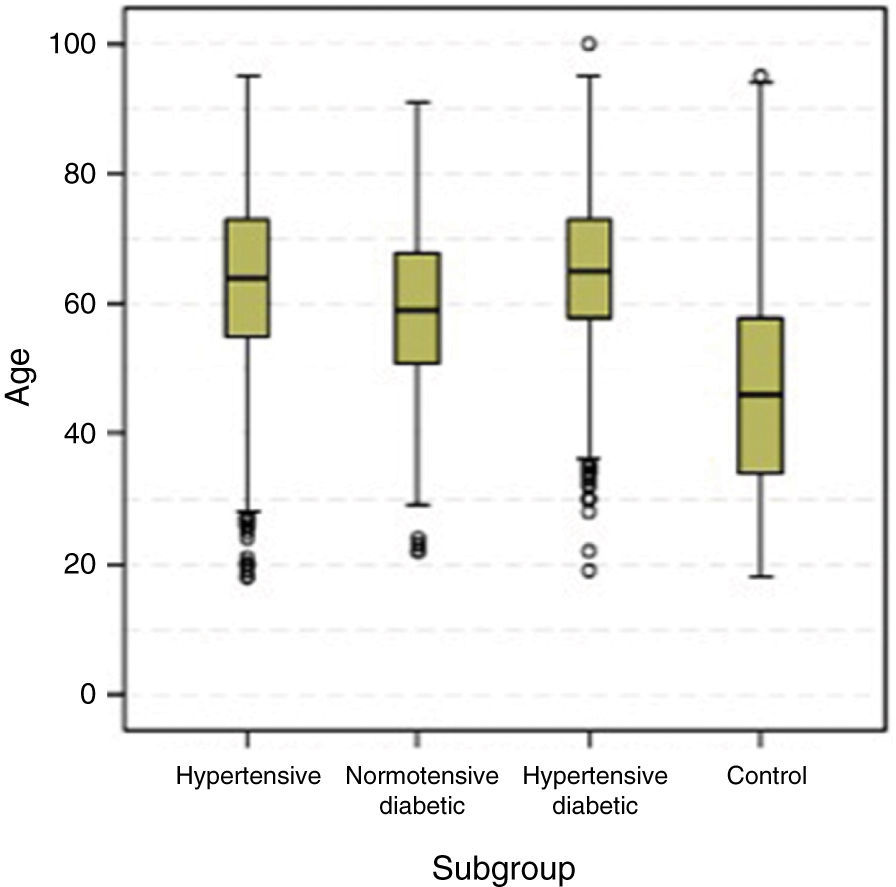
Most patients were taking cardiovascular medication, mainly lipid-lowering drugs (50.5% of hypertensives and 64.9% of diabetic hypertensives, as well as 40.4% of normotensive diabetics and 19.7% of controls) and antihypertensives (particularly renin-angiotensin system [RAS] inhibitors, prescribed in 84.8% of hypertensives: 37.5% with angiotensin-converting enzyme inhibitors, 54.3% with angiotensin receptor blockers and 8.2% with direct renin inhibitors) (Figure 5A and5B). Of the total of hypertensives, diabetic and non-diabetic (n=6869), 11.3% were taking no antihypertensive medication. Of the remaining 88.7%, 30% were taking one antihypertensive (of whom 54.6% had uncontrolled BP), 46% were taking two and 24% more than two. Use of OADs or insulin in hypertensive and normotensive diabetics is shown in Figure 6; there were no significant differences in prescription patterns between these two groups.
(A) Percentage of patients medicated with lipid-lowering drugs, diuretics and inhibitors of the renin-angiotensin system by subgroup. ACEIs: angiotensin-converting enzyme inhibitors; ARBs: angiotensin II receptor blockers; DRIs: direct renin inhibitors. (B) Percentage of non-diabetic and diabetic hypertensives medicated with other antihypertensives by subgroup. CCBs: calcium channel blockers.
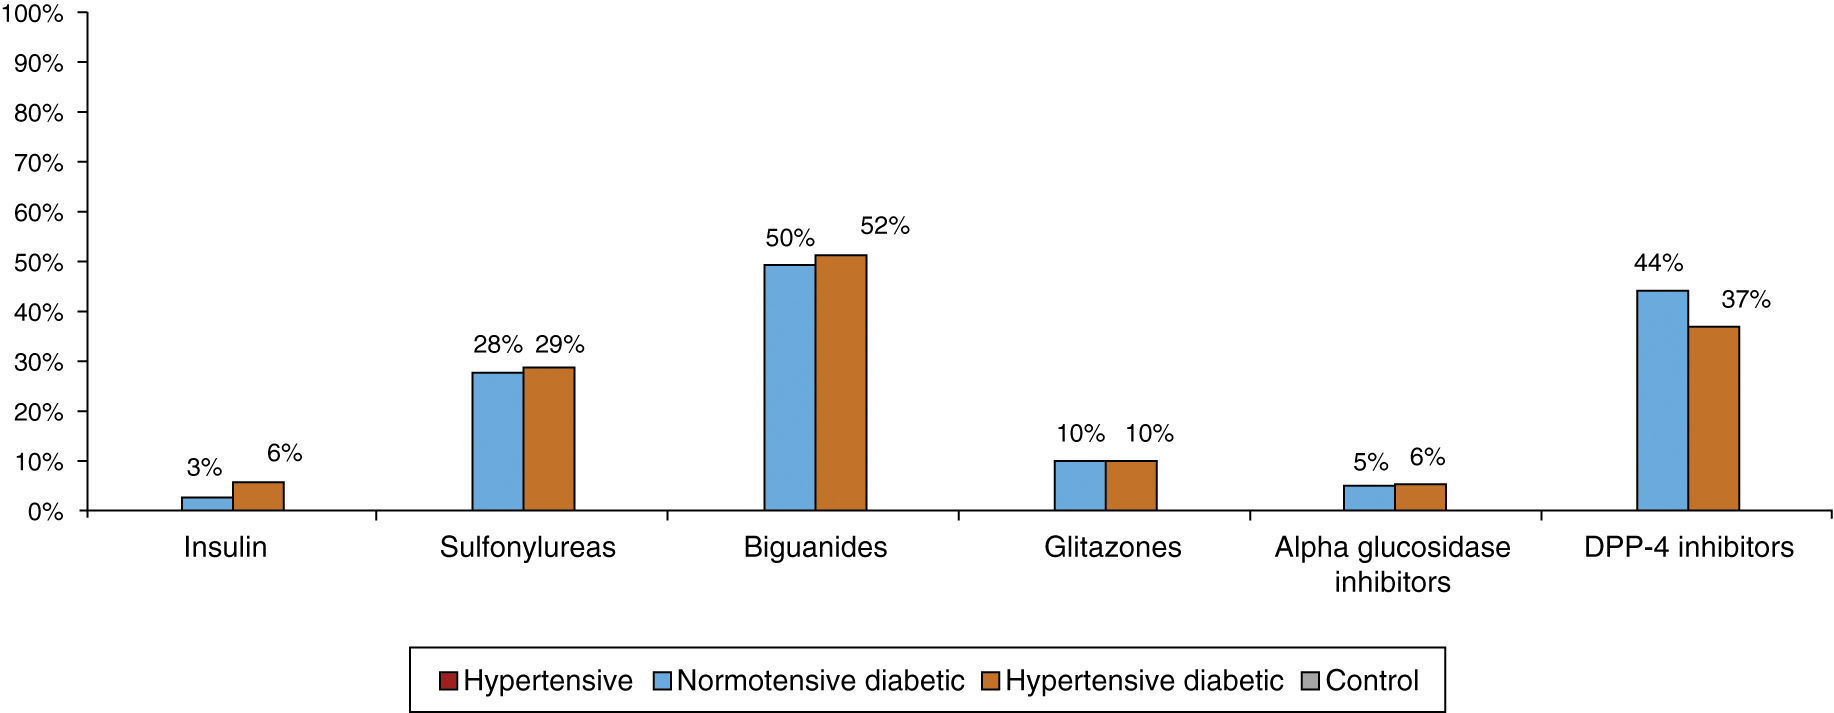
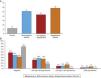
Figure 7A shows the prevalence of MAU in the different subgroups. The highest prevalence (58%) was observed among hypertensive diabetics, closely followed by normotensive diabetics (51%). The prevalence among non-diabetic hypertensives was 43% and 49.3% of all hypertensives, markedly higher than the 12% observed among controls. The differences between groups were significant (chi-square: p<0.001). Figure 7B presents the percentage distribution of MAU values as assessed by urine strip testing, showing that 42.5% of non-diabetic hypertensives had a positive test, lower than in normotensive diabetics (51.4%) and hypertensive diabetics (57.6%), while 20.6% of controls had a positive MAU test.

Logistic regression analysis showed that the following factors were associated with a positive MAU test: DM (odds ratio [OR] 3.675; p<0.001), hypertension (OR 2.350; p<0.001) and, interestingly, hypertension treated by calcium channel blockers (CCBs) (OR 1.261; p=0.039) or antiplatelets (OR 1.391; p=0.001), as well as age, male gender, HbA1c, total cholesterol and systolic BP (Table 4).
Multivariate logistic regression analysis of factors associated with microalbuminuria.
| Variable | OR | 95% CI | p |
|---|---|---|---|
| Age (years) | 1.012 | 1.004–1.021 | 0.005 |
| Male | 1.253 | 1.044–1.505 | 0.016 |
| HbA1c (%) | 1.320 | 1.192–1.462 | <0.001 |
| Total cholesterol (mg/dl) | 1.004 | 1.001–1.006 | 0.004 |
| HDL cholesterol (mg/dl) | 0.990 | 0.982–0.999 | 0.032 |
| Systolic BP (mmHg) | 1.016 | 1.010–1.022 | <0.001 |
| Hypertension | 2.350 | 1.494–3.697 | <0.001 |
| DM | 3.675 | 2.140–6.311 | <0.001 |
| Hypertension and DM | 0.295 | 0.172–0.505 | <0.001 |
| Hypertension+CCBs | 1.261 | 1.012–1.571 | 0.039 |
| Hypertension+antiplatelets | 1.391 | 1.135–1.705 | 0.001 |
AUC=0.715 (95% CI: 0.694–0.736); p (Hosmer-Lemeshow)=0.723; R2 (Cox-Snell)=14.30%; R2 (Nagelkerke)=19.30%.
AUC: area under the curve; BP: blood pressure; CCBs: calcium channel blockers; CI: confidence interval; DM: diabetes mellitus; HbA1c: glycated hemoglobin; HDL: high-density lipoprotein; OR: odds ratio.
Despite the known importance of MAU as a marker of cardiovascular risk and overall mortality in patients with hypertension and/or diabetes and in the general population,22,23 data are sparse on its prevalence in individuals at high risk. The reported prevalence varies considerably (4–46%),24 and so there is no clear picture of the extent of the problem. One multicenter study,8 similar to ours in some respects and also using urine strip testing, reported an overall prevalence of MAU of 58.4%, ranging between 53% and 71% in different countries.
Data on MAU prevalence in Portugal are even scarcer. A study of 1582 non-diabetic hypertensives (almost all medicated with antihypertensives but only 41% with controlled BP) reported positive MAU tests (with Micral test strips) in 29%.18 In our study, mainly of patients at high cardiovascular risk, the prevalence of MAU was higher, ranging between 43% in non-diabetic hypertensives to 58% in diabetic hypertensives. Bearing in mind that MAU reflects long-term harmful effects on the cardiovascular system, from systemic vascular endothelial dysfunction to renal damage (with podocyte injury and glomerular endothelial dysfunction),25,26 our results indicate that patients treated in PHCs in Portugal represent a high risk burden.
The conflicting results for MAU prevalence among previous studies and between our results and those of others may be attributed to differences in the characteristics of the populations studied.
Obviously, the high prevalence of MAU reported here must be interpreted in the light of the characteristics of the study population, which hinders generalization of the results: 41% of patients were hypertensive and 34% were both diabetic and hypertensive (only 4.2% of diabetics were normotensive); mean age was ≥60 years; there was poor control of risk factors (hypertension, dyslipidemia and hyperglycemia), a significant prevalence of comorbidities, only moderate use of antihypertensives and OADs, particularly renoprotective agents and drugs that reduce proteinuria (RAS inhibitors and statins); and a large proportion of patients were at high (40%) or very high (22%) cardiovascular risk. Patients regularly monitored in nephrology consultations were excluded, and it is thus to be expected that those with known CRF (and MAU) are not represented in this population, even though almost 18% of the hypertensive group had GFR of <60 ml/min/1.73 m2.
The results show a clear relationship between MAU and male gender, diabetes and hypertension, particularly with HbA1c and systolic BP, and use of CCBs and antiplatelets, which is in agreement with other studies8 and highlights the known but frequently neglected importance of effective cardiovascular risk factor control. The association of MAU with certain drug classes may be due to the severity of the underlying disease (for example, diabetes and/or hypertension) and concomitant disease or TOD, rather than deriving from a known or unknown pharmacological effect.
Despite the large number of patients enrolled, which reflects daily clinical practice and is an important aspect of the study, certain limitations should be borne in mind when interpreting its results. The population consisted of patients who sought medical attention during the study period, which may have introduced selection bias. Furthermore, screening of MAU was performed only once, whereas the guidelines recommend repeating the test once or twice more to confirm results; thus our data do not show how many patients would have a positive or negative result on retesting. However, some studies suggest that fulfilling this requirement only reduces prevalence by a fifth or a third at most.27,28 Furthermore, we believe that many of the factors associated with transient increases in urinary albumin excretion would have been eliminated by the study's exclusion criteria. Finally, the cross-sectional nature of the study does not allow causal links to be established between MAU and TOD or concomitant cardiovascular disease; this would only be possible through specially designed longitudinal studies. However, studies on the predictive value of MAU in this population are in progress.20
ConclusionsThe results of the RACE study demonstrate that MAU is extremely common in patients followed in primary care, especially those with both hypertension and DM and high cardiovascular risk. Routine MAU screening by urine strip testing would help identify individuals at risk and increase awareness of kidney disease and TOD. Patients with MAU frequently present other risk factors and screening would aid risk stratification and therapeutic decision-making. It is essential to increase awareness, promote effective treatment and improve cardiovascular prevention.
Ethical disclosuresProtection of human and animal subjectsThe authors declare that the procedures followed were in accordance with the regulations of the relevant clinical research ethics committee and with those of the Code of Ethics of the World Medical Association (Declaration of Helsinki).
Confidentiality of dataThe authors declare that they have followed the protocols of their work center on the publication of patient data.
Right to privacy and informed consentThe authors have obtained the written informed consent of the patients or subjects mentioned in the article. The corresponding author is in possession of this document.
Conflicts of interestTeresa Carqueja is employed by Novartis Farma - Produtos Farmacêuticos S.A.
The authors thank all the study investigators for their work in collecting patient data, as well as all the patients who agreed to participate in the study.
Please cite this article as: Marques da Silva P, Carvalho D, Nazaré J, et al. Prevalência da microalbuminúria em doentes hipertensos e/ou diabéticos tipo 2 nos Cuidados de Saúde Primários em Portugal: Estudo RACE (micRoAlbumin sCreening survEy). Rev Port Cardiol. 2015;34:237–246.
