


Metabolic syndrome (MS) is a major health problem, and has economic effects on enterprises. The workplace is thus an important environment for primary prevention of risk factors for cardiovascular disease.
ObjectiveTo determine the prevalence of MS and variables related to its development in hospital workers.
MethodsWe performed a cross-sectional study of 740 workers in a large university hospital. Socioeconomic variables, anthropometric and blood pressure measurements, and laboratory exams were analyzed. MS was defined according to the criteria of the International Diabetes Federation.
ResultsOf the 740 workers, 72.4% were female and mean age was 34.9±9.5 years; 27.8% worked the morning shift, 20.3% the afternoon shift, 34.1% office hours, and 17.8% the night shift. As to educational level, 86.6% had finished high school or college. Waist circumference was high in 55.4%. Overall MS prevalence was 12.8%, 16.2% in males and 11.6% in females. Logistic regression analysis showed an independent association between MS and the following variables: elementary education, period of employment >10 years, office hours shift, and age group.
ConclusionA diagnosis of MS was affected by age, educational level, work shift, and prolonged period of employment. Hospital workers do not differ from other populations and also need stimuli to make preventive changes to their behavior to modify cardiovascular risk factors.
A síndrome metabólica (SM) é um importante problema de saúde, e tem consequências na economia de empresas. Assim, o ambiente de trabalho é um cenário importante para prevenção primária dos fatores de risco para as doenças cardiovasculares.
ObjetivoDeterminar a prevalência da SM e de variáveis relacionadas ao seu desenvolvimento em trabalhadores hospitalares.
MétodosEstudo transversal com 740 trabalhadores de um hospital universitário de grande porte. Foram avaliadas variáveis socioeconómicas, medidas antropométricas e de pressão arterial e exames laboratoriais. A SM foi caracterizada consoante os critérios da International Diabetes Federation.
ResultadosDos 740 trabalhadores 72,4% eram do sexo feminino, com idade média 34,9±9,5, sendo 27,8% do turno de trabalho da manhã, 20,3% do turno da tarde, 34,1% do turno integral e 17,8% do turno noturno. Com relação à escolaridade, 86,6% possuíam ensino médio a superior. A circunferência abdominal foi elevada em 55,4%. A prevalência total da SM foi de 12,8%, sendo 16,2% do sexo masculino e 11,6% do feminino. A regressão logística indicou associação independente da SM com as variáveis: ensino fundamental, tempo de trabalho >10 anos, turno de trabalho integral e faixa etária.
ConclusãoA SM diagnosticada foi afetada pela idade, nível educacional, turno de trabalho e avanço do tempo de trabalho. O trabalhador hospitalar não é diferente de outras populações e também necessita receber estímulos para tomar decisões preventivas que modifiquem seu comportamento para os fatores de risco cardiovasculares.
In recent decades modern society has undergone a complex and dynamic series of changes in eating habits and in demographic, socioeconomic and epidemiological patterns, which have led to significant alterations in the panorama of chronic diseases, particularly cardiovascular disease.1
Metabolic syndrome (MS) is the most common metabolic disorder in the modern world and is responsible for most cardiovascular events2 and a significant rise in cardiovascular mortality.3 The clinical importance of MS lies in identifying individuals at risk of cardiovascular disease and type 2 diabetes, enabling preventive lifestyle interventions.4 Obesity contributes to hypertension, high total cholesterol (TC), low high-density lipoprotein cholesterol (HDL-C) and hyperglycemia, which are associated with greater cardiovascular risk.5
The working population represents a large proportion of the general population. Most individuals in employment spend a large part of their day at the workplace. Enterprises are affected by the reduced productivity and increased costs caused by chronic diseases among their workforce and the resulting absenteeism due to illness. Obese workers suffer from physical work limitations, hypertension, type 2 diabetes, dyslipidemia and MS.6 The workplace is thus an important environment for screening of chronic diseases and provides the opportunity for prevention programs based on the availability of occupational medical services.
Hospitals are an ideal environment to collect and disseminate information on quality of life and cardiovascular risk factors. Hospital workers are influenced by their work environment and also have a role as educators.
There are few data on the prevalence of MS among hospital workers. The aim of this study was to determine the prevalence of MS in this population and to identify related variables.
MethodsStudy populationWe performed a cross-sectional study of 740 workers aged between 18 and 69 years in a large university hospital who were given an annual medical exam. All signed a form giving their informed consent for inclusion in the study, which was approved by the Research Ethics Committee of Santa Casa Hospital, Porto Alegre, Brazil. Of the 5336 workers at the institution, 920 (17.2%) underwent their annual medical exam during the study period, and 740 of these were included in the analysis. Workers were scheduled for the exam according to the month of their birth. Managerial staff and those aged under 18 were excluded (Figure 1).
Study protocol
Study participants attended an interview at which a questionnaire was completed assessing the following socioeconomic variables: skin color (white or nonwhite, self-declared), educational level (elementary, high school or college, completed or not), work shift (morning shift 6hours/day, afternoon shift 6hours/day, office hours 8hours/day, or night shift 12hours on alternate days), period of employment (≤1year, 1–3years, 3–5years, 5–10years, or >10years), and type of work (auxiliary, healthcare or administrative). Clinical and behavioral variables including hypertension, diabetes, dyslipidemia, heart disease, stroke, smoking, alcohol consumption and exercise were also recorded. Subjects were considered to be smokers if they were current smokers, irrespective of the number of cigarettes/day, ex-smokers if they had not smoked for at least 6 months, and non-smokers if they had never smoked. Individuals who drank any alcohol, irrespective of the amount, were considered positive for alcohol consumption. Those who took less than 30minutes of exercise twice a week were considered sedentary.
Laboratory assessmentLipid profile was assessed by measuring TC, HDL-C and triglycerides (TG) after a 12-hour fasting period. Low-density lipoprotein cholesterol (LDL-C) was calculated by the Friedewald formula7: LDL-C=(TC−HDL-C−TG)/5. TC, TG and blood glucose were measured by automated enzymatic methods and HDL-C was determined by direct enzymatic colorimetry using an automated Advia® 1650 analyzer (Siemens, Tokyo, Japan). Participants were instructed not to undertake any vigorous exercise or to ingest alcohol in the 24hours prior to blood sample collection.
Anthropometric and clinical assessmentBlood pressure was measured after 5–10minutes rest with a duly calibrated BD® sphygmomanometer with the subject seated and with the arm supported on a firm surface. A second reading was taken after 1–2 minutes and the mean of the two measurements was recorded.
Waist circumference was determined with the subject standing, breathing normally and without clothing in the abdominal region. The waist was measured midway between the costal margin and the iliac crest, using a 1.50-m flexible non-stretch tape measure with 0.5-cm divisions. Height was measured using an anthropometric scale with a maximum height of 2m and 0.5-cm divisions, and weight using a Filizola® mechanical anthropometric scale with a maximum capacity of 150kg and 100-g divisions. Weight was determined with the subject wearing light clothing and without shoes. Body mass index (BMI) was calculated as weight in kg divided by height in m2. Subjects were classified according to the World Health Organization criteria8 as normal weight (BMI<25kg/m2), overweight (25–29.9kg/m2) or obese (≥30kg/m2).
Diagnostic criteria for metabolic syndromeThe International Diabetes Federation (IDF) definition of the metabolic syndrome9 was used: waist circumference ≥94cm in men and ≥80cm in women, plus any two of raised TG (≥150mg/dl) or specific treatment for this lipid abnormality, reduced HDL-C (<40mg/dl in men and <50mg/dl in women or under lipid-lowering therapy, raised blood pressure (systolic ≥130mmHg and/or diastolic ≥85mmHg or treatment of previously diagnosed hypertension), or raised fasting plasma glucose (≥100mg/dl or antidiabetic medication).
Statistical analysisInternational reference studies were used to calculate the sample size. These showed an approximate prevalence of MS of 25% based on population studies in the USA10 and Mexico.11 With a 4% margin of error and a 95% confidence level, a minimum of 451 subjects were required to estimate the prevalence of MS and of variables related to its development. The calculation was performed using Programs for Epidemiologists (PEPI) version 4.0.
Quantitative variables were expressed as means and standard deviation and categorical variables as absolute and relative frequencies. Pearson's chi-square test was used to assess associations between categorical variables, complemented by adjusted residual analysis. The Student's t test was used to compare continuous variables.12
Logistic regression analysis was used to control for confounding factors and to assess factors that could be associated with the presence of MS. Variables with p-values <0.20 on univariate analysis were used in the multivariate model.13 Variables that are components of MS (BMI, TC, hypertension, dyslipidemia and TG) were excluded from the model, as were those predicted by MS (diabetes and stroke), due to their colinearity with other variables. The level of significance established was 5% (p≤0.05). The tests were performed using Statistical Package for the Social Sciences (SPSS) 17.0 for Windows.
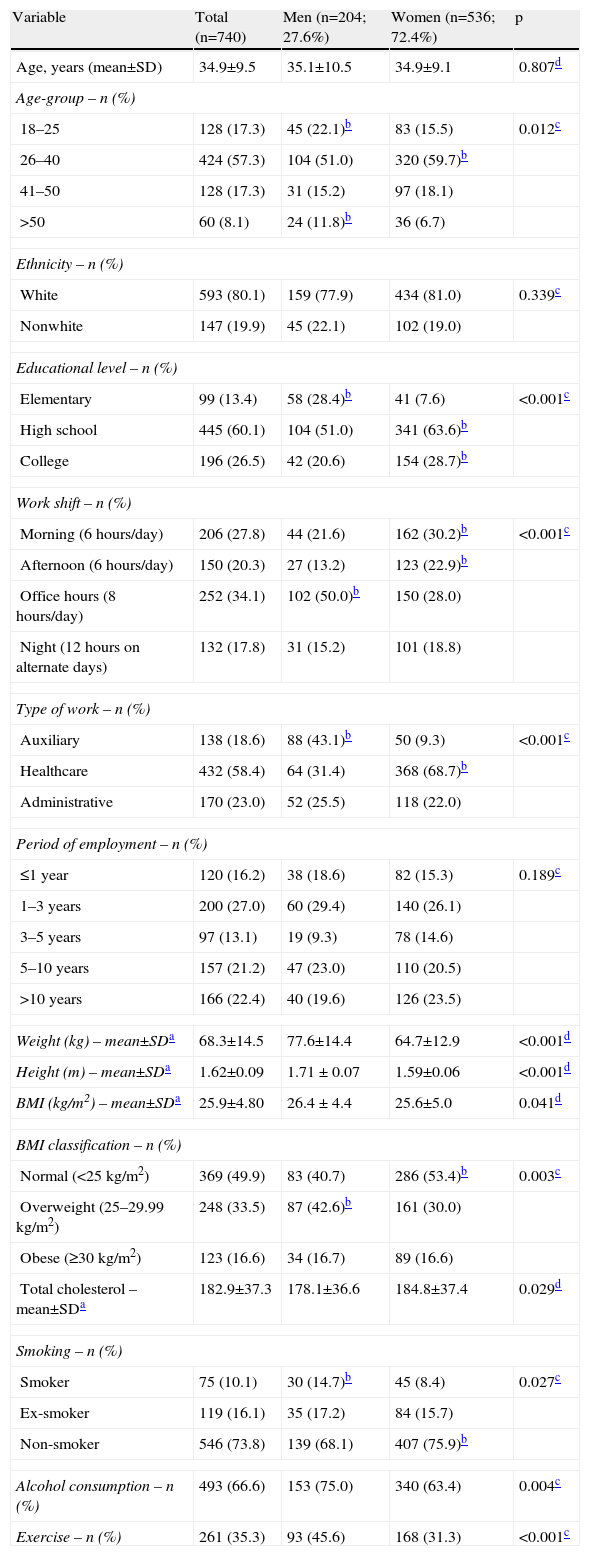
ResultsTable 1 shows the characteristics of the study population, consisting of 740 individuals, 72.4% female, mean age 34.9 years. Most were white (80.1%) and had finished high school or college (86.6%). In terms of work shift, 27.8% worked the morning shift, 20.3% the afternoon shift, 34.1% office hours, and 17.8% the night shift. Regarding type of work, most were classified as healthcare workers. As for period of employment, 16.2% had worked ≤1 year, 27% 1–3 years, 13.1% 3–5 years, 21.2% 5–10 years and 22.4% >10 years. On the basis of BMI, 50.1% of the sample were overweight. In terms of lifestyle habits, 66.6% reported consuming alcohol, only 10% smoked and 64.7% took no regular exercise.
Characteristics of the study population.
| Variable | Total (n=740) | Men (n=204; 27.6%) | Women (n=536; 72.4%) | p |
| Age, years (mean±SD) | 34.9±9.5 | 35.1±10.5 | 34.9±9.1 | 0.807d |
| Age-group – n (%) | ||||
| 18–25 | 128 (17.3) | 45 (22.1)b | 83 (15.5) | 0.012c |
| 26–40 | 424 (57.3) | 104 (51.0) | 320 (59.7)b | |
| 41–50 | 128 (17.3) | 31 (15.2) | 97 (18.1) | |
| >50 | 60 (8.1) | 24 (11.8)b | 36 (6.7) | |
| Ethnicity – n (%) | ||||
| White | 593 (80.1) | 159 (77.9) | 434 (81.0) | 0.339c |
| Nonwhite | 147 (19.9) | 45 (22.1) | 102 (19.0) | |
| Educational level – n (%) | ||||
| Elementary | 99 (13.4) | 58 (28.4)b | 41 (7.6) | <0.001c |
| High school | 445 (60.1) | 104 (51.0) | 341 (63.6)b | |
| College | 196 (26.5) | 42 (20.6) | 154 (28.7)b | |
| Work shift – n (%) | ||||
| Morning (6hours/day) | 206 (27.8) | 44 (21.6) | 162 (30.2)b | <0.001c |
| Afternoon (6hours/day) | 150 (20.3) | 27 (13.2) | 123 (22.9)b | |
| Office hours (8hours/day) | 252 (34.1) | 102 (50.0)b | 150 (28.0) | |
| Night (12hours on alternate days) | 132 (17.8) | 31 (15.2) | 101 (18.8) | |
| Type of work – n (%) | ||||
| Auxiliary | 138 (18.6) | 88 (43.1)b | 50 (9.3) | <0.001c |
| Healthcare | 432 (58.4) | 64 (31.4) | 368 (68.7)b | |
| Administrative | 170 (23.0) | 52 (25.5) | 118 (22.0) | |
| Period of employment – n (%) | ||||
| ≤1 year | 120 (16.2) | 38 (18.6) | 82 (15.3) | 0.189c |
| 1–3 years | 200 (27.0) | 60 (29.4) | 140 (26.1) | |
| 3–5 years | 97 (13.1) | 19 (9.3) | 78 (14.6) | |
| 5–10 years | 157 (21.2) | 47 (23.0) | 110 (20.5) | |
| >10 years | 166 (22.4) | 40 (19.6) | 126 (23.5) | |
| Weight (kg) – mean±SDa | 68.3±14.5 | 77.6±14.4 | 64.7±12.9 | <0.001d |
| Height (m) – mean±SDa | 1.62±0.09 | 1.71±0.07 | 1.59±0.06 | <0.001d |
| BMI (kg/m2) – mean±SDa | 25.9±4.80 | 26.4±4.4 | 25.6±5.0 | 0.041d |
| BMI classification – n (%) | ||||
| Normal (<25kg/m2) | 369 (49.9) | 83 (40.7) | 286 (53.4)b | 0.003c |
| Overweight (25–29.99kg/m2) | 248 (33.5) | 87 (42.6)b | 161 (30.0) | |
| Obese (≥30kg/m2) | 123 (16.6) | 34 (16.7) | 89 (16.6) | |
| Total cholesterol – mean±SDa | 182.9±37.3 | 178.1±36.6 | 184.8±37.4 | 0.029d |
| Smoking – n (%) | ||||
| Smoker | 75 (10.1) | 30 (14.7)b | 45 (8.4) | 0.027c |
| Ex-smoker | 119 (16.1) | 35 (17.2) | 84 (15.7) | |
| Non-smoker | 546 (73.8) | 139 (68.1) | 407 (75.9)b | |
| Alcohol consumption – n (%) | 493 (66.6) | 153 (75.0) | 340 (63.4) | 0.004c |
| Exercise – n (%) | 261 (35.3) | 93 (45.6) | 168 (31.3) | <0.001c |
BMI: body mass index; SD: standard deviation.
More men (50%) worked office hours than any other shift and more women (30.2%) worked the morning shift than any other shift. Regarding type of work, 43.1% of men were auxiliary workers and 68.7% of women were healthcare workers. In terms of BMI, 69.3% of men were overweight or obese and 53.4% of women were normal weight.
Figure 2 describes the components of MS by gender. The diagnosis of MS was confirmed in 95 individuals (12.8%), 16.2% of the men and 11.6% of the women (p=0.121). Waist circumference was high in slightly over half the population (55.4%), with a female predominance (63.1% vs. 35.3%; p<0.001). Low HDL-C was the second most common component (23.8%), and fasting plasma glucose was high in 5.4% of the population.

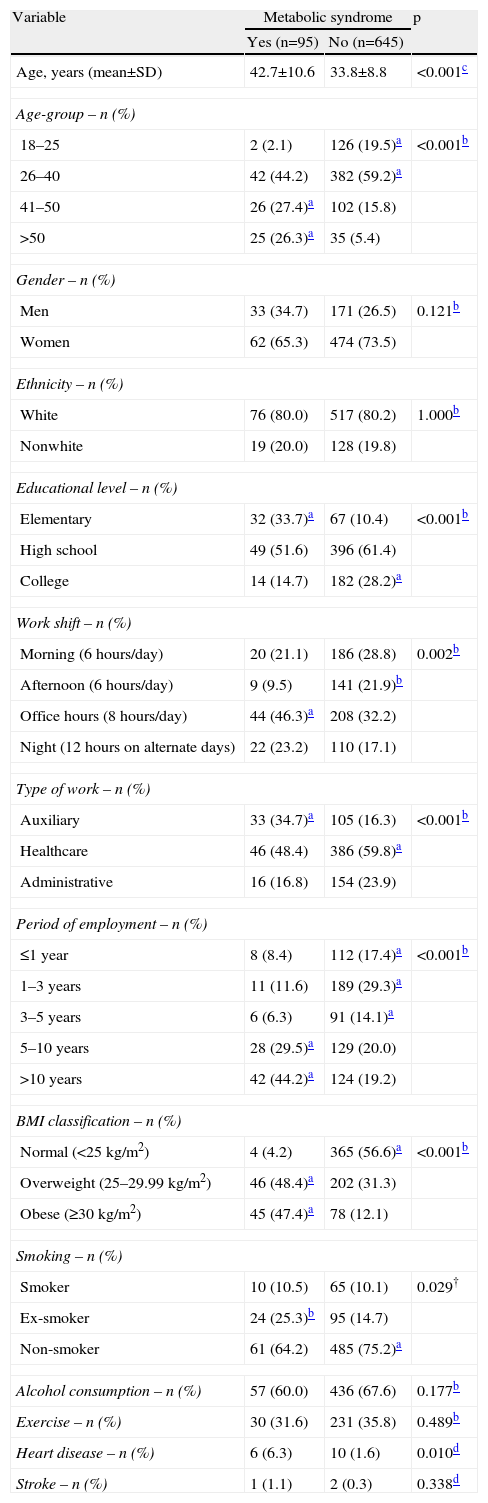
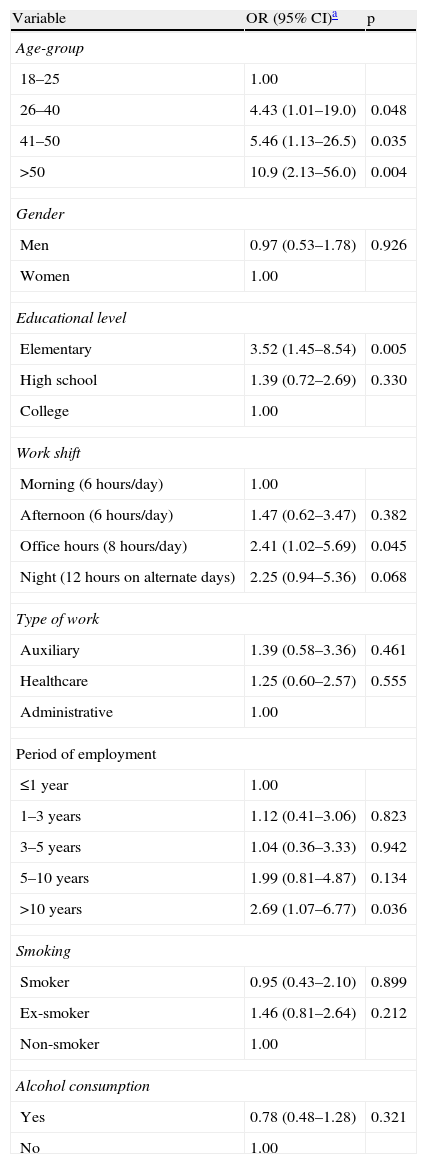
Table 2 shows the results of univariate analysis, which demonstrated a statistically significant association between MS and age (from age 41 onwards) and elementary educational level. The office hours shift was most strongly associated with MS and absence of MS most strongly with the afternoon shift. Other associations were with the auxiliary worker group, length of employment >5 years, overweight and ex-smokers. However, the factors that were independently associated with MS after controlling for confounding factors were age, elementary educational level, office hours work shift, and length of employment >10 years (Table 3). There was no association between MS and the auxiliary worker group (p=0.461). When analyzed as continuous variables, each year of age increased the probability of presenting MS by 5% (odds ratio [OR] 1.05; 95% confidence interval [CI] 1.01–2.08; p=0.006) and each year of employment increased it by 1% (OR=1.01; 95% CI 1.00–1.01; p=0.010).
Associations between metabolic syndrome and study variables in univariate analysis.
| Variable | Metabolic syndrome | p | |
| Yes (n=95) | No (n=645) | ||
| Age, years (mean±SD) | 42.7±10.6 | 33.8±8.8 | <0.001c |
| Age-group – n (%) | |||
| 18–25 | 2 (2.1) | 126 (19.5)a | <0.001b |
| 26–40 | 42 (44.2) | 382 (59.2)a | |
| 41–50 | 26 (27.4)a | 102 (15.8) | |
| >50 | 25 (26.3)a | 35 (5.4) | |
| Gender – n (%) | |||
| Men | 33 (34.7) | 171 (26.5) | 0.121b |
| Women | 62 (65.3) | 474 (73.5) | |
| Ethnicity – n (%) | |||
| White | 76 (80.0) | 517 (80.2) | 1.000b |
| Nonwhite | 19 (20.0) | 128 (19.8) | |
| Educational level – n (%) | |||
| Elementary | 32 (33.7)a | 67 (10.4) | <0.001b |
| High school | 49 (51.6) | 396 (61.4) | |
| College | 14 (14.7) | 182 (28.2)a | |
| Work shift – n (%) | |||
| Morning (6hours/day) | 20 (21.1) | 186 (28.8) | 0.002b |
| Afternoon (6hours/day) | 9 (9.5) | 141 (21.9)b | |
| Office hours (8hours/day) | 44 (46.3)a | 208 (32.2) | |
| Night (12hours on alternate days) | 22 (23.2) | 110 (17.1) | |
| Type of work – n (%) | |||
| Auxiliary | 33 (34.7)a | 105 (16.3) | <0.001b |
| Healthcare | 46 (48.4) | 386 (59.8)a | |
| Administrative | 16 (16.8) | 154 (23.9) | |
| Period of employment – n (%) | |||
| ≤1 year | 8 (8.4) | 112 (17.4)a | <0.001b |
| 1–3 years | 11 (11.6) | 189 (29.3)a | |
| 3–5 years | 6 (6.3) | 91 (14.1)a | |
| 5–10 years | 28 (29.5)a | 129 (20.0) | |
| >10 years | 42 (44.2)a | 124 (19.2) | |
| BMI classification – n (%) | |||
| Normal (<25kg/m2) | 4 (4.2) | 365 (56.6)a | <0.001b |
| Overweight (25–29.99kg/m2) | 46 (48.4)a | 202 (31.3) | |
| Obese (≥30kg/m2) | 45 (47.4)a | 78 (12.1) | |
| Smoking – n (%) | |||
| Smoker | 10 (10.5) | 65 (10.1) | 0.029† |
| Ex-smoker | 24 (25.3)b | 95 (14.7) | |
| Non-smoker | 61 (64.2) | 485 (75.2)a | |
| Alcohol consumption – n (%) | 57 (60.0) | 436 (67.6) | 0.177b |
| Exercise – n (%) | 30 (31.6) | 231 (35.8) | 0.489b |
| Heart disease – n (%) | 6 (6.3) | 10 (1.6) | 0.010d |
| Stroke – n (%) | 1 (1.1) | 2 (0.3) | 0.338d |
BMI: body mass index; SD: standard deviation.
Multivariate logistic regression analysis of factors associated with metabolic syndrome.
| Variable | OR (95% CI)a | p |
| Age-group | ||
| 18–25 | 1.00 | |
| 26–40 | 4.43 (1.01–19.0) | 0.048 |
| 41–50 | 5.46 (1.13–26.5) | 0.035 |
| >50 | 10.9 (2.13–56.0) | 0.004 |
| Gender | ||
| Men | 0.97 (0.53–1.78) | 0.926 |
| Women | 1.00 | |
| Educational level | ||
| Elementary | 3.52 (1.45–8.54) | 0.005 |
| High school | 1.39 (0.72–2.69) | 0.330 |
| College | 1.00 | |
| Work shift | ||
| Morning (6hours/day) | 1.00 | |
| Afternoon (6hours/day) | 1.47 (0.62–3.47) | 0.382 |
| Office hours (8hours/day) | 2.41 (1.02–5.69) | 0.045 |
| Night (12hours on alternate days) | 2.25 (0.94–5.36) | 0.068 |
| Type of work | ||
| Auxiliary | 1.39 (0.58–3.36) | 0.461 |
| Healthcare | 1.25 (0.60–2.57) | 0.555 |
| Administrative | 1.00 | |
| Period of employment | ||
| ≤1 year | 1.00 | |
| 1–3 years | 1.12 (0.41–3.06) | 0.823 |
| 3–5 years | 1.04 (0.36–3.33) | 0.942 |
| 5–10 years | 1.99 (0.81–4.87) | 0.134 |
| >10 years | 2.69 (1.07–6.77) | 0.036 |
| Smoking | ||
| Smoker | 0.95 (0.43–2.10) | 0.899 |
| Ex-smoker | 1.46 (0.81–2.64) | 0.212 |
| Non-smoker | 1.00 | |
| Alcohol consumption | ||
| Yes | 0.78 (0.48–1.28) | 0.321 |
| No | 1.00 | |
CI: confidence interval; OR: odds ratio.
In this study, the prevalence of MS in hospital workers was 12.8%. After adjusted analysis of risk factors, age, elementary educational level, office hours work shift and length of employment were statistically associated with MS.
Using the IDF definition of MS, the prevalence of MS in the overall population was 12.8%, with no significant difference between the sexes (16.2% in men and 11.6% in women). A study in the USA14 of 3601 individuals aged between 20 and 70 found a prevalence of 34.5% (33.7% in men and 35.4% in women), using the National Cholesterol Education Program Adult Treatment Panel III (NCEP-ATP III) definition and 39% with the IDF definition (39.9% in men and 38.1% in women). In Portugal15, a study of 16 856 individuals showed a prevalence of 27.5% (28.7% in women and 26.0% in men) using the NCEP-ATP III criteria.
A study of healthcare workers in Turkey16 revealed a prevalence of 5.2% in women and 12.7% in men using the NCEP-ATP III definition. In a study of workers in a university hospital in the Brazilian city of Florianopolis17, the prevalence of MS using the IDF definition was 21.9% in women and 19.4% in men, while in 7256 workers aged between 20 and 60 at an automobile plant in Spain18 it was 10.2% (8.7% in men and 3% in women) on the NCEP-ATP III criteria. A 2008 study of 992 railway employees aged 30–60 in India found a prevalence of MS by the NCEP-ATP III criteria of 27.03% (27.3% in women and 26.7% in men), and in a German study20 of workers in a chemical company, using the IDF definition, MS was present in 23.5% of workers, with a higher proportion of men (30% vs. 9.7%). There is thus considerable variation in the literature concerning MS prevalence in the workforce, probably due to differences in the populations studied and in the definition of MS used.
In our study population, age and length of employment >10 years were significantly associated with greater risk for MS. Prevalence was 27.4% in the 41–50 age-group and 26.3% in those aged over 50. Among US adults the prevalence was 23.7% in the 20–69 age-group and 6.7% in the 20–29 age-group, increasing progressively up to 43.5% in the 60–69 age-group10. A population study in the Brazilian city of Vitoria21 showed increasing MS prevalence with age, with a prevalence of 48.3% in those aged 55–64. In the above-cited study in Florianopolis17, the prevalence was 67.5% in the 40–49 age-group, while in the Indian railway employees19 MS was strongly associated with age over 45. In a study of municipal workers in Izmir, Turkey22, there was a significant association between MS and over 10 years’ employment (p=0.009). Increasing age and length of employment, together with the more modern lifestyles of these populations, lead to changes in eating habits and greater access to labor-saving goods and hence reductions in the physical effort required to perform tasks at home and at work; the result is energy imbalances and weight gain.
In this study a lower educational level (elementary education only) was significantly associated with MS. A study of professional and office workers in Bangkok, Thailand23, showed a higher MS prevalence in those with only a high-school educational level. A higher educational level, giving better access to information including newspapers and magazines and educational programs, can influence eating habits and improve lifestyle choices.
In the present study a significant association was found between MS and office hours work shift, and a greater tendency for MS in those working the night shift. A study in a factory in Buenos Aires24 analyzed MS prevalence in those working the day shift (8hours/day) and those on a rotating work shift (2 days of night shift followed by 3 days’ rest). MS was more common in those on the rotating shift (17.2% vs. 10.7%; p<0.005). In a prospective study of 1529 workers in Belgian companies24, MS was more prevalent in those working rotating shifts than in those on day shifts (32.7% vs. 21.6%); those who spend more of their day at work tend to consume high energy but nutritionally poor foods, and longer working hours often imply greater sedentarism.
Study limitationThis was a cross-sectional study, i.e. one in which causal relations are established without demonstrating that there is a temporal connection between exposure to a risk factor and development of a disease. When their indications, advantages and limitations are borne in mind, such studies can make valuable contributions to advances in scientific knowledge.
ConclusionWe found that a diagnosis of MS in hospital workers was affected by age, educational level, work shift, and prolonged period of employment. Hospital workers need stimuli to make preventive changes to their behavior to modify cardiovascular risk factors.
Please cite this article as: Basei Rossa, CE; Síndrome metabólica em trabalhadores de um hospital universitário, Rev Port Cardiol. 2012. doi:10.1016/j.repc.2012.07.002.
