


There is disagreement regarding the best method for assessing renal dysfunction in patients with myocardial infarction (MI). This study aims to compare two commonly used formulas for measuring glomerular filtration rate (GFR) (Cockcroft–Gault [CG] and Modification of Diet in Renal Disease [MDRD]) in terms of predicting extent of coronary artery disease (CAD) and short- and long-term cardiovascular risk.
MethodsWe studied 452 patients admitted to a cardiac intensive care unit (ICU) with MI (age 69.01±13.64 years; 61.7% male, 38.5% diabetic) and followed for two years. CG and MDRD GFR estimates were compared in terms of prediction of CAD extent, in-hospital mortality risk and cardiovascular risk during follow-up.
ResultsGFR <60ml/min/1.73m2 using the MDRD formula was associated with a tendency for more extensive CAD (2.70 affected segments vs. 2.20, p=0.052) and higher two-year mortality risk (p<0.001, OR 3.84, 95% CI 2.04–7.22) and risk for reinfarction (p<0.001, OR 4.09, 95% CI 2.00–8.39), decompensated heart failure (DHF) (p<0.001, OR 3.95, 95% CI 2.04–7.66) and combined cardiovascular endpoints (p=0.001, OR 2.47, 95% CI 1.47–4.17). Using the CG formula, GFR <60ml/min/1.73m2 only predicted higher risk for DHF (p=0.016, OR 4.5, 95% CI 1.11–16.57), despite a tendency for more overall combined cardiovascular endpoints (p=0.09, OR 2.84). Both formulas predicted in-hospital mortality.
Discussion/ConclusionsThis study confirmed the value of GFR in predicting various cardiovascular endpoints in patients with MI. Compared to the CG formula, the MDRD formula was significantly more accurate in predicting the severity of CAD and two-year CV risk in patients admitted to the ICU with MI.
A escolha do melhor método para avaliação da função renal em doentes com enfarte agudo do miocárdio não é ainda consensual. Este estudo visa comparar duas fórmulas habitualmente usadas para avaliação da taxa de filtração glomerular (TFG) [Cockcroft-Gault (CG) e MDRD] em termos de predição de extensão da doença coronária (DC) e risco cardiovascular (CV) global.
População e Métodos452 doentes admitidos numa Unidade de Cuidados Intensivos Cardíacos (idade 69,01±13,64, 61.7% do sexo masculino, 38.5% diabéticos) foram incluídos e seguidos por dois anos após alta. A TFG foi calculada usando as fórmulas CG e MDRD e estas foram comparados em termos de predição da extensão da DC, risco de mortalidade intra-hospitalar (MIH) e risco CV durante o follow-up.
ResultadosTFG<60mL/min/1,73m2 pela fórmula MDRD associou-se a DC marginalmente mais extensa (2.70 segmentos afectados vs. 2.20, p=0.052) e maior risco de: mortalidade aos dois anos (p<0.001, OR 3.84, CI95% 2.04-7.22); re-enfarte (p<0.001, OR 4.09, CI95% 2.00-8.39); insuficiência cardíaca descompensada (ICd) [p<0.001, OR 3.95, CI95% 2.04-7.66]; eventos cardiovasculares combinados (p=0.001, OR 2.47, CI95% 1.47-4.17). TFG<60mL/min/1,73m2 pela fórmula de CG previu apenas maior risco de ICd (p=0.016, OR 4.5, CI95% 1.11-16.57) e uma tendência para maior número de endpoints cardiovasculares (p=0.09, OR 2.84). Ambas as fórmulas previram o risco de MIH.
Discussão/ConclusõesEste estudo confirmou o valor da TFG na predição de múltiplos endpoints CV em doentes com EAM. A fórmula MDRD foi significativamente mais útil na predição da gravidade da DC e do risco CV.
Chronic renal disease is linked to greater risk of cardiovascular disease and mortality1 and is often associated with more extensive atherosclerotic disease.2 However, patients with renal failure less often receive aggressive treatment to reduce cardiovascular morbidity and mortality.3
Renal function, as estimated by glomerular filtration rate (GFR), is a prognostic factor in patients admitted to a cardiac intensive care unit (ICU) with a diagnosis of myocardial infarction (MI) and predicts in-hospital mortality.4 Even mild renal failure (RF) is considered a major risk factor for post-MI complications.5
The Cockcroft–Gault and Modification of Diet in Renal Disease (MDRD) formulas are both used to assess renal function in patients with heart failure (HF) or MI, and provide a more accurate measure than serum creatinine.6,7 However, it is not clear as to which formula better predicts short- and long-term mortality and other cardiovascular endpoints.
The aim of this study is to compare the prognostic value of the MDRD and Cockcroft–Gault formulas in patients with MI, particularly their ability to predict in-hospital and two-year mortality (primary endpoint), and to predict readmission for decompensated HF, reinfarction, recurrent angina and ischemic stroke during two-year follow-up (secondary endpoints).
MethodsWe prospectively studied 452 consecutive patients admitted to a cardiac intensive care unit (ICU) over a period of 16 months (November 1, 2006 to February 28, 2008) with a diagnosis of MI (based on the revised World Health Organization criteria).8
The following data were collected for each patient:
- -
Number of vessels and segments with significant lesions on coronary angiography in the 362 patients who underwent catheterization. The reasons for not performing catheterization in the other 90 patients were (1) advanced age and multiple comorbidities, particularly renal failure, that significantly increased the risks of invasive stratification (n=53); death before catheterization could be performed (n=18); and (3) the existence of severe coronary artery disease (CAD) considered to be untreatable (n=19);
- -
Data on revascularization procedures (of the 362 patients who underwent catheterization, 274 were revascularized, 258 by percutaneous coronary intervention (PCI) and 16 by coronary artery bypass grafting (CABG);
- -
Laboratory test results on admission (blood glucose, creatinine, hemoglobin and C-reactive protein);
- -
Peak troponin I;
- -
Physical examination on admission and Killip class.
Each patient's GFR was calculated using the MDRD formula: GFR (ml/min/1.73m2)=186×(serum creatinine)−0.154×(age)−0.203×(0.742 if female)×(1.21 if black); and the Cockcroft–Gault formula: GFR (ml/min/1.73m2)=(140−age)×(weight)×(0.85 if female)/(72×serum creatinine).
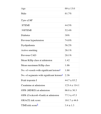
The patients’ GRACE score was also recorded, as well as TIMI score in those with non-ST segment elevation MI (NSTEMI) for better characterization of this subgroup (Table 1).
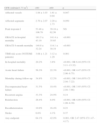
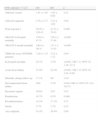
Characteristics of the study population.
| Age | 69±13.6 |
| Male | 61.7% |
| Type of MI | |
| STEMI | 44.5% |
| NSTEMI | 52.4% |
| Diabetes | 38% |
| Previous hypertension | 74.8% |
| Dyslipidemia | 56.2% |
| Active smoking | 26.1% |
| Previous CAD | 28.1% |
| Mean Killip class at admission | 1.42 |
| Mean maximum Killip class | 1.66 |
| No. of vessels with significant lesionsa | 1.68 |
| No. of segments with significant lesionsa | 2.36 |
| Peak troponin I | 44.7±83.2 |
| Creatinine at admission | 123.4±114.1 |
| GFR (MDRD) at admission | 66.8±30.3 |
| GFR (Cockcroft–Gault) at admission | 77.3±47.5 |
| GRACE risk score | 161.7±44.6 |
| TIMI risk scoreb | 3.4±1.3 |
The follow-up period was 24 months, by telephone contact every three months, and the following events were recorded: all-cause death (primary endpoint), reinfarction, recurrent angina (defined as recurrence of chest pain similar to that experienced at the time of MI, or new episode classified as atypical or typical angina); readmission for decompensated HF requiring hospitalization for >48hours; and ischemic stroke (confirmed by cranial CT).
The two formulas were compared in terms of prognostic impact in these patients, particularly their ability to predict the primary endpoint – in-hospital and two-year mortality – and the secondary endpoints defined above, in a two-year follow-up. The possible advantages of each formula in assessing the extent and severity of CAD were also briefly analyzed.
The patients were divided into two groups: GFR <60ml/min/1.73m2 vs. ≥60ml/min/1.73m2.
Statistical analysisThe statistical analysis was performed using SPSS version 16.0. Nominal variables were compared with the chi-square test, continuous variables with the Student's t test, and non-parametric tests were used when appropriate. Univariate analysis with the chi-square test was used to assess correlations between GFR <60ml/min/1.73m2 and the defined cardiovascular endpoints, with relative risk and 95% confidence interval (CI). Multivariate logistic regression analysis was used to evaluate whether GFR as estimated by the MDRD and Cockcroft–Gault formulas should be included in risk prediction models. Results with p<0.05 were considered significant. Kaplan–Meier curves were constructed to assess survival according to GFR (cut-off 60ml/min/1.73m2) and ROC curves were built to compare the prognostic value of the two formulas.
ResultsA total of 48 in-hospital deaths were recorded (10.6% of the study population). Their mean age was 77.2±9.9 years and 52.9% were female. Mean Killip class at admission was 2.1±1.1, peak troponin I 68.5±131.4ng/ml, mean GRACE risk score 210.5±36.6 (TIMI risk score 3.9±0.9 in those with NSTEMI), and GFR 43.3±19.3ml/min/1.73m2 by the MDRD formula and 52.5±30.3ml/min/1.73m2 by the Cockcroft–Gault formula.
During follow-up there were 80 deaths (19.8% of those discharged after MI), with a mean survival of 10.2±7.2 months. Most were male (55.8%); mean age was 77.4±10 years, GRACE risk score 180.4±34.8 (TIMI risk score 3.97±1.14 in those with NSTEMI), and GFR 50.14±28.5ml/min/1.73m2 by the MDRD formula and 57.17±25.28ml/min/1.73m2 by the Cockcroft–Gault formula.
Excluding the patients who died in hospital or during follow-up, mean follow-up was 23.8 months. The full 24 months of follow-up was achieved in 313 patients; mean follow-up in the other 10 was 17 months.
Recurrent angina was recorded in 113 patients (29.7%) and 57 (14.2%) were admitted for reinfarction. Fifty-seven patients (14.2%) were recatheterized during follow-up, 70 (17.4%) were admitted for decompensated HF and 20 (4.9%) were diagnosed with stroke. There were 397 cardiovascular or cerebrovascular events during follow-up, in 200 patients (49.6% of the 404 discharged after MI).
MDRD formulaGFR calculated by the MDRD formula was used to classify the patients by stage of renal disease:
- -
Stage 2 (60–89ml/min/1.73m2): n=165 (36.5%);
- -
Stage 3 (30–59ml/min/1.73m2): n=125 (27.7%);
- -
Stage 4 (15–29ml/min/1.73m2): n=36 (8.2%);
- -
Stage 5 (<15ml/min/1.73m2): n=19 (4.2%);
- -
All others: n=107 (23.4%).
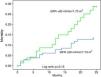
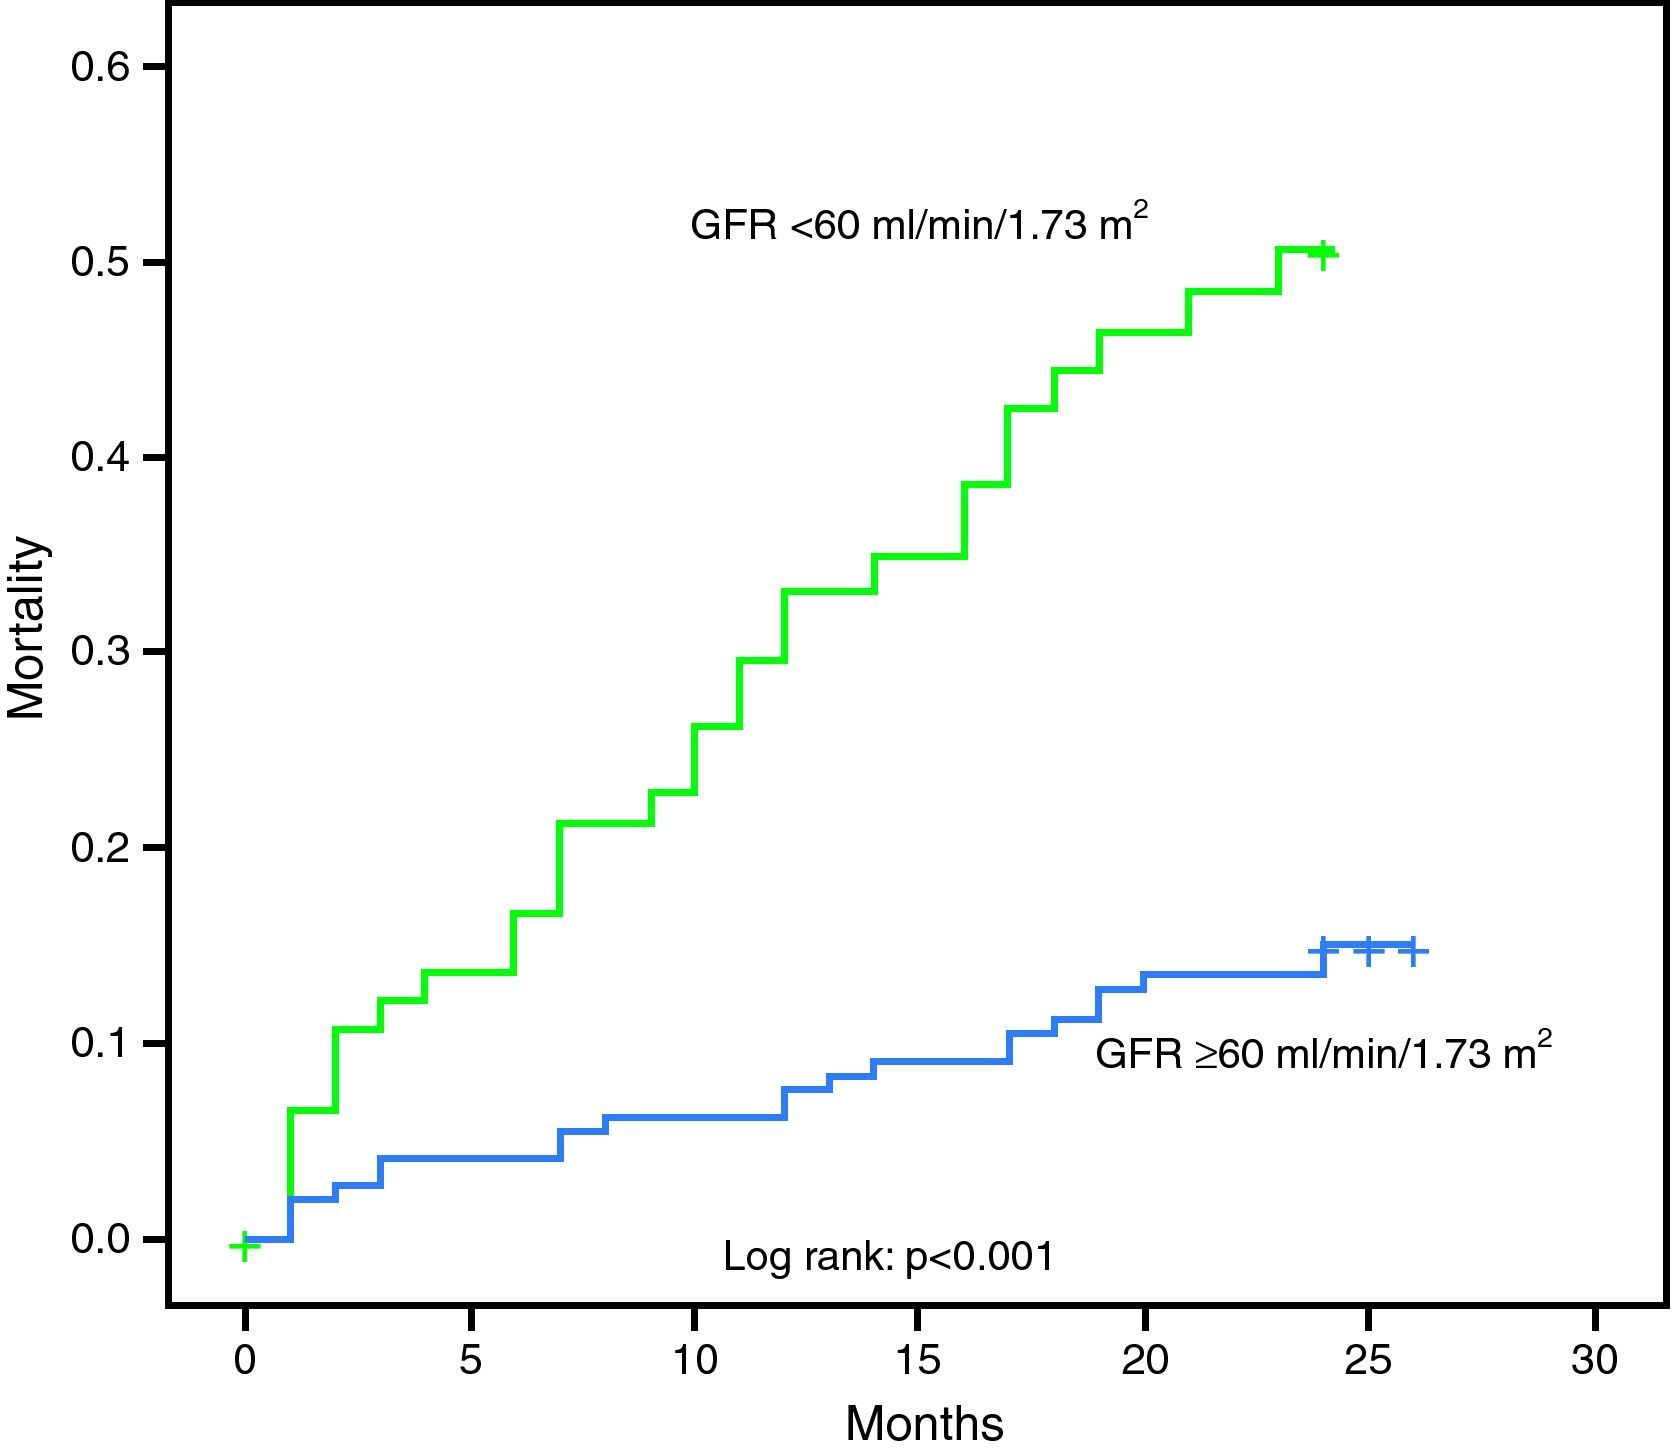
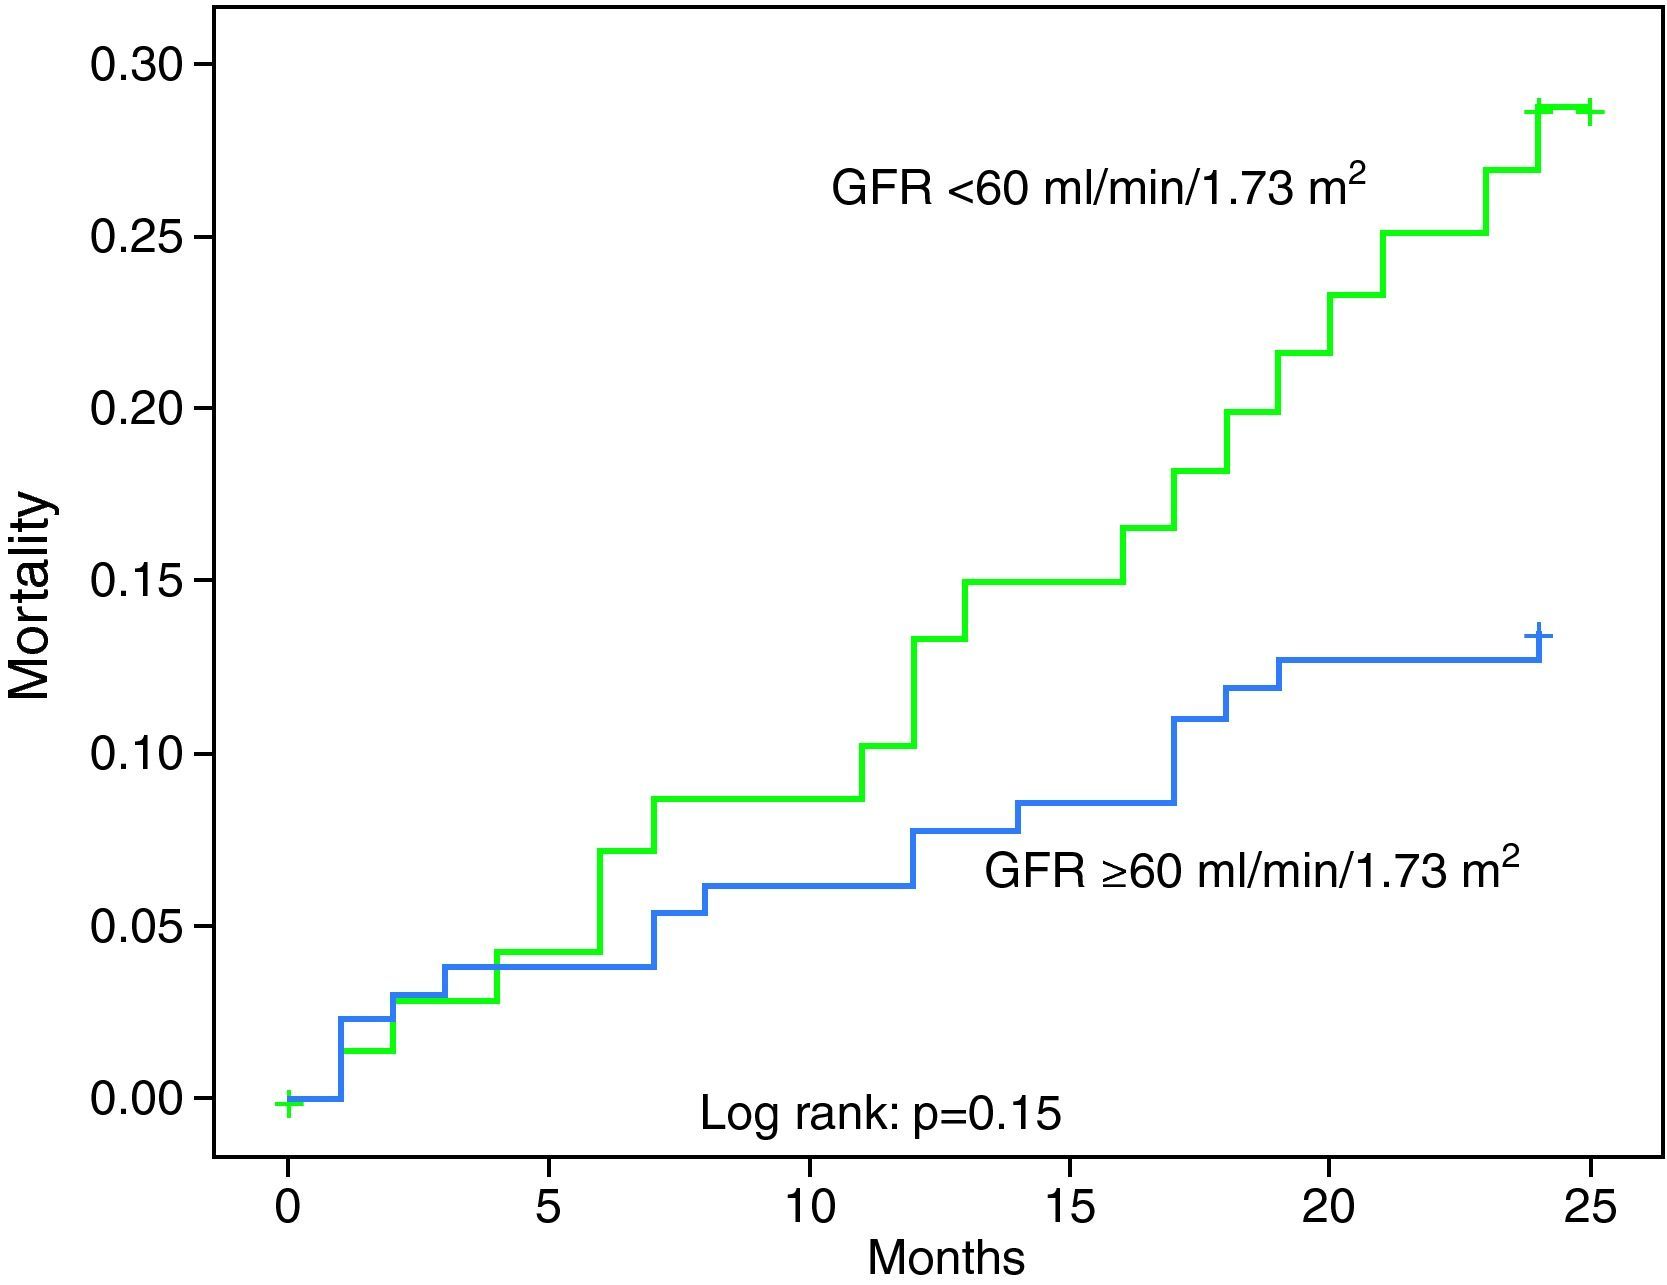
The 48 patients who died in hospital had lower GFR than the other 404 (43.3±19.3 vs. 69.5±30.2ml/min/1.73m2, p<0.001). There was a negative correlation between GFR by the MDRD formula and GRACE risk score (p<0.001, r=−0.526) and GFR <60ml/min/1.73m2 was associated with more extensive CAD (1.84 affected vessels vs. 1.61, p=0.047; 2.70 affected segments vs. 2.20, p=0.050) and higher risk for in-hospital death (20.2% vs. 3.8%, p<0.001, odds ratio [OR] 6.44, 95% CI 3.11–13.32); acute HF (maximum Killip class greater than at admission, or Killip at admission >1 in patients with no history of HF) (56.3% vs. 22.3%, p<0.001, OR 4.47, 95% CI 2.96–6.75); death during follow-up (34.8% vs. 12.2%, p<0.001, OR 3.84, 95% CI 2.04–7.22); reinfarction (26.4% vs. 8.0%, p<0.001, OR 4.09, 95% CI 1.99–8.39); readmission for decompensated HF (31.5% vs. 10.4%, p<0.001, OR 3.95, 95% CI 2.04–7.66), or any cardiovascular or cerebrovascular event (64.1% vs. 42%, p=0.001, OR 2.47, 95% CI 1.47–4.17). Considering only patients who died during follow-up, GFR <60ml/min/1.73m2 was associated with shorter survival (16.3 vs.19.5 months, p=0.001).
The multivariate analysis model to predict in-hospital mortality (Hosmer–Lemeshow test: 1.0; Nagelkerke R2: 0.606) including values calculated by both formulas (continuous variables) and all predictors of in-hospital mortality previously identified by univariate analysis included acute HF on admission (p=0.022, OR 3.12, 95% CI 1.80–9.06), GRACE risk score for in-hospital mortality (p=0.014, OR 1.024, 95% CI 1.004–1.044), GFR by the MDRD formula (p=0.048, OR=0.970, 95% CI 0.94–0.98) and revascularization (p=0.018, OR 3.34, 95% CI 2.01–9.87).
Age, cardiovascular risk factors, extent of myocardial necrosis and CAD, admission hemoglobin, GFR calculated by the Cockcroft–Gault formula and heart rate at admission were not included in the model. Subjects with missing values were excluded from the analysis.
Multivariate analysis including GFR calculated by both formulas and other variables with prognostic value at two years in univariate analysis was used to construct a model to predict mortality during follow-up (Hosmer–Lemeshow test: 0.612; Nagelkerke R2: 0.412) which included GFR calculated by the MDRD formula (continuous variable) (p<0.001, OR 0.976, 95% CI 0.962–0.989) and GRACE risk score for in-hospital mortality (p=0.006, OR 1.013, 95% CI 1.004–1.023). The other variables included in the analysis (conventional cardiovascular risk factors, acute HF at admission, extent of CAD and history of CAD, GFR by the Cockcroft–Gault formula, peak troponin I, admission hemoglobin and age) did not add predictive value to the model.
Table 2 and the Kaplan–Meier curve in Figure 1 show the prognostic value of GFR by the MDRD formula in patients with MI.
Prognostic value of glomerular filtration rate calculated by the MDRD formula.
| GFR (ml/min/1.73m2) | <60 | ≥60 | p |
| Affected vessels | 1.84±1.03 | 1.61±0.94 | 0.047 |
| Affected segments | 2.70±2.07 | 2.20±1.73 | 0.050 |
| Peak troponin I | 53.46±106.78 | 39.18±62.56 | NS |
| GRACE in-hospital mortality | 181.5±43.19 | 141.4±35.65 | <0.001 |
| GRACE 6-month mortality | 149.8±32.24 | 114.1±30.19 | <0.001 |
| TIMI risk score (NSTEMI patients) | 3.68±1.21 | 3.12±1.29 | 0.001 |
| In-hospital mortality | 20.2% | 3.8% | <0.001, OR 6.44 (95% CI 3.11–13.32) |
| Acute heart failure | 56.3% | 22.3% | <0.001, OR 4.47 (95% CI 2.96–6.75) |
| Mortality during follow-up | 34.8% | 12.2% | <0.001, OR 3.84 (95% CI 2.04–7.22) |
| Decompensated heart failure | 31.5% | 10.4% | <0.001, OR 3.95 (95% CI 2.04–7.66) |
| Recurrent angina | 33.3% | 24.9% | 0.14 |
| Reinfarction | 26.4% | 8.0% | <0.001, OR 4.09 (95% CI 1.99–8.39) |
| Recatheterization | 10.9% | 16.4% | 0.23 |
| Stroke | 6.6% | 4.1% | 0.37 |
| Any endpoint | 64.1% | 42.0% | 0.001, OR 2.47 (95% CI 1.47–4.17) |
CI: confidence interval; GFR: glomerular filtration rate; GRACE: GRACE risk score; NSTEMI: non-ST segment elevation myocardial infarction; OR: odds ratio.
The distribution of events during follow-up (404 patients) according to stage of renal disease as assessed by the MDRD formula is presented in Table 3.
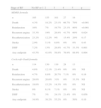
Distribution of endpoints according to stage of renal disease as assessed by the MDRD and Cockcroft–Gault formulas.
| Stage of RF | No RF or 1 | 2 | 3 | 4 | 5 | p |
| MDRD formula | ||||||
| n | 105 | 155 | 101 | 27 | 16 | |
| Death | 4.3% | 18.2% | 23.1% | 66.7% | 70% | <0.001 |
| Reinfarction | 10% | 7% | 19.7% | 23.1% | 80% | <0.001 |
| Recurrent angina | 33.3% | 19% | 28.8% | 41.7% | 60% | 0.024 |
| Recatheterization | 23.2% | 12.2% | 9% | 15.4% | 20% | 0.17 |
| Stroke | 2.9% | 5.1% | 8.8% | 0% | 0% | 0.43 |
| DHF | 7.2% | 13% | 28.8% | 41.7% | 33.3% | 0.001 |
| Any endpoint | 43.5% | 41.6% | 58.8% | 76.9% | 88.9% | 0.004 |
| Cockcroft–Gault formula | ||||||
| n | 114 | 130 | 119 | 28 | 13 | |
| Death | 4.8% | 12.1% | 21.4% | 0% | 0% | NS |
| Reinfarction | 4.7% | 8.8% | 20.7% | 7.1% | 0% | 0.16 |
| Recurrent angina | 28.6% | 20.6% | 31% | 0% | 33.3% | NS |
| Recatheterization | 18.6% | 15.2% | 14.3% | 0% | 0% | NS |
| Stroke | 0% | 6.1% | 7.1% | 0% | 0% | NS |
| DHF | 7% | 3% | 24.1% | 21.4% | 0% | 0.056 |
| Any endpoint | 34.9% | 38.2% | 55.2% | 0% | 50% | 0.10 |
DHF: decompensated heart failure; RF: renal failure.
The Cockcroft–Gault formula was also used to classify the patients by stage of renal disease: 13 (2.9%) had stage 5 RF, 28 (6.3%) had stage 4, 119 (26.4%) had stage 3 and 130 (28.7%) were in stage 2 (the other 162 [35.7%] did not have renal disease).
The 48 patients who died in hospital had lower GFR on admission (50.1±28.5 vs. 77.9±48.1ml/min/1.73m2, p=0.001), as with the MDRD formula. GFR <60ml/min/1.73m2 was not associated with more extensive CAD or myocardial necrosis, but these patients had higher GRACE risk scores for both in-hospital (178.6 vs.139.2, p<0.001) and 6-month mortality (146.4 vs.111.1, p<0.001). They also had higher in-hospital mortality (20.3% vs. 3.4%, p<0.001, OR 7.11, 95% CI 2.28–22.2) and readmission for decompensated HF (20% vs. 5.3%, p=0.016, OR 4.5, 95% CI 1.22–16.57).
Survival during follow-up according to GFR estimated by the Cockcroft–Gault formula is presented in Figure 2, while Table 4 shows its predictive power. The distribution of events during follow-up (404 patients) according to stage of renal disease as assessed by the Cockcroft–Gault formula is presented in Table 3.
Prognostic value of glomerular filtration rate calculated by the Cockcroft–Gault formula.
| GFR (ml/min/1.73m2) | <60 | ≥60 | p |
| Affected vessels | 1.81±1.05 | 1.63±0.89 | 0.21 |
| Affected segments | 2.54±2.17 | 2.22±1.69 | 0.64 |
| Peak troponin I | 59.95±138.42 | 43.47±70.43 | 0.096 |
| GRACE in-hospital mortality | 178.6±47.51 | 139.2±37.84 | <0.001 |
| GRACE 6-month mortality | 146.4±36.31 | 111.1±31.82 | <0.001 |
| TIMI risk score (NSTEMI patients) | 3.29±1.33 | 3.22±1.32 | 0.94 |
| In-hospital mortality | 20.3% | 3.4% | <0.001, OR 7.11 (95% CI 2.28–22.2) |
| Acute heart failure | 51.9% | 22.4% | <0.001, OR 3.73 (95% CI 2.01–6.95) |
| Mortality during follow-up | 17.1% | 8% | 0.19 |
| Decompensated heart failure | 20% | 5.3% | 0.016, OR 4.5 (95% CI 1.22–16.57) |
| Recurrent angina | 30.6% | 25% | 0.53 |
| Reinfarction | 16.7% | 6.5% | 0.089 |
| Recatheterization | 14.3% | 17.1% | 0.71 |
| Stroke | 5.7% | 2.7% | 0.43 |
| Any endpoint | 51.4% | 36.4% | 0.09 |
CI: confidence interval; GFR: glomerular filtration rate; GRACE: GRACE risk score; NSTEMI: non-ST segment elevation myocardial infarction; OR: odds ratio.
GFR assessed by this formula was not included in models predicting in-hospital or two-year mortality by multivariate logistic regression analysis, unlike the MDRD formula. This was unchanged even after removing GFR calculated by the MDRD formula from the variables tested.
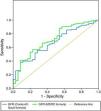
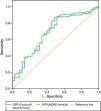
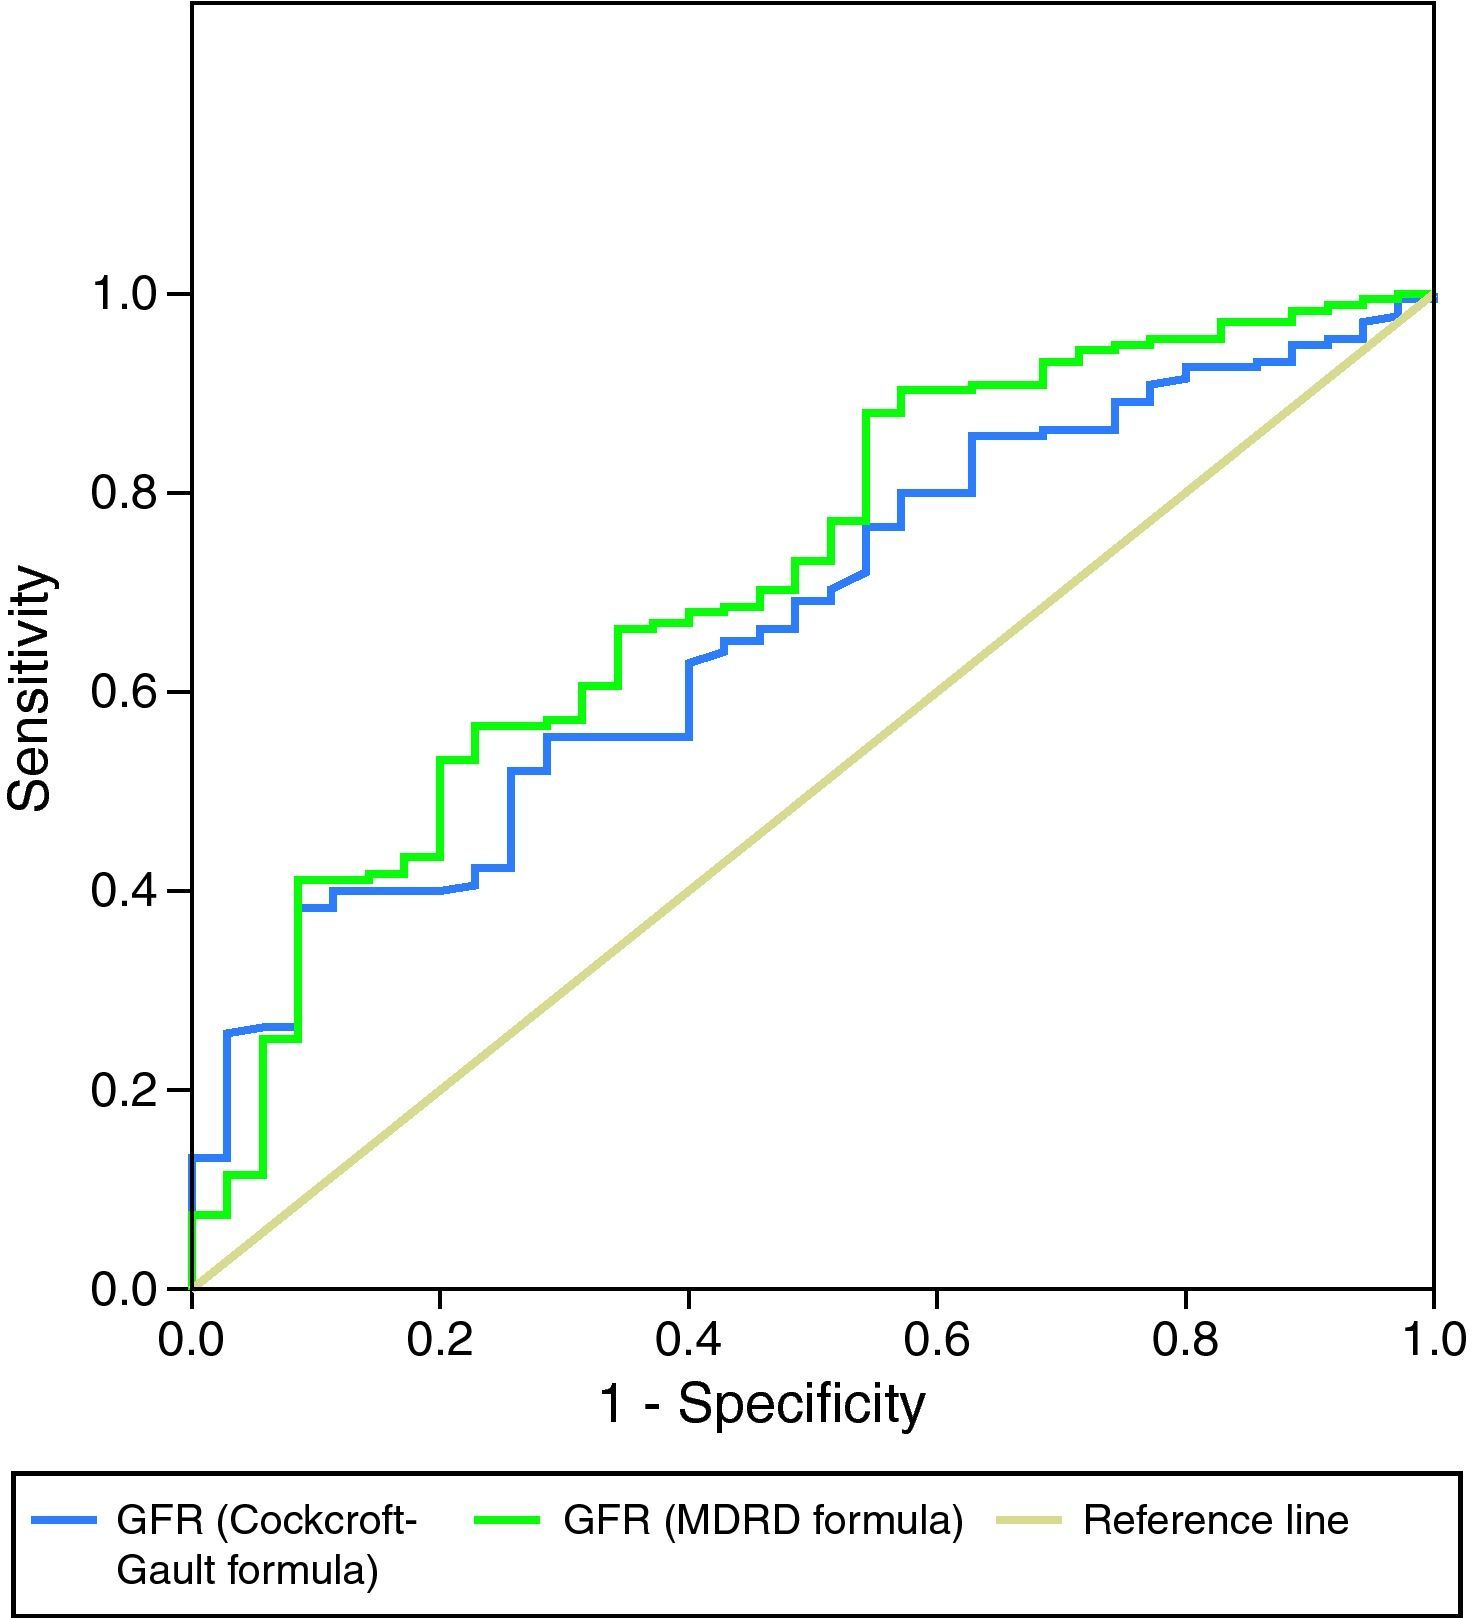
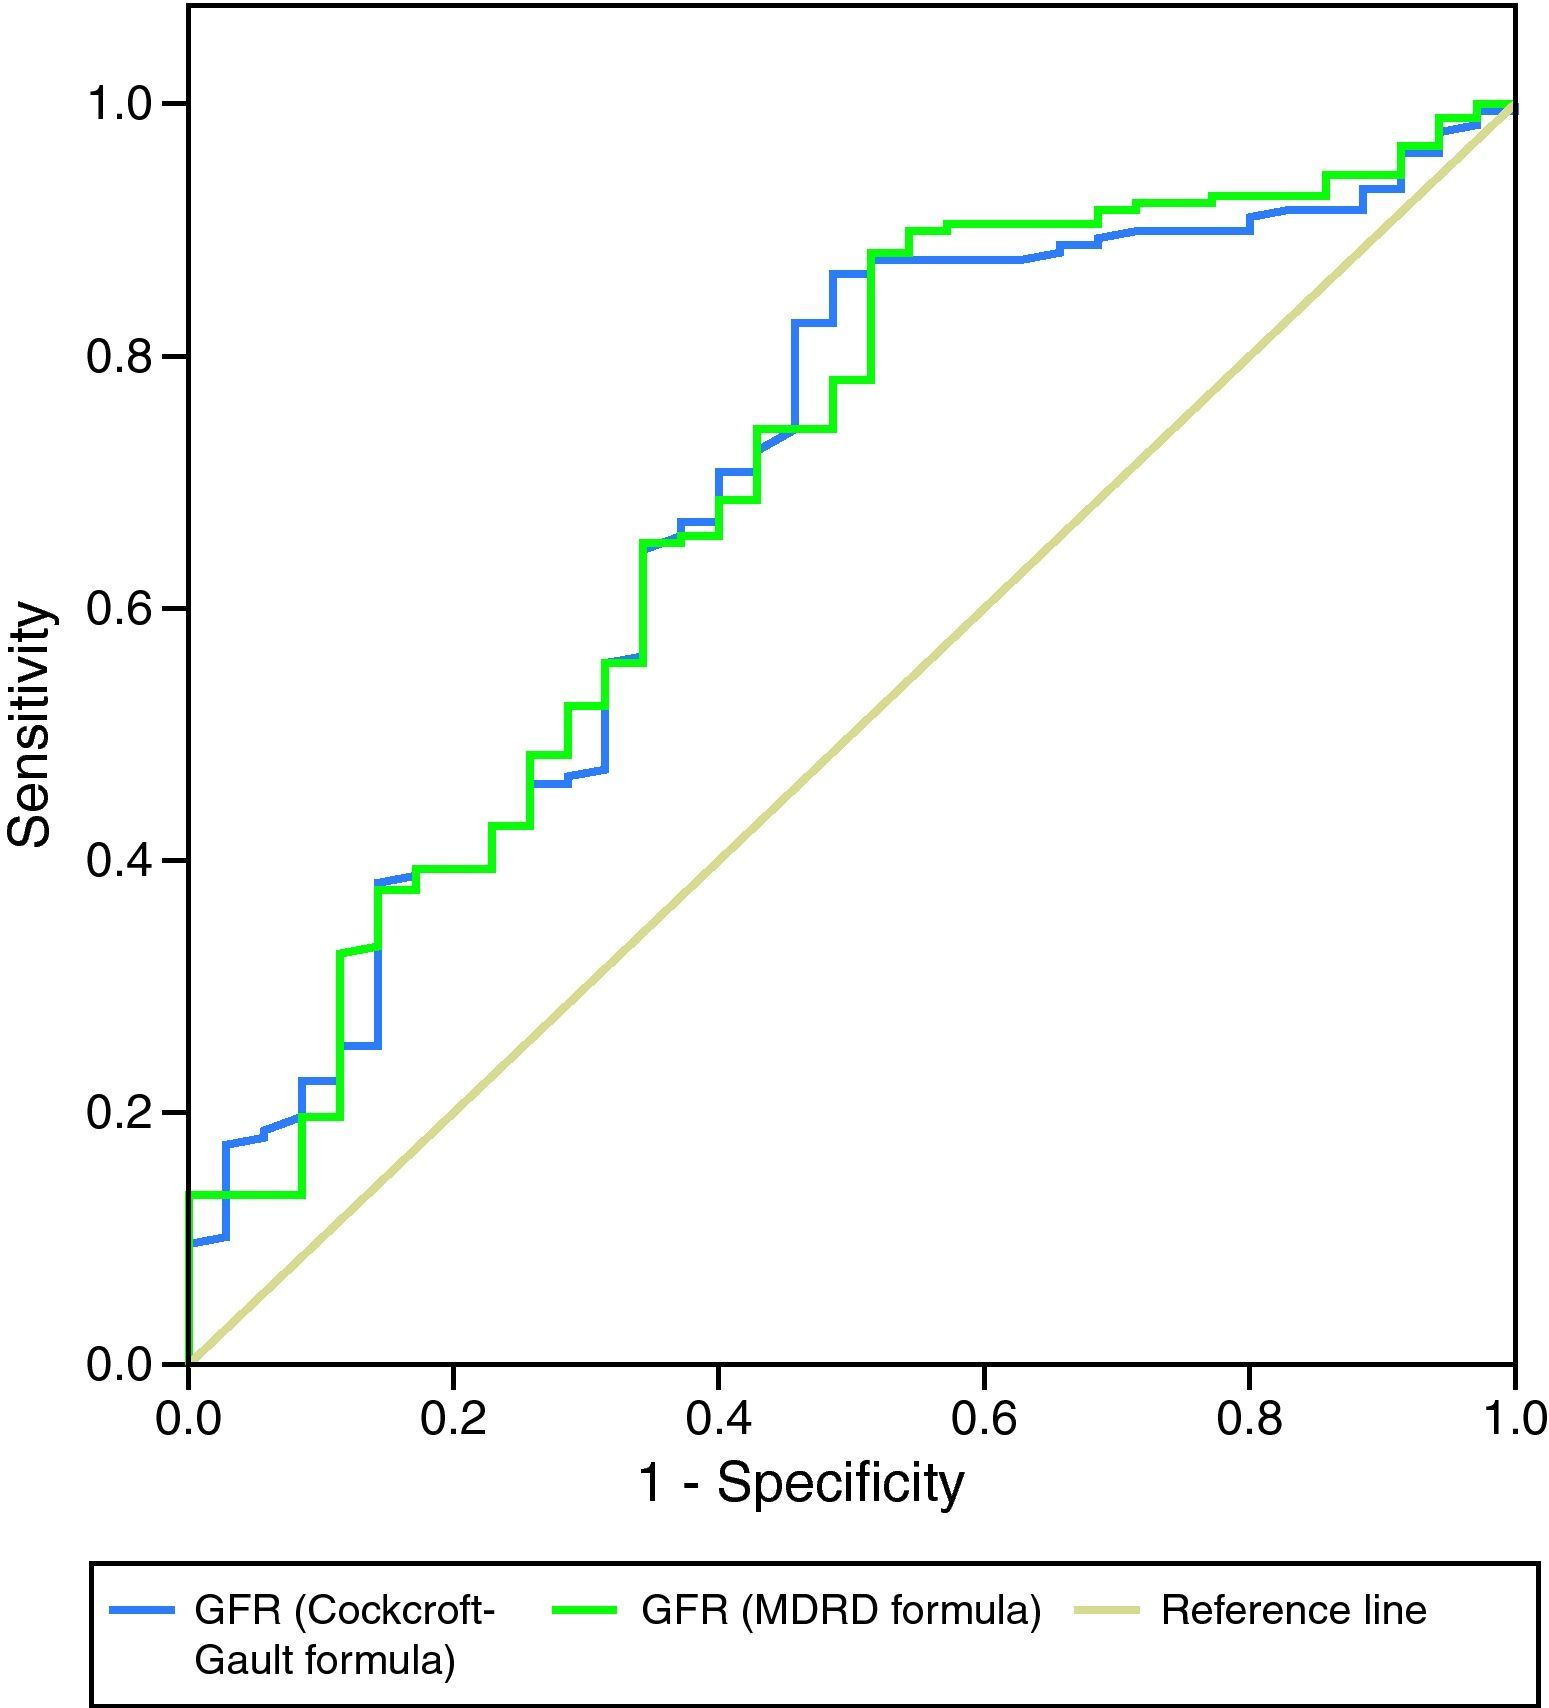
As a more reliable comparison between the two formulas, Figures 3 and 4 present ROC curves assessing the impact of GFR calculated by the MDRD and Cockcroft–Gault formulas on two-year mortality and readmission for decompensated HF, respectively.
A study by Lekston et al. demonstrated the adverse prognostic impact of impaired renal function in cardiovascular disease.9 Rutherford et al. confirmed this association, reporting that renal function estimated by serum creatinine or by GFR calculated using the Cockcroft–Gault formula was strongly predictive of short- and medium-term mortality in patients with MI.10 Mielniczuk et al. reported increased risk of reinfarction, recurrent angina and other cardiovascular outcomes in patients with acute decline in renal function in the first hours after admission for MI,11 corroborating findings by Goldberg et al., who showed increased long-term cardiovascular risk (mortality and HF) in patients with moderate to severe renal injury (creatinine >0.5mg/dl above baseline) on admission for the index MI.12
The importance of renal function has also been demonstrated in patients undergoing PCI. Xie et al. reported an increase in major cardiovascular events after coronary stenting in patients with GFR <60ml/min/1.73m2 compared to those without RF.13 A study by Celik et al. assessing the impact of GFR on myocardial perfusion following PCI concluded that GFR <60ml/min/1.73m2 was associated with lower success rates in obtaining TIMI flow >1,14 while Cardarelli et al. found that severe RF was associated with greater in-hospital mortality after PCI, particularly in younger patients.15
The prognostic impact of GFR in our population was similar to that in the above studies. Patients who died during follow-up had significantly lower GFR calculated by either formula at admission, and those with GFR <60ml/min/1.73m2 had significantly higher GRACE risk scores (to be expected given that serum creatinine is one of the variables used in calculating the score). In-hospital mortality, acute HF and readmission for decompensated HF were higher in patients with RF, irrespective of the formula used, which supports the data of Tamoaki et al., who highlighted the importance of renal dysfunction in predicting refractory HF in patients with CAD.16 Despite these findings, many studies have suggested that patients with RF do not receive the aggressive treatment that their greater cardiovascular risk demands.3 Their high bleeding risk limits the use of antiplatelet and anticoagulant agents and the possibility of PCI. In our population patients with RF less often underwent angiography, which is paradoxical, since they had a higher risk of reinfarction and recurrent angina (although in this case without statistical significance).
The important role of GFR in risk stratification of patients with MI was demonstrated in our population. Various studies have compared the ability of different methods for calculating GFR to predict short-, medium- and long-term risk in these patients. Two formulas have received particular attention: MDRD and Cockcroft–Gault.
A study by Poggio et al. showed that the MDRD formula was better for estimating renal function in patients with diabetic nephropathy and/or GFR <60ml/min/1.73m2 (estimated by urinary clearance of 125I-iothalamate). However, it tended to underestimate GFR in healthy individuals, and both formulas overestimated the strength of the association between GFR and serum creatinine levels.17 Melloni et al. reported significant differences between GFR values calculated by the two formulas in 20% of cases, which affected treatment choices in patients with high bleeding risk, and added that the Cockcroft–Gault formula is preferable in female, low body weight and elderly patients.18 O’Meara et al. compared the two formulas in patients with advanced HF and concluded that the MDRD formula has greater sensitivity and more accurate estimation of GFR when this is less than 60ml/min/1.73m2,19 while Szummer et al., comparing the two formulas in terms of their prognostic value in patients with MI, concluded that the Cockcroft–Gault formula classifies a higher percentage of patients as having moderate to severe RF, particularly in women and those with low body weight and advanced age, and better predicts 1-year mortality.20 In MI patients with indication for CABG, the Cockcroft–Gault formula has been shown to better predict in-hospital and long-term mortality.21
Abaci et al. concluded that RF is a strong predictor of extent and severity of CAD, particularly in diabetic patients.22 In our population, patients with GFR <60ml/min/1.73m2 estimated by the MDRD formula had more extensive CAD, but this was not the case when the Cockcroft–Gault formula was used. The increase in cardiovascular risk due to RF was independent of angiographic findings, since the extent of CAD was not associated with mortality. These data are in agreement with those of Beddhu et al., who reported that moderate to severe RF increases the risk of MI and cardiovascular mortality irrespective of other clinical variables or previous angiographic evidence of CAD and its extent.23
In our population, no correlation was seen between peak troponin I and GFR (except for a tendency for higher troponin I in patients with GFR <60ml/min/1.73m2 calculated by the Cockcroft–Gault formula). This confirms the conclusions of the VALIANT Echo Study,24 which aimed to determine whether alterations in cardiac structure or function contribute to the increased risk following MI in patients with RF. In this study, global systolic function, ejection fraction, infarct segment length and right ventricular function following MI were not affected by renal function, suggesting that diastolic dysfunction might be an important mediator of the increased risk. In our population, the lack of correlation between peak troponin I and GFR suggests that left ventricular systolic dysfunction after MI in patients with more extensive CAD is not the mechanism by which lower GFR has an adverse prognostic impact.
Both formulas under study were able to predict in-hospital mortality and acute HF during hospitalization for MI, which suggests that they are equally effective in predicting in-hospital (short-term) cardiovascular risk, although the MDRD formula has the possible added advantage of helping to predict CAD extent (although without sufficient reliability to be used in isolation). However, only GFR calculated by the MDRD formula was included in the predictive model for in-hospital mortality by multivariate analysis, even when both formulas were included in the analysis. GFR by the MDRD formula has short-term prognostic value independently of other variables and adds value to the well-established GRACE risk score and the presence of acute HF on admission, which is known to be associated with worse prognosis.
The lack of any association in our study between GFR by the Cockcroft–Gault formula and TIMI risk score in NSTEMI patients merits further clarification. The fact that previously documented coronary stenosis is one of the variables used to calculate the TIMI risk score could limit the strength of any association with GFR calculated by the Cockcroft–Gault formula, since patients with previous CAD did not present significantly lower GFR at admission and hence this formula did not predict extent of CAD in our population and would presumably also not predict previous coronary stenosis. The exclusion of patients with moderate to severe renal dysfunction from the study on which the TIMI score was based (although this was not an explicit major exclusion criterion)25 may also have contributed to these findings.
The prognostic impact of GFR calculated by the MDRD formula was clearly greater in the medium term. This formula predicted mortality, readmission for decompensated HF and reinfarction during follow-up. Patients with GFR <60ml/min/1.73m2 calculated by this formula had an almost 2.5 times higher risk of cardiovascular events during two-year follow-up. GFR by MDRD (but not Cockcroft–Gault) was an independent predictor of mortality during follow-up, adding value to the GRACE risk score. However, the higher rates of reinfarction and recurrent angina did not reach statistical significance and were not reflected in a higher rate of recatheterization, a paradox that has been reported in other studies.26
The prognostic impact of GFR calculated by the Cockcroft–Gault formula was weaker: although it was an effective predictor of in-hospital mortality and both acute and two-year HF in univariate analysis, it was not included in multivariate prediction models of in-hospital or two-year mortality and did not predict reinfarction. Patients with GFR <60ml/min/1.73m2 by this formula only showed a tendency for greater overall cardiovascular risk at two years (occurrence of any endpoint: p=0.09). ROC curve analysis showed the MDRD formula to be slightly superior in predicting mortality during follow-up and similar in predicting readmission for decompensated HF.
The apparent absence of an association between GFR and risk of stroke merits examination, since studies on this subject have produced conflicting results. Go et al. reported increased risk of cerebral thromboembolism in renal patients with atrial fibrillation in proportion to severity of RF independently of other predictive factors and in addition to the predictive power of proteinuria.27 By contrast, a study by Bouchi et al. showed that the increased stroke risk in patients with RF is mediated by albuminuria and not by GFR per se,28 and Bos et al. reported a strong association between low GFR and risk of hemorrhagic stroke but not with overall risk of stroke or of ischemic stroke.29 In our study population, GFR did not predict ischemic stroke, although there were more cases of stroke in the group with GFR <60ml/min/1.73m2 measured by either formula. The small number of cerebrovascular events recorded limited analysis of this endpoint.
Our results suggest that the Cockcroft–Gault formula, while useful in prognostic assessment at admission and in predicting HF, is less valuable than the MDRD formula in medium-term risk stratification of patients admitted for MI, although the difference is slight, as can be seen from the ROC curves. This is in disagreement with the findings of other authors.20,21
Any formula for estimating GFR is less reliable in populations with different characteristics from those on which it was originally based. When a formula is used in a population with a different GFR interval from the original one, the values tend to shift toward the mean of the original population (regression to the mean); a formula developed in a population with low GFR will tend to underestimate GFR in healthy individuals. Current formulas were based on patients with chronic RF and thus will tend to underestimate GFR in our population of MI patients, most with relatively preserved renal function. Furthermore, these formulas do not take into account all determinants of serum creatinine levels, such as changes in weight or muscle mass that are independent of age, gender or race, diet, and degree of tubular secretion. It should also be borne in mind that they were not designed for application in hemodynamically unstable patients (a small but not insignificant proportion of the study population).30 These potential biases affect the prognostic impact of GFR in patients with MI; it may well be that their influence is greater in the Cockcroft–Gault formula, since it is less recent.
The latest European Society of Cardiology guidelines for non-ST segment elevation acute coronary syndromes state that renal function is best assessed with GFR according to the MDRD equation, but add that in daily clinical practice, creatinine clearance calculated with the Cockcroft–Gault formula may also be used.31
Despite all these considerations, the clinician should always bear in mind that renal dysfunction, even when subclinical, predicts greater cardiovascular risk and worse prognosis. The complexities of its associations with more extensive CAD, greater risk of drug side-effects, more complications in invasive procedures and greater incidence of comorbidities, among others, mean that the question cannot be reduced to one of simple mathematics.
Study limitationsWe should point out some of the limitations of this study:
- –
The study population was relatively small. Larger samples will be needed to obtain more reliable conclusions.
- –
Ninety patients did not undergo catheterization, which may have biased the study's analysis of possible links between GFR and CAD extent.
- –
TIMI score was calculated only for NSTEMI patients, not for those with STEMI.
- –
Readmission for decompensated HF is difficult to define and standardize. We included only patients requiring hospitalization for >48hours, but even on this basis, patients with clinical presentations of widely differing severity could have been included in the analysis.
- –
Killip class was used to assess the presence of acute HF. However, we recognize the imprecision of the classification; HF is a well-defined clinical setting with symptoms of variable severity, and a patient in Killip class II does not necessarily have HF symptoms and so should strictly not be classified as having acute HF.
- –
Recent studies have shown that other parameters of renal function, particularly urea and cystatin C levels at admission, have at least as much predictive power as GRF for assessing risk. It would be interesting to see whether GRF calculated by the MDRD formula would still be an independent predictor of mortality if urea and/or cystatin C levels were included in the analysis.
It is essential to obtain an estimate of GFR in patients admitted with MI. Besides enabling the administration of effective and safe doses of the wide variety of drugs that these patients require, it is also necessary for stratification of overall in-hospital and medium-term cardiovascular risk.
The present study suggests that the MDRD formula is slightly superior to the Cockcroft–Gault formula for prognostic evaluation of these patients, and is an independent predictor of in-hospital and two-year mortality, unlike the Cockcroft–Gault formula. Multivariate models and ROC curve analysis show that the MDRD formula is more appropriate for clinical assessment and cardiovascular risk stratification and should be used in patients admitted to the ICU with MI. However, the difference between the two formulas is small, and so it is important to remember that it is the assessment of renal function itself that counts, rather than the choice of formula.
Conflicts of interestThe authors have no conflicts of interest to declare.
Please cite this article as: Barra, S et al. Taxa de filtração glomerular: que fórmula deverá ser usada em doentes com enfarte agudo do miocárdio? Rev Port Cardiol. 2012;31(7-8):493-502.
