


Pulmonary angiography by computed tomography (CT) is the method of choice for the detection of acute pulmonary embolism (PE). Studies have shown that the severity of PE can be estimated by clot burden scores.
ObjectiveTo evaluate the correlation between an angiographic clot burden score (Qanadli score–QS) and parameters of right ventricular dysfunction (RVD) in patients admitted for PE.
MethodsWe performed a retrospective study of 107 patients (60% female) admitted to an intensive care unit for PE (intermediate/high risk) between January 1, 2007 and September 30, 2011. Images from 16-slice multidetector CT angiography were reviewed in 102 patients and the QS calculated. Based on a cut-off of 18 points established by ROC curve analysis, two groups were formed (A<18 points vs. B≥18 points) and the clinical, laboratory, ECG, echocardiographic and CT angiography parameters were compared. The statistical analysis was performed using SPSS.
ResultsThe overall mean age was 61.4 years. With regard to symptoms at admission, there was a greater prevalence in group B of fatigue, chest pain and syncope (p=0.017), with higher Geneva and Wells scores and shock index.
In terms of ECG parameters, heart rate and percentage of right bundle branch block, T-wave inversion (V1–V3) and S1Q3T3 pattern (p=0.034) were higher in group B, as was the ECG score (p=0.009).
Laboratory tests revealed that group B had higher troponin and d-dimers, with lower creatinine clearance by the MDRD formula (p=0.020) and PO2/FiO2 ratio. Echocardiography showed higher pulmonary artery systolic pressure in group B, and CT angiography revealed larger right ventricular (RV) diameters and higher RV/LV ratio (p=0.002), and greater superior vena cava, azygos vein and coronary sinus diameters in this group. Pulmonary artery (PA) diameter and the PA/aorta ratio were similar. Interventricular septal bowing and reflux of contrast into the inferior vena cava (p=0.001) were greater in group B, and QS>18 was an independent predictor of RVD (RV/LV ratio>1) (OR: 10.85; p<0.001) (area under the curve on ROC analysis: 0.79; p<0.001).
The percentage of patients receiving fibrinolytic treatment was higher in group B (p=0.045), and in-hospital mortality was similar in both groups (overall 4.9%).
ConclusionsQS>18 points proved to be an independent predictor of RVD in PE, and correlated linearly with variables associated with higher morbidity and mortality.
A angio-TC pulmonar é o método de escolha para o diagnóstico de tromboembolismo pulmonar (TEP). Estudos têm demonstrado que a gravidade do TEP poderá ser estimada com sistemas de quantificação de carga embólica.
ObjetivoAvaliar a correlação entre um score de carga embólica angiográfica (Qanadli score – QS), com os parâmetros de disfunção ventricular direita (DVD), em pacientes com TEP.
MétodosEstudo retrospetivo de 107 pacientes (feminino – 60%), admitidos por TEP (intermédio/elevado risco) numa UCIC (1/1/2007-30/9/2011). Revistas as imagens de angio-TC de 102 pacientes (TCMD-16C) e quantificado o QS. Estabelecido cut-off de 18 pontos por curva ROC. Constituídos 2 grupos (G) (A<18 versus B≥18 pontos) e comparados os parâmetros clínicos, analíticos, ECG, ecocardiográficos e de angio-TC. Análise estatística com SPSS.
ResultadosA idade média foi de 61,4. Nos sintomas de admissão, verificou-se no GB uma prevalência de queixas de cansaço, dor torácica e síncope/lipotimia (p-0,017) bem como score de Geneva, Wells e Shock-index superiores.
No ECG, a FC média, percentagem de BCRD, inversão da onda T (V1-V3) e de S1Q3T3 (p-0,034) foram superiores no GB, assim como o ECG score (p-0,009).
Analiticamente, o GB apresentou valores de troponina e PDF mais elevados com ClCrMDRD e ratio PO2/fiO2 inferiores. No ecocardiograma, os valores de PSAP foram superiores no GB. Na angio-TC, o GB apresentou diâmetros do VD, ratio VD/VE (p-0,002), veia cava (VC) superior, veia ázigos e seio coronário, superiores. Os diâmetros da artéria pulmonar (AP) e o ratio AP/aorta foram semelhantes. A percentagem de sobrecarga no septo IV e refluxo na VC inferior foram superiores no GB, revelando-se o QS>18 preditor independente de DVD (VD/VE> 1) (OR:10,85;p<0,001) (AUC-ROC: 0,79; p<0,001). A percentagem de tratamento fibrinolítico foi superior no GB (p-0,045), sendo a taxa de mortalidade intra-hospitalar (global-4,9%) idêntica entre grupos.
ConclusõesUm QS>18 pontos revelou-se preditor independente de DVD no TEP, correlacionando-se linearmente com multivariáveis associadas a morbi/mortalidade mais elevada.
Aorta
Area under the curve
Azygos vein
Confidence interval
Coronary sinus
Electrocardiogram
Heart rate
Left ventricular
Intensive care unit
Interventricular septum
Multidetector computed tomography
Odds ratio
Pulmonary artery
Pulmonary arterial systolic pressure
Pulmonary embolism
Qanadli Score
Receiver operating characteristic
Right bundle branch block
Right ventricular
Right ventricular dysfunction
Vena cava
Acute pulmonary thromboembolism (PE) is a common and potentially fatal disease, with mortality of 2–7%, even when treated with anticoagulation.1
The introduction of multidetector computed tomography (MDCT) pulmonary angiography has considerably changed the approach to PE and is currently the diagnostic method of choice due to its convenience, speed, sensitivity and ability to visualize clots and exclude alternative diagnoses.2
Echocardiography is recommended as the first-line exam in patients with shock or hypotension following PE to detect signs of right ventricular dysfunction (RVD).3,4 However, a substantial proportion (40%) of normotensive patients with PE present with echocardiographic signs of RVD. These patients with latent hemodynamic impairment have a 10% risk of developing shock and a 5% rate of in-hospital mortality.3,5 Since MDCT is the first-line technique to diagnose PE, assessing RVD by this technique would facilitate risk stratification in all patients.3
Small studies using helical CT have suggested that the ratio between right ventricular (RV) and left ventricular (LV) short-axis diameters is an accurate sign of RVD.6–9 Other MDCT criteria have also been proposed, including bowing of the interventricular septum (IVS), ratio of pulmonary artery (PA) to aorta (Ao) diameter, and diameters of the superior vena cava (VC), azygos vein (AV) and coronary sinus (CS). Reflux of contrast into the inferior VC or AV is also associated with RVD.10,11
Besides direct and indirect signs of RV overload, the severity of PE as quantified by clot burden scores has been proposed as an important predictor of RVD.8,12–14 Typically, an obstruction index of 40–60% is associated with intermediate/high-risk PE. However, its overall relationship with clinical, laboratory, electrocardiographic (ECG) and echocardiographic parameters and dimensions of the cardiac structures is not fully clarified in the literature.
The aim of our study was thus to evaluate the correlation between an established angiographic clot burden score (Qanadli score–QS) and parameters of RVD (clinical and diagnostic exams) in patients admitted for PE.
MethodsWe performed a retrospective study of 107 patients admitted to an intensive care unit (ICU) for PE (intermediate/high risk) between January 2007 and September 2011.
Images from 16-slice MDCT angiography were reviewed in 102 patients, after excluding patients in whom images were not available on the database or in whom poor image quality precluded accurate assessment. The dimensions of the cardiac and vascular structures involved in PE were determined, and the clot burden in the pulmonary vascular tree was quantified using the established and validated QS.12
Blood sample collection and ECG were performed on admission to the emergency department and during hospitalization in the ICU. Echocardiography was performed on admission to the ICU.
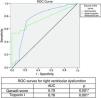
Study populationFollowing calculation of QS, a cut-off of 18 points was established by receiver operating characteristic (ROC) curve analysis (Figure 1). The population was divided into two groups – group A (n=39): <18 points and group B (n=63): ≥18 points – and the clinical, laboratory, ECG, echocardiographic and MDCT angiography parameters were compared.
Imaging studies ROC curve for Qanadli score and troponin I for right ventricular dysfunction (right ventricular/left ventricular ratio >1).'/>
MDCT images were acquired in the caudocranial direction (collimation 1.25mm) to allow accurate imaging of the main, lobar, segmental and subsegmental arteries of the lower, middle and upper lobes.
A 120ml bolus of iodinated contrast (concentration 350mg/ml) was injected into the left antecubital vein (whenever possible) at a rate of 4ml/s, using an automatic injector system.
The images were reviewed independently by two radiologists on a workstation, without knowledge of the patients’ clinical variables, diagnostic exam results or in-hospital outcome.
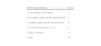
To define the MDCT obstruction index, the arterial tree of each lung was regarded as having 10 segmental arteries (three to the upper lobes, two to the middle lobe and to the lingula, and five to the lower lobes), each obstructed artery being scored 1 point.12 Emboli in a main or lobar artery were given a score equal to the number of non-vascularized segmental arteries. To provide additional information on residual distal perfusion, a weighting factor was assigned to each value, depending on the degree of vascular obstruction (total occlusion=2 points) (Table 1), giving a maximum score of 40 points.
The Qanadli score.
| No. of arteries assessed | Score | Maximum score |
| 10 segmental arteries in each lung (n=20) | 0 – No thrombus observed | 40 |
| 1 – Partial occlusion | ||
| 2 – Total occlusion |
Adapted from Qanadli et al.12.
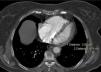
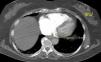
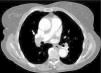
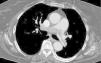
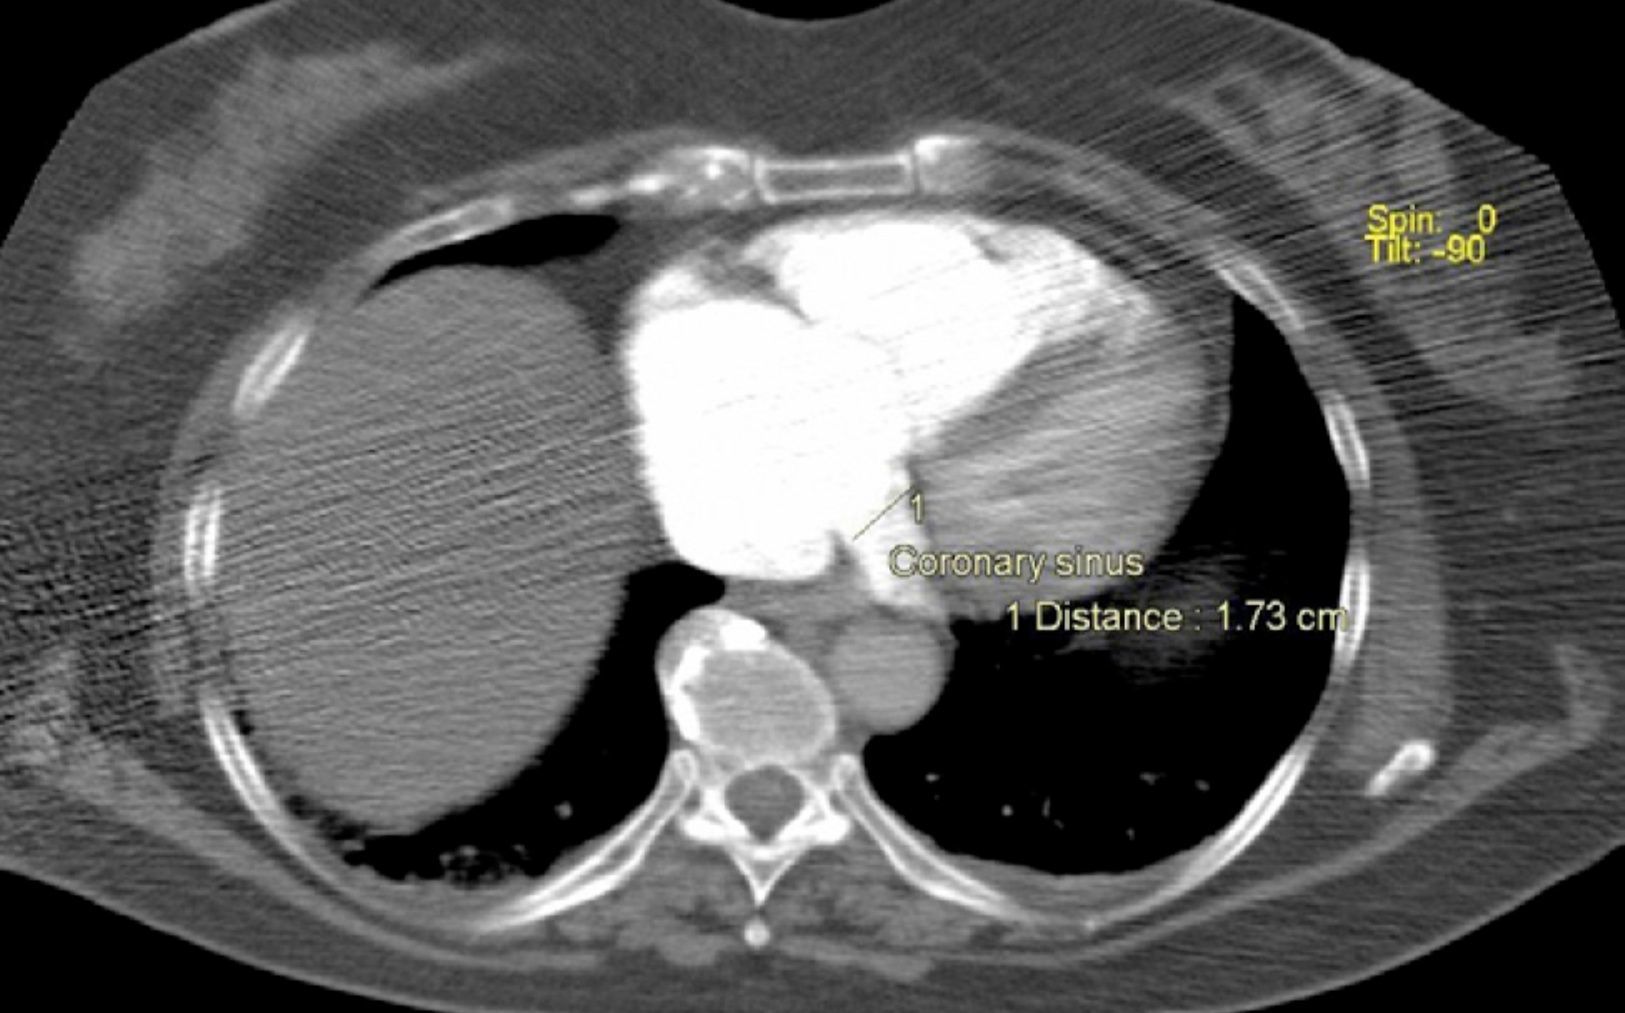
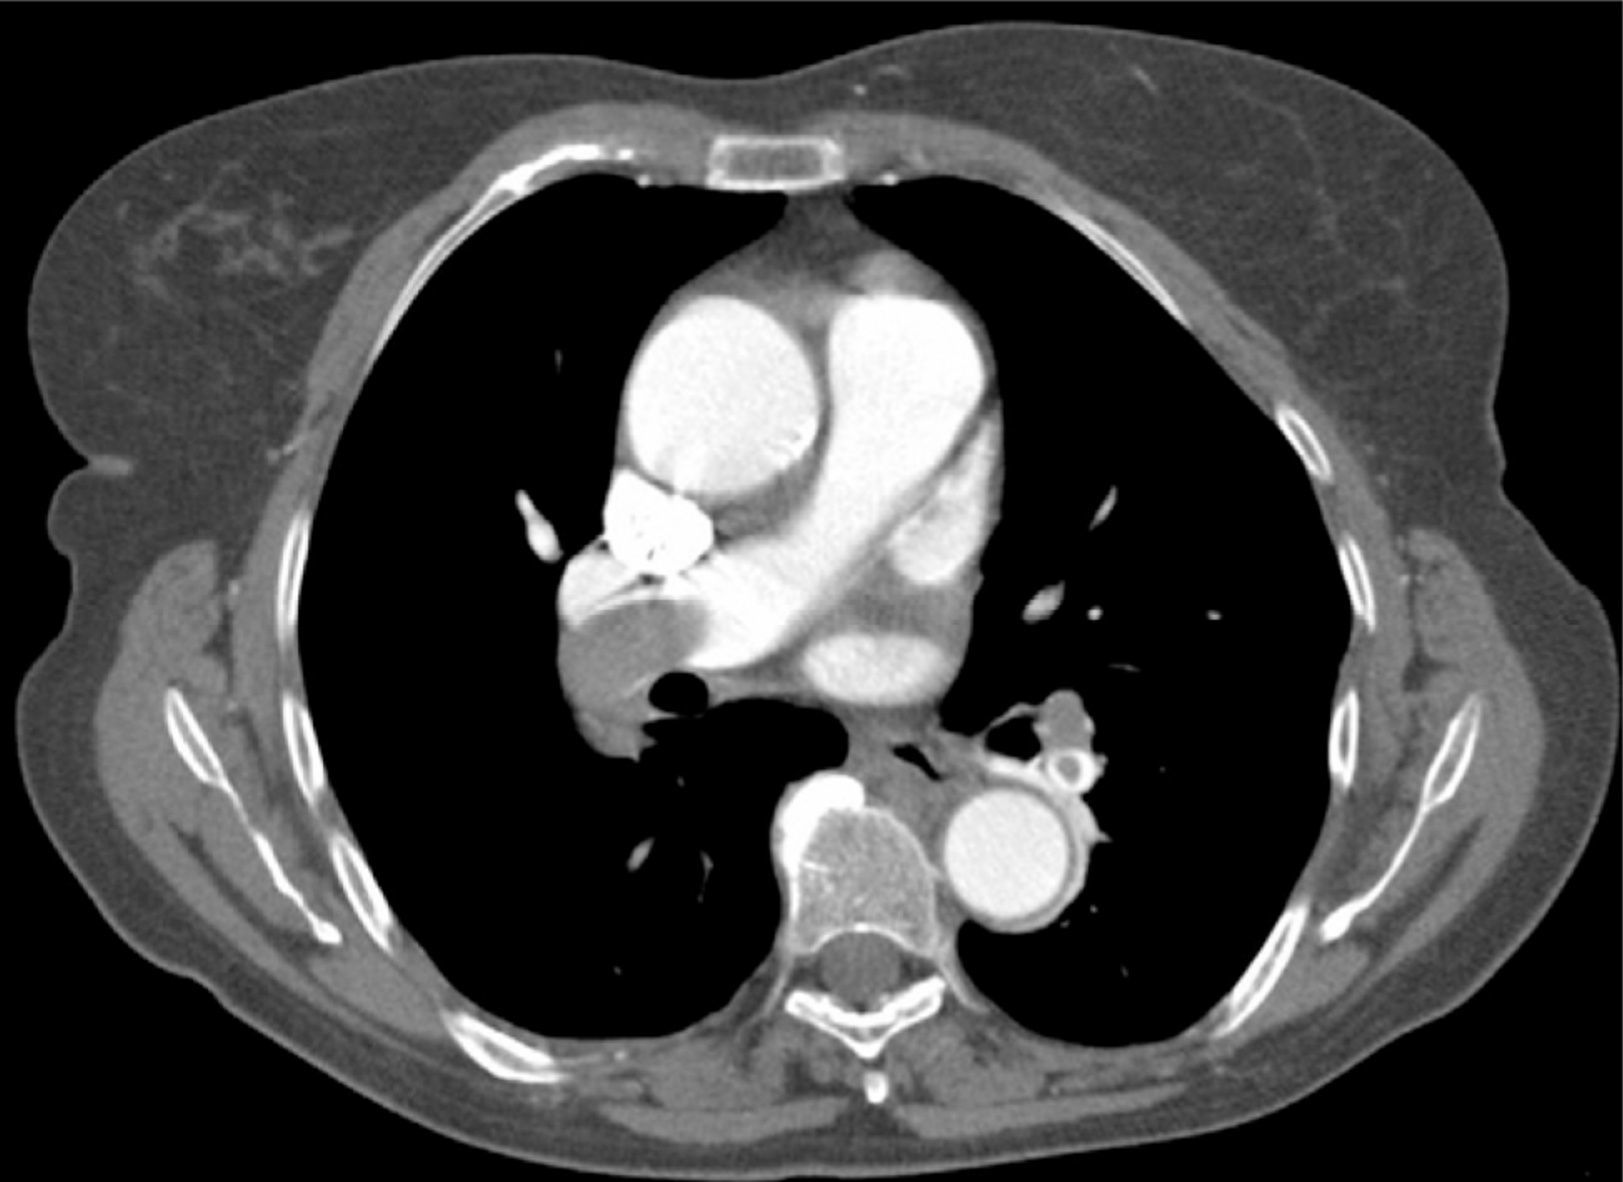
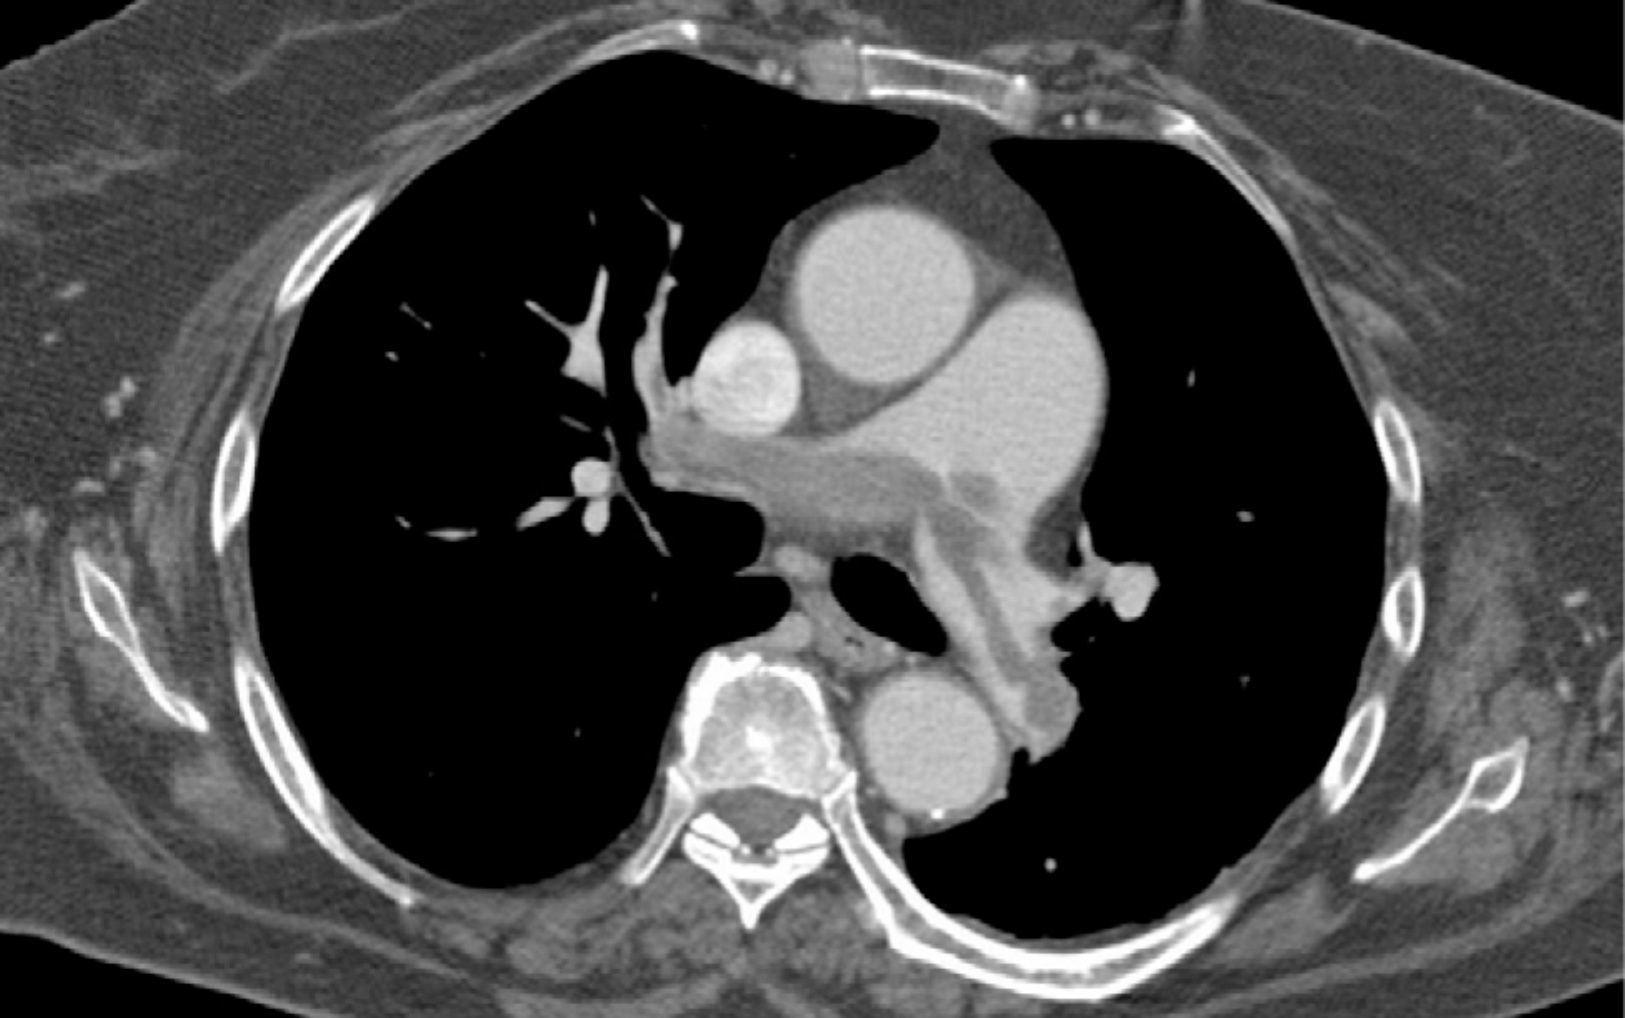
Besides evaluation of clot burden by MDCT, vascular (superior VC and AV) and cardiac dimensions (RV, LV, RV/LV ratio, CS, PA, Ao, PA/Ao ratio) related to the pulmonary tree were also measured. IVS bowing and reflux of contrast into the inferior VC were assessed qualitatively to determine signs of RVD (Figures 2–5).
Modified ECG score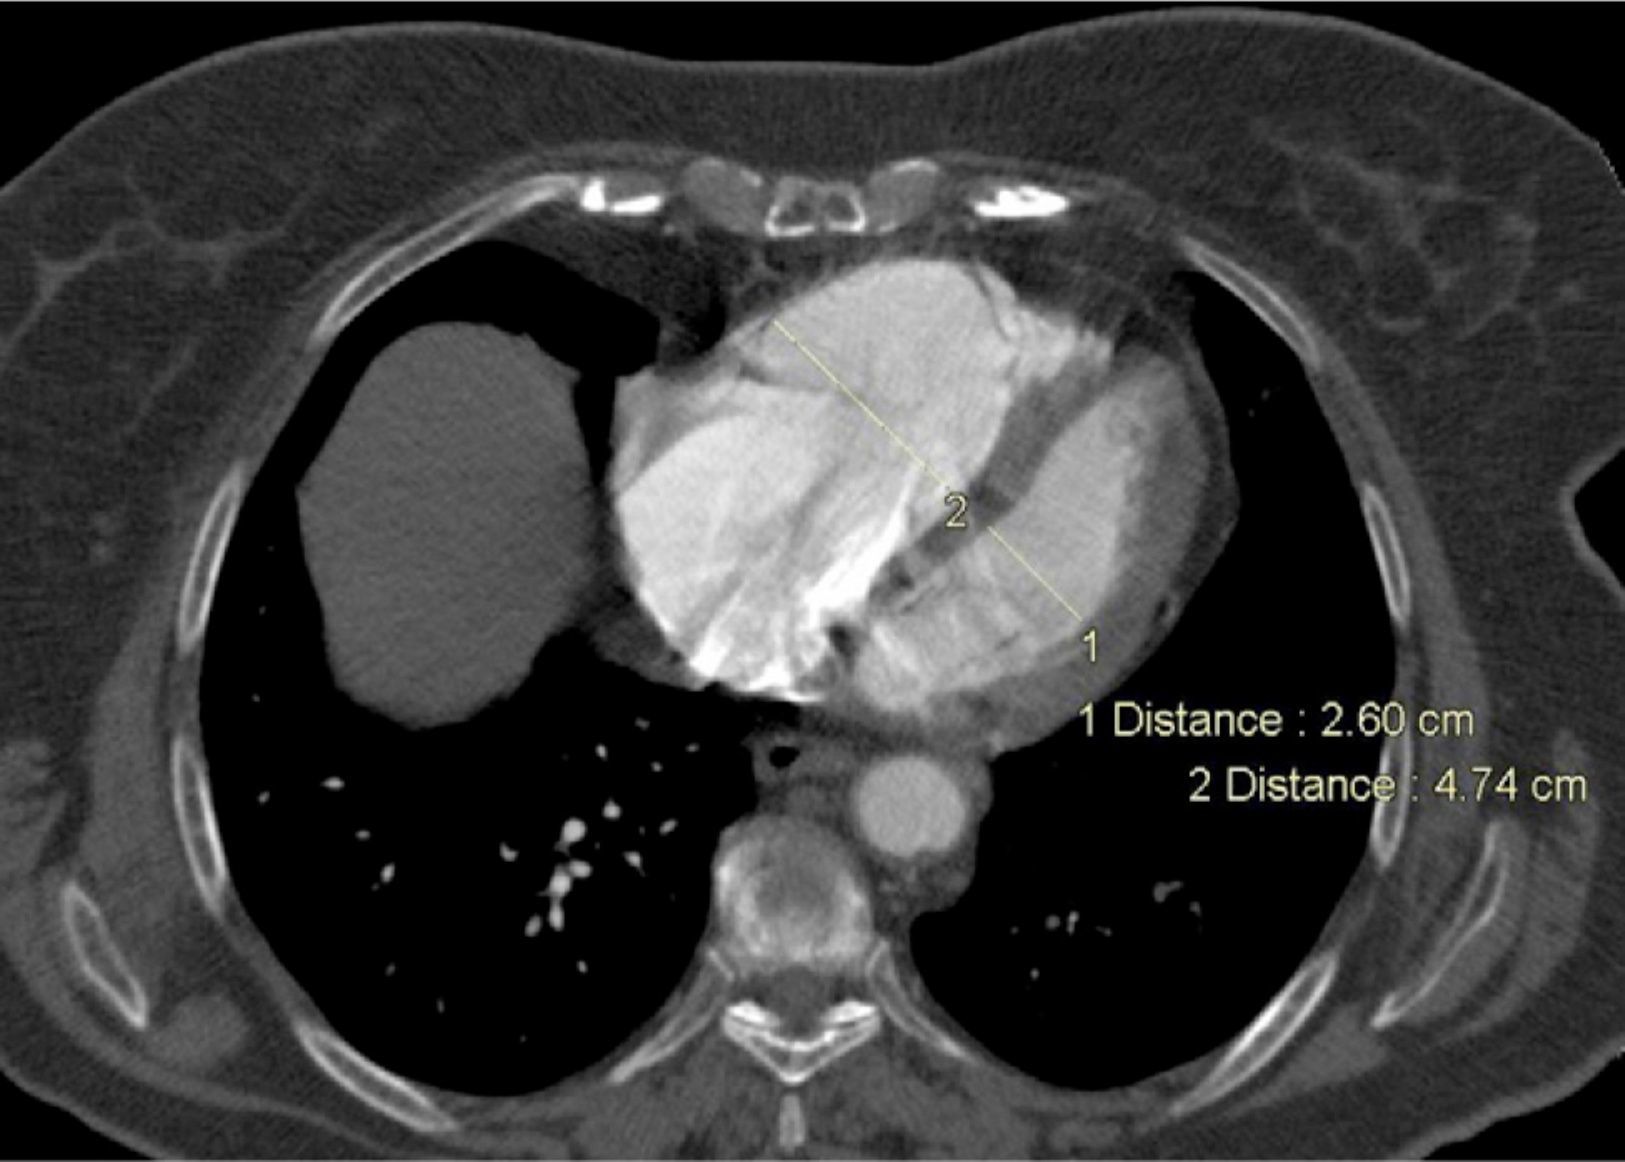
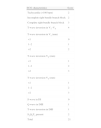
ECG was performed in all patients as part of the initial clinical assessment on admission to the emergency department. A modified ECG score was calculated based on a previously validated system15 (Tables 2 and 3), from which certain variables were excluded, and the points attributed to each variable were adjusted. The quantification in mm of T-wave inversion in V1–V3 was not included as we considered that the presence of T-wave inversion in these leads was qualitatively assessed in the ECG score. Furthermore, a S1Q3T3 pattern was only included when all its components were present.
ECG score.
| ECG characteristics | Score |
| Tachycardia (>100bpm) | 2 |
| Incomplete right bundle branch block | 2 |
| Complete right bundle branch block | 3 |
| T-wave inversion in V1–V4 | 4 |
| T-wave inversion in V1 (mm) | |
| <1 | 0 |
| 1–2 | 1 |
| >2 | 2 |
| T-wave inversion V2 (mm) | |
| <1 | 1 |
| 1–2 | 2 |
| >2 | 3 |
| T-wave inversion V3 (mm) | |
| <1 | 1 |
| 1–2 | 2 |
| >2 | 3 |
| S wave in DI | 0 |
| Q wave in DIII | 1 |
| T-wave inversion in DIII | 1 |
| S1Q3T3 present | 2 |
| Total | 21 |
S1Q3T3: S wave in DI, Q wave in DIII, T-wave inversion in DIII. Adapted from Daniel KR et al.15.
SPSS was used for statistical analysis of the results, which are presented as means±standard deviation and overall percentages. The variables under study were compared using the chi-square test and independent t test. ROC curves were constructed to establish the best cut-off for QS. A value of p<0.05 was considered statistically significant.
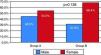
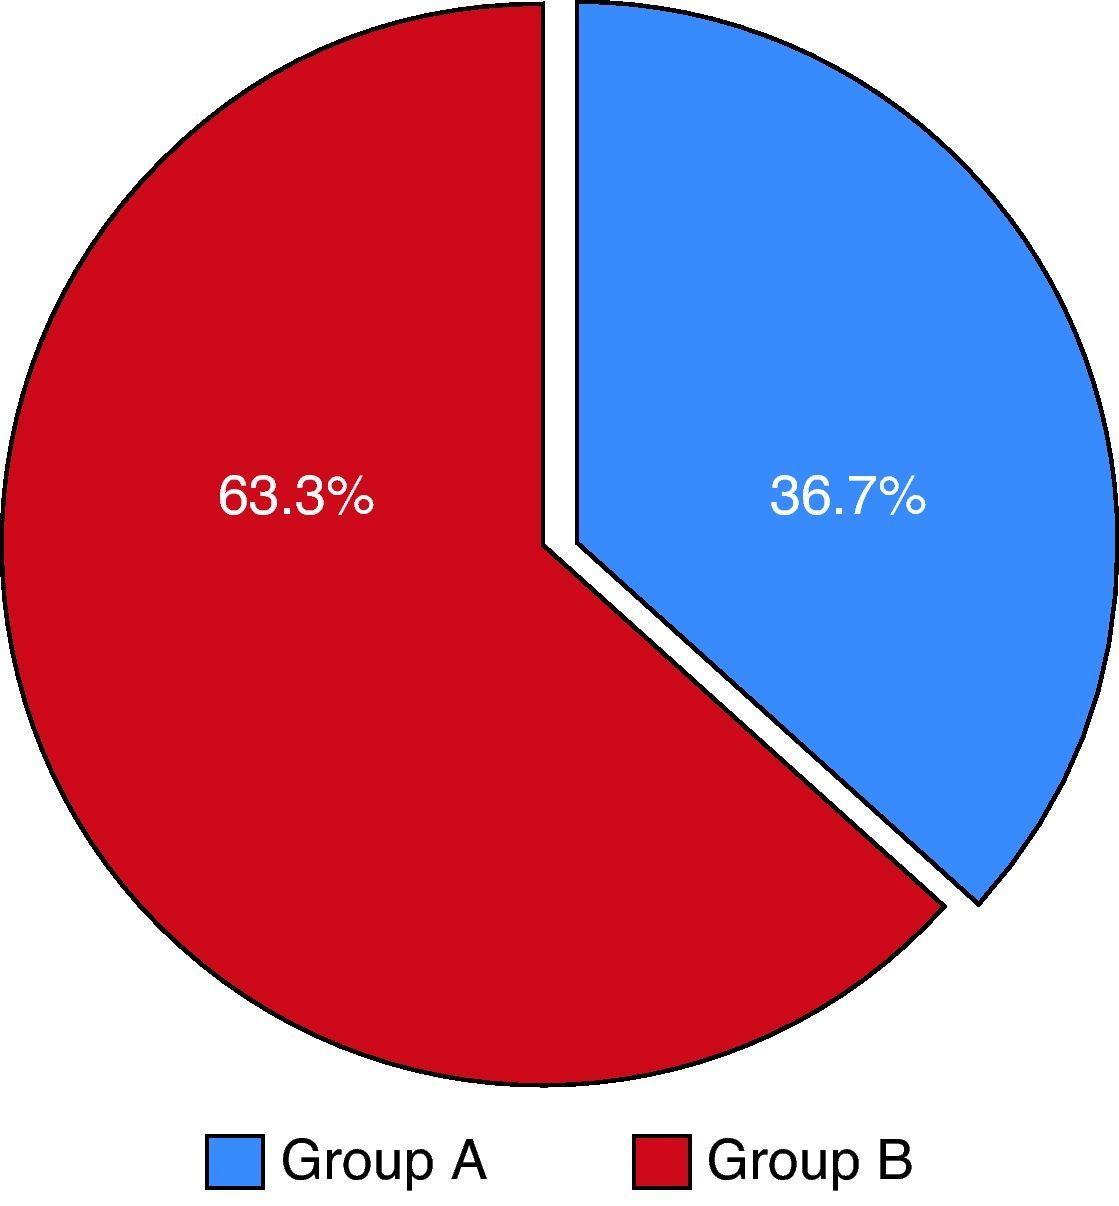
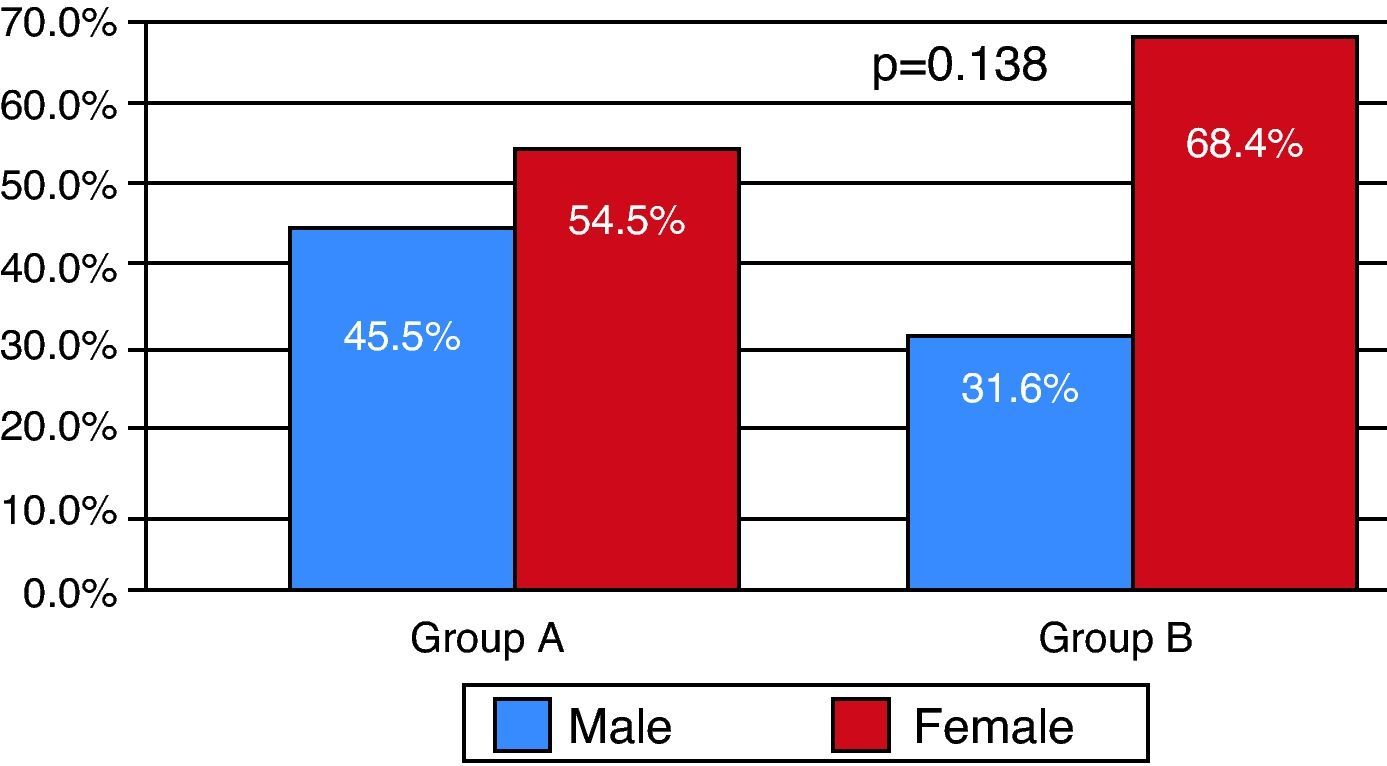
ResultsCharacteristics of the study populationOf the 102 patients included (overall mean age 61.5 years), 36.7% made up group A and 63.3% group B (Table 4), with an overall predominance of women (63.3%), which was maintained in both groups (Figures 6 and 7). The mean clot burden score was 18.46 points.
Analysis of risk factors for PE showed no differences in the percentage of patients with deep vein thrombosis. Recent surgery was more prevalent in group A, other risk factors being more common in group B, but without statistical significance.
With regard to symptoms at admission, there was a greater prevalence in group B of fatigue, chest pain and syncope/lipothymia (p=0.017), as well as higher Geneva and Wells scores and shock index (p=0.006) (Table 5).
Clinical characteristics at admission by subgroup.
| Subgroups according to Qanadli score | |||
| QS<18 (n=39) | QS>18 (n=63) | p | |
| Mean age (years) | 61.4 | 59.1 | 0.57 |
| Risk factors | |||
| DVT | 23.5% | 23.3% | 0.640 |
| Surgery (<1 month) | 35.3% | 16.7% | |
| Bone fracture (<1 month) | 5.9% | 10% | |
| Cancer | 11.8% | 16.7% | |
| Oral contraceptives | 5.9% | 13.3% | |
| History of PE | 0% | 6.7% | |
| Lupus/autoimmune disease | 0% | 3.3% | |
| Pregnancy | 0% | 3.3% | |
| Symptoms at admission | |||
| Dyspnea/tachypnea | 75.8% | 70.2% | 0.376 |
| Asthenia | 30.3% | 38.6% | 0.288 |
| Chest pain | 48.5% | 57.9% | 0.260 |
| Syncope/lipothymia | 21.2% | 45.9% | 0.017a |
| Cough | 18.2% | 17.5% | 0.576 |
| Hemoptysis | 6.1% | 3.5% | 0.468 |
| Clinical scores | |||
| Geneva score | 5.7 (±3.4) | 6.3 (±1.9) | 0.457 |
| Wells score | 4.2 (±2.4) | 4.5 (±1.8) | 0.529 |
| Blood pressure | |||
| SBP (mmHg) | 127.3 (±22.4) | 113.3 (±24.2) | 0.008a |
| DBP (mmHg) | 75.9 (±15.3) | 72 (±18) | 0.293 |
| Shock index (HR/SBP) | 0.78 (±0.24) | 0.97 (±0.31) | 0.006a |
DBP: diastolic blood pressure; DVT: deep vein thrombosis; HR: heart rate; PE: pulmonary embolism; SBP: systolic blood pressure.
In terms of ECG parameters, mean heart rate (HR) and percentage of right bundle branch block (RBBB), T-wave inversion V1–V3 and S1Q3T3 pattern (p=0.034) were higher in group B, reflected in higher mean modified ECG scores (Table 6).
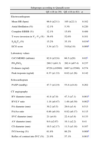
Electrocardiographic, laboratory, echocardiographic and CT angiographic parameters by subgroup.
| Subgroups according to Qanadli score | |||
| QS<18 (n=39) | QS>18 (n=63) | p | |
| Electrocardiogram | |||
| Mean HR (bpm) | 96.9 (±23.1) | 105 (±22.1) | 0.102 |
| Atrial fibrillation (%) | 12.1% | 5.3% | 0.220 |
| Complete RBBB (%) | 12.1% | 15.8% | 0.489 |
| T-wave inversion in V1–V3 (%) | 36.4% | 52.6% | 0.101 |
| S1Q3T3 (%) | 15.2% | 35.1% | 0.034a |
| ECG score | 3.34 (±3.7) | 5.63(±3.9) | 0.009a |
| Laboratory values | |||
| CrCl MDRD (ml/min) | 82.9 (±32.6) | 66.5 (±29) | 0.02a |
| PO2/FiO2 | 280.3 (±61.3) | 262.4 (±67.4) | 0.237 |
| D-dimers (ng/ml) | 6729 (±10500) | 8467 (±15506) | 0.574 |
| Peak troponin (ng/ml) | 0.37 (±1.33) | 0.82 (±1.26) | 0.142 |
| Echocardiogram | |||
| PASP (mmHg) | 47.7 (±12.9) | 53.8 (±14.8) | 0.262 |
| CT angiography | |||
| RV diameter (mm) | 41.8 (±7.9) | 47.3 (±7.1) | 0.001a |
| RV/LV ratio | 1.18 (±0.47) | 1.48 (±0.39) | 0.002a |
| PA diameter (mm) | 30.2 (±5.5) | 29.6 (±3.4) | 0.513 |
| PA/Ao ratio | 0.86 (±0.16) | 0.92 (±0.17) | 0.115 |
| SVC diameter (mm) | 21 (±4.9) | 22.4 (±3.8) | 0.133 |
| AV diameter (mm) | 9.6 (±2.67) | 10.1 (±2.2) | 0.41 |
| CS diameter (mm) | 10.5 (±2.17) | 11.5 (±3.18) | 0.107 |
| IVS bowing (%) | 61.8% | 86.2% | 0.008a |
| Reflux of contrast into IVC (%) | 21.9% | 57.1% | 0.001a |
Ao: aorta; AV: azygos vein; CrCl MDRD: creatinine clearance by the MDRD formula; CS: coronary sinus; HR: heart rate; IVC: inferior vena cava; IVS: interventricular septum; LV: left ventricular; PA: pulmonary artery; PASP: pulmonary artery systolic pressure; RBBB: right bundle branch block; RV: right ventricular; SVC: superior vena cava.
Laboratory tests revealed that group B had higher troponin and d-dimers, with lower creatinine clearance by the MDRD formula (p=0.020) and PO2/FiO2 ratio. Echocardiography showed higher pulmonary artery systolic pressure (PSAP) in group B (Table 6).
CT angiography showed larger RV diameters and higher RV/LV ratio (p=0.002), and larger superior VC, AV and CS diameters in group B. PA diameter and PA/Ao ratio were similar.
Interventricular septal bowing and reflux of contrast into the inferior VC (p=0.001) were greater in group B, and QS >18 points was an independent predictor of RVD (RV/LV ratio >1) (OR: 10.85 [95% confidence interval 3.20-36.77]; p<0.001) (area under the curve [AUC] on ROC analysis: 0.79; p<0.001), with a sensitivity of 78.4% and specificity of 79% (Figure 1, Table 7).
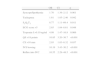
Independent predictors of right ventricular dysfunction.
| OR | CI | p | |
| Syncope/lipothymia | 1.70 | 1.36–2.12 | 0.001 |
| Tachypnea | 1.61 | 1.05–2.46 | 0.042 |
| S1Q3T3 | 8.77 | 1.11–69.4 | 0.011 |
| ECG score >5 | 2.85 | 1.04–8.61 | 0.048 |
| Troponin I >0.10ng/ml | 4.98 | 1.47–16.8 | 0.006 |
| QS>18 points | 10.85 | 3.20–36.7 | <0.001 |
| CS>10mm | 2.93 | 1.03–8.32 | 0.037 |
| IVS bowing | 10.19 | 3.43–30.2 | <0.001 |
| Reflux into IVC | 10.55 | 2.29–48.5 | <0.001 |
CI: confidence interval; CS: coronary sinus; IVC: inferior vena cava; IVS; interventricular septum, OR: odds ratio; QS: Qanadli score.
In the remainder of the univariate analysis, the following were also identified as predictors of RVD: syncope/lipothymia, tachypnea, S1Q3T3 pattern, modified ECG score >5, peak troponin I >0.10ng/ml, IVS bowing, reflux on contrast into the inferior VC and CS diameter >10mm (Table 7). Comparative analysis of the ROC curves showed that QS had a greater AUC than peak troponin, whose association with RVD has been clearly established (Figure 1).
The percentage of patients receiving fibrinolytic treatment was higher in group B (p=0.049), and in-hospital mortality was similar in both groups (overall 4.9%; n=5) (Figure 8).
Discussion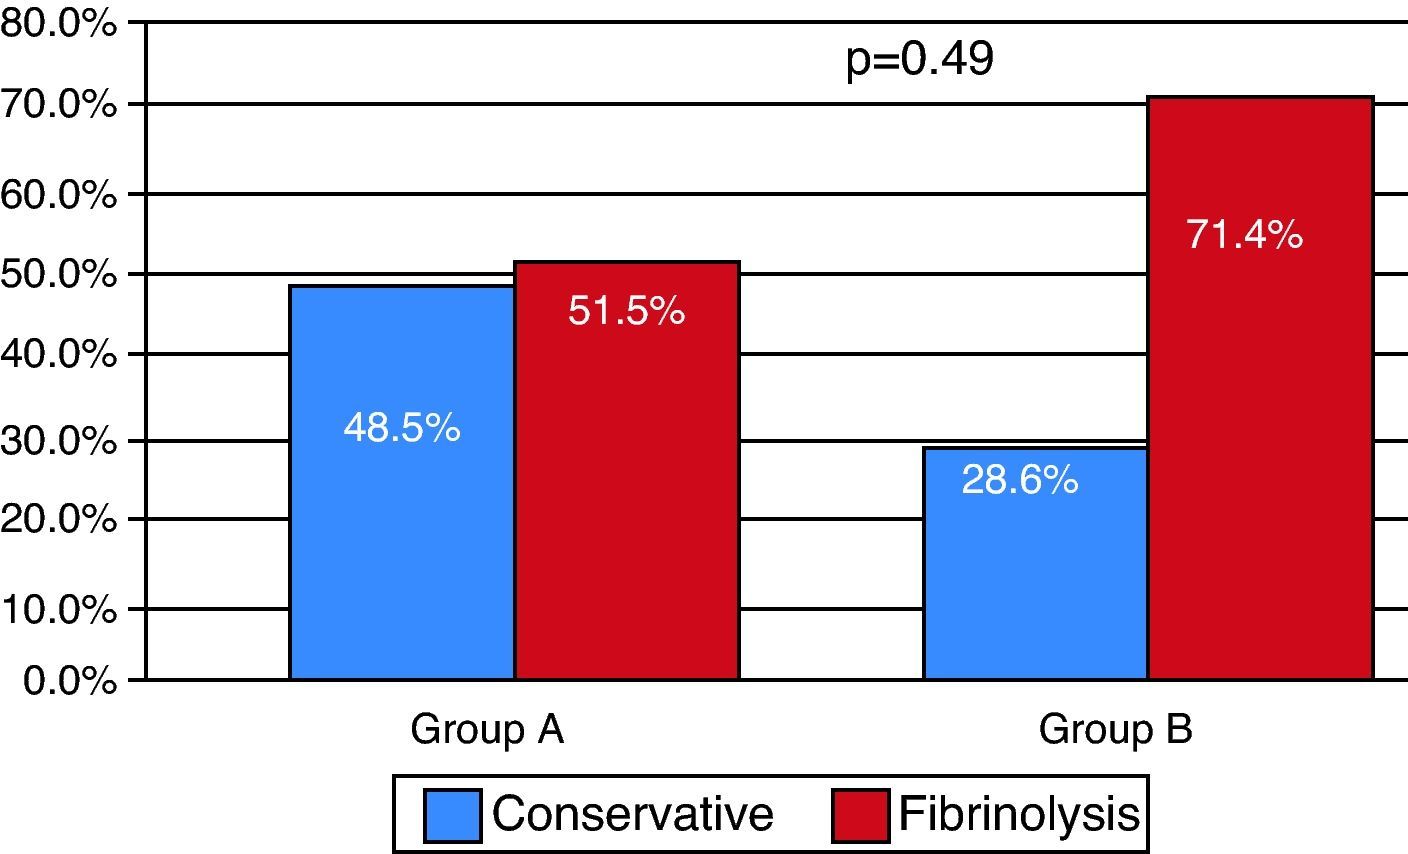
There are several reasons to calculate a clot burden score using MDCT. Firstly, the technique is an accurate method of diagnosing PE and determining an obstruction index provides an objective and reproducible score that is useful for interdisciplinary communication between clinicians and radiologists. Secondly, determination of the degree of vascular obstruction helps in stratification of patient risk, identifying those who would benefit from more aggressive treatment. Thirdly, the clot burden score enables the effects of treatment to be monitored non-invasively by subsequent imaging studies.12
There are various systems described in the literature to assess the pulmonary tree and calculate clot burden scores.2,12,14,16,17 Our study used the Qanadli score, as it was considered the easiest to calculate in imaging terms since the weighting system makes it more objective, resulting in less interobserver variability (Table 1). By way of comparison, we also assessed the imaging studies using the Mastora score14 (Table 8) but abandoned its use as the more complicated scoring system made it harder and more time-consuming to calculate.
Mastora score. Adapted from Mastora et al.14
| No. of arteries assessed | Scoring (by % occlusion) | Maximum score |
| 5 mediastinal, 6 lobar, and 20 segmental (n=31) | 0 points – 0% | 155 |
| 1 point – 1–24% | ||
| 2 points – 25–49% | ||
| 3 points – 50–74% | ||
| 4 points – 75–99% | ||
| 5 points – 100% |
Qanadli et al.12 did not establish a linear relationship between their index of arterial obstruction and other parameters of RVD (clinical and diagnostic exam results) that would corroborate the results obtained, nor has any other published study.
Nevertheless, the results from our registry suggest a strong association between QS and clinical, laboratory, ECG, echocardiographic and CT angiography parameters, each of which have been shown to be strongly predictive of RVD, giving the score high sensitivity and specificity for intermediate/high-risk PE (Figure 1).
Clot burden and clinical characteristics at admissionOur registry showed mean obstruction of 46.15% (mean QS 18.46 points), higher than reported by Wu et al.13 and Qanadli et al.12, which can be explained by the clinical characteristics of the study population that included only intermediate or high-risk patients.
The groups were similar in terms of age, with a predominance of women in both groups. Although there were no significant differences in risk factors, there was a strong association between syncope/lipothymia and higher QS (p=0.017) related to the impact of clot burden on pulmonary pressure and RV function. Clinical scores (Geneva and Wells) were slightly higher in group B, as was the shock index (p=0.006), reflecting greater morbidity in those with QS>18 (Table 5).
Clot burden and electrocardiogramA variety of ECG alterations have been associated with PE severity. The ECG score developed by Daniel et al.15 (Table 2) increases with severity of pulmonary hypertension due to PE, identifying patients with greater perfusion defects.
ECG analysis revealed higher mean HR and a slightly higher percentage of RBBB in group B. However, the most significant differences were found in percentage of T-wave inversion in V1–V3 and S1Q3T3 pattern (p=0.034) and in mean modified ECG score (p=0.009), with a higher prevalence of these dynamic changes in group B, showing a linear correlation between pulmonary clot burden and RV alterations on surface ECG (Table 6).
Clot burden and laboratory valuesThe results obtained in our study are evidence of the relationship between clot burden and independent laboratory predictors of PE severity, demonstrating that QS reflects the interactions between different organs. QS>18 was associated with lower creatinine clearance by the MDRD formula (p=0.02) and PO2/FiO2 ratio and higher peak troponin I (Table 6).
Various studies have claimed that the association between troponin I levels and severity of RVD in PE has a significant impact on risk and prognosis.4,18,19 ROC analysis of our results showed that QS had a greater AUC than troponin I for RVD (Figure 1), while univariate analysis revealed the highest OR for this score (Table 7), reflecting its high value for risk stratification in PE.
Clot burden and imaging studiesEchocardiographic studies showed that group B had slightly higher PASP on admission to the ICU, but without statistical significance (Table 6) (a finding also reported by Qanadli et al. and Miller et al., 12,16). In PE patients, obstruction of the pulmonary vascular tree is the main factor in increased pulmonary vascular resistance, resulting in pulmonary hypertension. However, the hemodynamic profile may depend on whether there is pre-existing pulmonary disease.12 Better correlation between mean pulmonary artery pressure and the severity of obstruction has been reported in selected patients without underlying pulmonary disease, compared with unselected patients,20 as was the case in our study. The other parameters of RVD were not included in the results due to interobserver variability and the fact that data were not available for all patients.
On CT angiography, there was a linear correlation between QS and RVD parameters (RV, superior VC, AV and CS diameters, RV/LV and PA/Ao ratios, and percentage of IVS bowing and reflux of contrast into the inferior VC); the value of clot burden as assessed by QS in indicating multiple parameters of RVD has not been described previously in the literature.
ROC curve analysis determined a cut-off of 45% pulmonary vascular obstruction for the presence of signs of RVD (with significant sensitivity and specificity), which is midway between that obtained by Qanadli et al. (40%)12 and that reported by Mastora et al. (49%).14
Univariate analysis identified the following independent factors for RVD: syncope at admission, tachypnea, S1Q3T3 pattern, ECG score >5 points, troponin I >0.10ng/ml, QS>18 points, CS diameter >10mm, IVS bowing and reflux of contrast into the inferior VC; QS showed the highest OR (Table 7).
Clot burden and mortalityIn-hospital mortality was 4.9%, with no difference between the groups.
Although previous studies have reported a weak correlation between clot burden scores and short-term mortality in patients with PE, to our knowledge there are no studies in the literature assessing the association between clot burden at admission and long-term outcomes (12-month mortality).1
Two small retrospective studies have suggested a correlation between angiographic clot burden and short-term mortality. Wu et al.13 reported that patients with a pulmonary obstruction index of more than 60% had higher mortality, and Van der Meer et al.3 found a relationship between QS and mortality, which was not borne out by our results.
LimitationsOur study has certain limitations. Firstly, it was of a selected population with intermediate or high-risk PE who would inevitably have high clot burdens (mean QS 18.46), and no comparison was made with a low-risk population.
Secondly, the presence of existing structural heart disease or pulmonary disease was not analyzed, which could have affected the pulmonary pressures and cardiac chamber dimensions obtained on CT angiography.
Thirdly, the MDCT images were reviewed by two radiologists, with no assessment of the degree of interobserver agreement, and thus the results are subject to variability.
ConclusionsOur study showed that assessment of pulmonary clot burden using an objective and reproducible score has considerable clinical and imaging impact, enabling accurate risk stratification and selection of patients for more aggressive treatment. Based on our results, a QS cut-off of 18 points was established, which was shown to be a strong independent predictor of RVD in PE, correlating linearly with different variables associated with higher morbidity and mortality.
It should be stressed that the data presented in this study could not have been obtained without cooperation between radiologists and clinicians, enabling rationalization of time and resources in managing a disease with high morbidity and mortality.
Conflict of interestThe authors have no conflicts of interest to declare.
Please cite this article as: Rodrigues B. O valor da carga embólica na avaliação de disfunção ventricular direita no tromboembolismo pulmonar agudo: quantificando a causae clarificando as consequências. Rev Port Cardiol 2012. http://dx.doi.org/10.1016/j.repc.2012.02.020.
