The aim of this study was to assess the impact of a conservative strategy in non-ST-segment elevation myocardial infarction in patients in the Portuguese Registry of Acute Coronary Syndromes.
MethodsThe 3780 patients included in the study over a three-year period were divided into three groups: group 1, patients treated by a conservative strategy during hospitalization; group 2, patients who underwent coronary angiography without percutaneous coronary intervention (PCI); and group 3, patients who underwent PCI. Clinical and procedural data and in-hospital complications were compared. The primary endpoint was defined as in-hospital or one-year mortality and the secondary endpoint as the presence of at least one of the following in-hospital complications: major bleeding according to the GUSTO criteria, need for blood transfusion, invasive ventilation, heart failure or reinfarction.
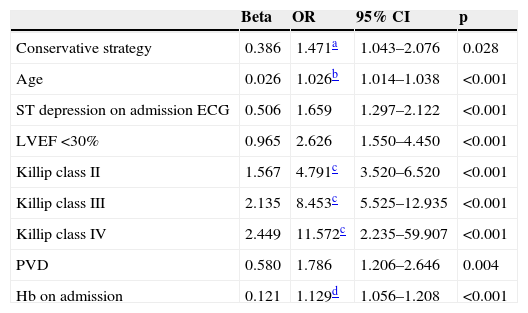
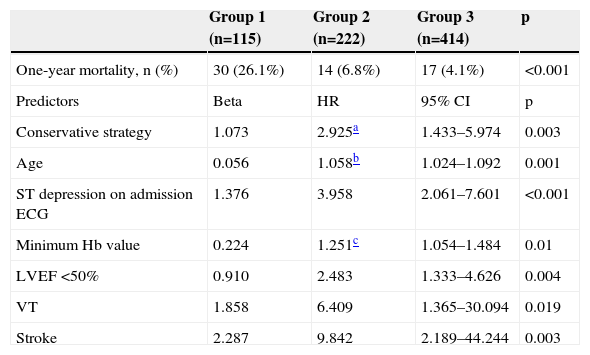
ResultsOf the patients analyzed, 16.5% were treated by a conservative strategy. Patients in this group were older, more often women, and had more high-risk factors. A conservative strategy was associated with a higher rate of the primary endpoint – in-hospital mortality (10.6% vs. 1.1% vs. 0.6% in groups 1, 2 and 3, respectively, p<0.001, odds ratio (OR) 6.974, 95% confidence interval [CI]: 2.775–17.527) and one-year mortality (26.1% vs. 6.8% vs. 4.1%, p<0.001, hazard ratio (HR) 2.925, 95% CI: 1.433–5.974) – and of the secondary endpoint – 37.2% vs. 18.9% vs. 14.6%, p<0.001; OR 1.471 95% CI: 1.043–2.076.
ConclusionsIn this patient population, a conservative strategy is an independent predictor of in-hospital mortality, in-hospital complications and one-year mortality.
Avaliar o impacto da estratégia conservadora no enfarte agudo do miocárdio sem supradesnivelamento de ST nos doentes do Registo Nacional de Síndromes Coronárias Agudas.
MétodosDos 3780 doentes incluídos no estudo durante um período de três anos, foram formados três grupos: no grupo 1 foram incluídos os submetidos a estratégia conservadora; no grupo 2 foram incluídos os doentes submetidos a coronariografia sem realização de intervenção coronária percutânea e no grupo 3 os que foram submetidos a intervenção coronária percutânea. Compararam-se as características clínicas e de procedimento e as complicações ocorridas no internamento. O endpoint primário foi definido pela mortalidade intra-hospitalar ou morte ao fim de um ano e o endpoint secundário foi definido pela ocorrência de pelo menos uma das seguintes complicações: hemorragia grave definida pelos critérios de GUSTO, necessidade de transfusão, ventilação invasiva, insuficiência cardíaca e reenfarte.
ResultadosDos doentes analisados, 16,5% foram submetidos a estratégia conservadora; estes eram mais velhos, mais frequentemente mulheres e apresentavam mais fatores de alto risco. A estratégia conservadora associou-se a maior atingimento do endpoint primário – mortalidade intra-hospitalar (10,6% versus 1,1% versus 0,6%, p < 0,001, odds-ratio [OR] de 6,974, intervalo de confiança a 95% [IC95%]: 2.775-17.527), mortalidade ao ano (26,1% versus 6,8% versus 4,1%, p < 0,001, hazard-ratio (HR) 2.925, IC95%: 1.433-5.974) – e do endpoint secundário – 37,2% versus 18,9% versus 14,6%, p < 0,001; OR 1.471 IC95%: 1.043-2.076.
ConclusõesNeste conjunto de doentes, a estratégia conservadora é um preditor independente de mortalidade intra-hospitalar, complicações intra-hospitalares e da mortalidade ao ano.
Revascularization in non-ST-segment elevation myocardial infarction (NSTEMI) relieves symptoms, reduces hospital stay and improves prognosis.1–3 However, the indications for and timing of revascularization depend on various factors, some inherent to the patient (such as age, gender and comorbidities) and others external, including the availability of resources. Consequently, although an invasive approach combined with optimal medical therapy is associated with improved survival at all ages,4 a non-invasive approach is more often adopted in older patients, in whom the presence of comorbidities is seen as a limitation to coronary angiography.1,5 With regard to gender differences, various studies have shown that women undergo coronary angiography less often than men,6 although the benefits are similar for both sexes.7 Data from the Global Registry of Acute Coronary Events (GRACE), the largest multinational registry of patients with acute coronary syndrome (ACS), show an inverse relation between the likelihood of a patient undergoing percutaneous coronary intervention (PCI) and the patient's risk.8 This demonstrates the complexity surrounding the factors that determine the best therapeutic approach to adopt; the decision whether to perform coronary angiography depends on available resources and the hospital protocols and, most importantly, individual clinical judgment.
The aim of this study was to assess the impact of a conservative strategy in NSTEMI during hospitalization and in the medium term.
MethodsA population of 3799 patients with NSTEMI was selected from the databases of the Portuguese Registry on Acute Coronary Syndromes (ProACS) and the Portuguese Society of Cardiology between 1 October 2010 and 1 October 2013. NSTEMI was defined as elevated cardiac biomarkers (troponin or the MB isoenzyme of creatine kinase [CK-MB]) with symptoms compatible with myocardial ischemia but without persistent ST-segment elevation (<30 min) on the admission 12-lead ECG. Patients for whom information was available on coronary angiography and/or PCI were included (n=3780). A conservative strategy was defined as absence of coronary angiography and an invasive strategy as coronary angiography during hospitalization, irrespective of whether this was followed by PCI. Coronary lesions were defined as non-significant with <50% stenosis, significant with ≥50% and <100% stenosis, and occluded with 100% stenosis. Treated vessels were defined using the ProACS criteria (residual stenosis <30% and TIMI 3 flow following angioplasty). The patients were divided into three groups: group 1, patients treated by a conservative strategy during hospitalization (n=623); group 2, patients who underwent coronary angiography without PCI (n=1229); and group 3, patients who underwent PCI (n=1928). The groups were compared in terms of clinical and procedural data and the following in-hospital complications: (1) reinfarction, defined in the ProACS as recurrence of chest pain suggestive of ischemia after resolution of the initial episode of pain, lasting >20 min and accompanied by electrocardiographic alterations and new elevation of cardiac biomarkers above previous levels (CK-MB twice the reference value or >50% higher than the previous value, or troponin I or T >20% above the previous value); (2) heart failure (HF); (3) mechanical complications, defined as rupture of the free wall or the ventricular septum or severe acute mitral regurgitation due to papillary muscle involvement; (4) new-onset paroxysmal or persistent atrial fibrillation (AF); (5) second-degree atrioventricular block (Mobitz 2) or higher; (6) sustained ventricular tachycardia (VT), defined as the presence during hospitalization of monomorphic or polymorphic VT lasting >30 s or associated with hemodynamic instability; (7) resuscitated cardiac arrest from any cause during hospitalization; (8) ischemic or hemorrhagic stroke; and (9) major bleeding, defined according to the GUSTO classification9 as intracerebral bleeding or bleeding with hemodynamic compromise requiring treatment or need for transfusion of red cell concentrates. Patients’ destination after discharge was recorded and they were followed for up to a year.
The primary endpoint was defined as in-hospital or one-year mortality from any cause. The secondary endpoint was defined as the presence of at least one of the following in-hospital complications: major bleeding or need for transfusion of red cell concentrates, need for invasive ventilation (specifying whether an endotracheal tube, laryngeal mask or tracheostomy was used), HF or reinfarction.
Statistical analysisCategorical variables were expressed as absolute and relative frequencies, and differences in proportions between the groups were analyzed using the asymptotic chi-square test and the chi-square test with Monte Carlo simulation when the assumptions for the former were not satisfied. Continuous variables were expressed as means, standard deviation, quartiles, minimum and maximum. ANOVA was used to compare the means of the groups; when the assumptions for this were not satisfied, the Kruskal-Wallis test was used, the normality and equality of variances of which were tested by the Kolmogorov-Smirnov and Levene tests, respectively. Two logistic regression models were constructed, one for in-hospital mortality and one for in-hospital complications, in order to determine whether a conservative strategy was a predictor of worse prognosis. The forward stepwise method was used to select variables for inclusion in the final model, with p>0.10 for exit and p<0.05 for entry. The effect of the variable used to define the three groups on the occurrence of each of the endpoints was adjusted by the inclusion of the following potential confounders: gender, age, body mass index (BMI), medical history and cardiovascular risk factors, data from physical examination on admission, laboratory parameters, previous medication, medication during hospitalization, and left ventricular ejection fraction (LVEF); in-hospital complications were also considered in the analysis of in-hospital mortality. The goodness of fit of the models was tested using the Hosmer-Lemeshow test and the C-statistic was used to assess their discriminatory power. The risk of occurrence of each endpoint associated with each predictor was estimated using odds ratios (OR) and 95% confidence intervals (CI). The effect of the therapeutic strategy on one-year mortality was assessed by a Cox regression model, also using the forward stepwise method, with p>0.10 for exit and p<0.05 for entry, and the same potential confounders as for in-hospital mortality, together with medication at discharge. The risk of one-year mortality associated with each predictor was estimated using hazard ratios (HR) and 95% CI. Finally, patients’ risk was stratified according to the following categories of the GRACE score2: low (≤108), intermediate (109–140) and high (>140).
IBM® SPSS® Statistics (version 19.0.0.2) was used for the statistical analysis. The level of significance used was 5%.
ResultsPopulation characteristicsThe distribution of the population by group was as follows: group 1 – 16.5%; group 2 – 32.5%; group 3 – 51.0%. The general population characteristics are shown in Table 1. There were more males in all groups, particularly in the invasive strategy groups. Patients in group 1 (the conservative strategy group) were older and had more cardiovascular risk factors, documented coronary artery disease (CAD) and myocardial revascularization procedures, peripheral vascular disease and comorbidities including HF, chronic obstructive pulmonary disease, dementia, cerebrovascular disease and chronic kidney disease (CKD) (defined in the ProACS criteria as serum creatinine >2.0 mg/dl prior to hospitalization, need for dialysis or a history of renal transplantation). With regard to laboratory parameters, higher levels of creatinine on admission and peak creatinine (in agreement with the higher prevalence of CKD), brain natriuretic peptide (BNP) and N-terminal pro-brain natriuretic peptide (NT-proBNP) and lower hemoglobin levels were seen in group 1. On admission, patients in group 1 had a higher prevalence of Killip class >I, AF and ST-segment depression (defined as horizontal or downsloping ST-segment depression of >0.5 mm [0.05 mV] in two or more contiguous leads). A significantly higher number of group 1 patients were classified as high risk on the GRACE score, while those in group 3 had the highest proportion of low and intermediate risk and the lowest proportion of high-risk patients.
Population characteristics, clinical and laboratory data and GRACE score.
| Group 1(n=623) | Group 2(n=1229) | Group 3(n=1928) | p | |
|---|---|---|---|---|
| Age, years (mean ± SD) | 76.3±12.6 | 66.6±12.3 | 64.9±12.8 | <0.001 |
| Male, n (%) | 355 (57%) | 844 (68.7%) | 1448 (75.1%) | <0.001 |
| BMI, kg/m2 | ||||
| Median | 25.8 | 27.2 | 27.3 | <0.001 |
| 25th percentile | 23.6 | 24.6 | 24.8 | |
| 75th percentile | 28.9 | 29.7 | 30.2 | |
| Clinical data on admission | ||||
| Cardiac arrest, n (%) | 2 (0.3%) | 3 (0.2%) | 2 (0.1%) | <0.001 |
| HR, bpm (mean ± SD) | 83±23 | 79±21 | 77±18 | <0.001 |
| SBP, mmHg (mean ± SD) | 139±30 | 141±28 | 144±28 | <0.001 |
| DBP, mmHg (mean ± SD) | 75±17 | 80±16 | 81±17 | <0.001 |
| Killip class I, n (%) | 401 (64.6%) | 1006 (82.1%) | 1683 (87.6%) | <0.001 |
| Killip class II, n (%) | 132 (21.3%) | 140 (11.4%) | 158 (8.2%) | <0.001 |
| Killip class III, n (%) | 77 (12.4%) | 75 (6.1%) | 69 (3.6%) | <0.001 |
| Killip class IV, n (%) | 11 (1.8%) | 4 (0.3%) | 11 (0.6%) | <0.001 |
| Admission ECG | ||||
| Sinus rhythm, n (%) | 510 (82.1%) | 1085 (88.4%) | 1793 (93.0%) | <0.001 |
| AF, n (%) | 101 (16.3%) | 123 (10.0%) | 113 (5.9%) | <0.001 |
| ST depression, n (%) | 269 (43.6%) | 471 (38.6%) | 635 (33.2%) | <0.001 |
| CV risk factors | ||||
| Hypertension, n (%) | 504 (81.8%) | 915 (75.2%) | 1365 (72.2%) | <0.001 |
| Diabetes, n (%) | 232 (38.0%) | 406 (33.4%) | 600 (31.9%) | 0.022 |
| Dyslipidemia, n (%) | 339 (57.9%) | 736 (63.6%) | 1112 (61.7%) | 0.071 |
| Smoking, n (%) | 59 (9.7%) | 259 (21.4%) | 533 (27.8%) | <0.001 |
| Family history of CAD, n (%) | 20 (4.0%) | 70 (6.9%) | 130 (7.8%) | 0.012 |
| Previous MI, n (%) | 257 (41.7%) | 301 (24.7%) | 433 (22.6%) | <0.001 |
| Previous PCI, n (%) | 118 (19.2%) | 165 (13.5%) | 343 (17.8%) | 0.001 |
| Previous CABG, n (%) | 74 (12.0%) | 74 (6.0%) | 91 (4.7%) | <0.001 |
| PVD, n (%) | 86 (14.3%) | 85 (7.0%) | 90 (4.7%) | <0.001 |
| Comorbidities | ||||
| HF, n (%) | 153 (24.9%) | 105 (8.6%) | 95 (4.9%) | <0.001 |
| COPD, n (%) | 52 (8.8%) | 92 (7.5%) | 110 (5.7%) | 0.017 |
| Dementia, n (%) | 42 (7.2%) | 14 (1.2%) | 14 (0.7%) | <0.001 |
| Previous stroke/TIA, n (%) | 101 (16.4%) | 141 (11.5%) | 128 (6.7%) | <0.001 |
| CKD, n (%) | 119 (20.3%) | 85 (7.0%) | 110 (5.8%) | <0.001 |
| Laboratory data | ||||
| Admission creatinine, mg/dl | ||||
| Median | 1.1 | 0.9 | 0.9 | <0.001 |
| 25th percentile | 0.9 | 0.8 | 0.8 | |
| 75th percentile | 1.6 | 1.2 | 1.1 | |
| Peak creatinine, mg/dl | ||||
| Median | 1.4 | 1.0 | 1.0 | <0.001 |
| 25th percentile | 1.0 | 0.9 | 0.9 | |
| 75th percentile | 2.1 | 1.4 | 1.3 | |
| Blood glucose, mg/dl | ||||
| Median | 138 | 126 | 122 | <0.001 |
| 25th percentile | 109 | 104 | 102 | |
| 75th percentile | 194 | 171 | 167 | |
| Admission Hb, g/dl (mean ± SD) | 12.5±2.1 | 13.5±1.9 | 13.9±1.8 | <0.001 |
| Minimum Hb, g/dl (mean ± SD) | 11.5±2.1 | 12.4±2.0 | 12.6±1.9 | <0.001 |
| Platelets, 106/l | ||||
| Median | 203 | 206 | 209 | 0.257 |
| 25th percentile | 169 | 168 | 175 | |
| 75th percentile | 248 | 250 | 248 | |
| BNP, pg/ml | ||||
| Median | 475.0 | 240.0 | 133.0 | <0.001 |
| 25th percentile | 199.0 | 105.0 | 64.0 | |
| 75th percentile | 1047.0 | 523.0 | 295.0 | |
| NT-proBNP, pg/ml | ||||
| Median | 5375.0 | 1027.5 | 833.0 | <0.001 |
| 25th percentile | 1970.0 | 348.0 | 280.0 | |
| 75th percentile | 12800.0 | 3216.5 | 2680.0 | |
| GRACE score risk category | ||||
| Low, n (%) | 47 (8.3%) | 248 (22.9%) | 523 (30.1%) | <0.001 |
| Intermediate, n (%) | 129 (22.7%) | 360 (33.2%) | 627 (36.1%) | |
| High, n (%) | 393 (69.1%) | 477 (44.0%) | 587 (33.8%) | |
AF: atrial fibrillation; BMI: body mass index; BNP: brain natriuretic peptide; bpm: beats per min; CABG: coronary artery bypass grafting; CAD: coronary artery disease; CKD: chronic kidney disease; COPD: chronic obstructive pulmonary disease; CV: cardiovascular; DBP: diastolic blood pressure; Hb: hemoglobin; HF: heart failure; HR: heart rate; MI: myocardial infarction; NT-proBNP: N-terminal pro-brain natriuretic peptide; PCI: percutaneous coronary intervention; PVD: peripheral vascular disease; SBP: systolic blood pressure; SD: standard deviation; TIA: transient ischemic attack.
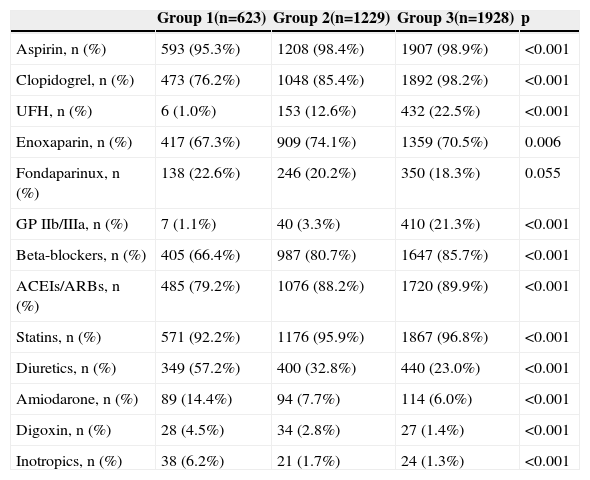
Table 2 shows cardiovascular medication during hospitalization. Group 1 were less often prescribed therapies known to reduce mortality and morbidity in ACS patients, particularly antiplatelets, renin-angiotensin-aldosterone system inhibitors, beta-blockers and statins, while they more often received diuretics and inotropics, probably because of their higher prevalence of HF.
Medication during hospitalization.
| Group 1(n=623) | Group 2(n=1229) | Group 3(n=1928) | p | |
|---|---|---|---|---|
| Aspirin, n (%) | 593 (95.3%) | 1208 (98.4%) | 1907 (98.9%) | <0.001 |
| Clopidogrel, n (%) | 473 (76.2%) | 1048 (85.4%) | 1892 (98.2%) | <0.001 |
| UFH, n (%) | 6 (1.0%) | 153 (12.6%) | 432 (22.5%) | <0.001 |
| Enoxaparin, n (%) | 417 (67.3%) | 909 (74.1%) | 1359 (70.5%) | 0.006 |
| Fondaparinux, n (%) | 138 (22.6%) | 246 (20.2%) | 350 (18.3%) | 0.055 |
| GP IIb/IIIa, n (%) | 7 (1.1%) | 40 (3.3%) | 410 (21.3%) | <0.001 |
| Beta-blockers, n (%) | 405 (66.4%) | 987 (80.7%) | 1647 (85.7%) | <0.001 |
| ACEIs/ARBs, n (%) | 485 (79.2%) | 1076 (88.2%) | 1720 (89.9%) | <0.001 |
| Statins, n (%) | 571 (92.2%) | 1176 (95.9%) | 1867 (96.8%) | <0.001 |
| Diuretics, n (%) | 349 (57.2%) | 400 (32.8%) | 440 (23.0%) | <0.001 |
| Amiodarone, n (%) | 89 (14.4%) | 94 (7.7%) | 114 (6.0%) | <0.001 |
| Digoxin, n (%) | 28 (4.5%) | 34 (2.8%) | 27 (1.4%) | <0.001 |
| Inotropics, n (%) | 38 (6.2%) | 21 (1.7%) | 24 (1.3%) | <0.001 |
ACEIs: angiotensin-converting enzyme inhibitors; ARBs: angiotensin receptor blockers; GP IIb/IIIa: glycoprotein IIb/IIIa inhibitors; UFH: unfractionated heparin.
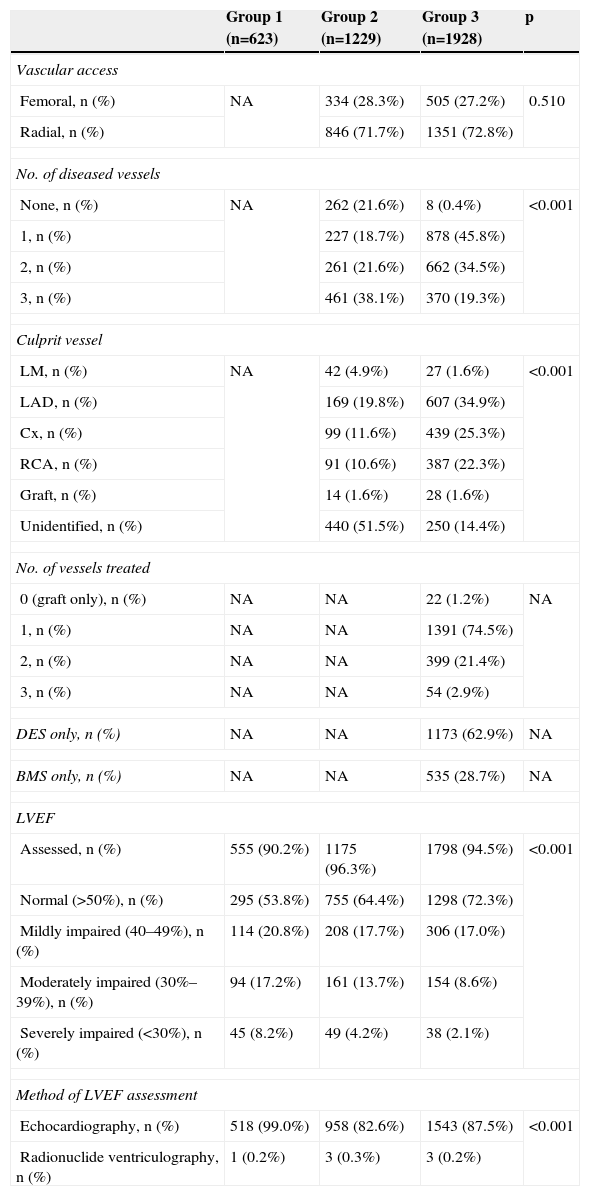
Table 3 shows procedural data for the study population. Radial access was used more often in both groups treated by an invasive strategy. Left main and three-vessel disease were more common in group 2, while single- and two-vessel disease were more prevalent in group 3. There was also a high prevalence of cases in which the culprit vessel was not identified in group 2. PCI was performed mainly in patients with single-vessel disease.
Procedural data and assessment of left ventricular function.
| Group 1 (n=623) | Group 2 (n=1229) | Group 3 (n=1928) | p | |
|---|---|---|---|---|
| Vascular access | ||||
| Femoral, n (%) | NA | 334 (28.3%) | 505 (27.2%) | 0.510 |
| Radial, n (%) | 846 (71.7%) | 1351 (72.8%) | ||
| No. of diseased vessels | ||||
| None, n (%) | NA | 262 (21.6%) | 8 (0.4%) | <0.001 |
| 1, n (%) | 227 (18.7%) | 878 (45.8%) | ||
| 2, n (%) | 261 (21.6%) | 662 (34.5%) | ||
| 3, n (%) | 461 (38.1%) | 370 (19.3%) | ||
| Culprit vessel | ||||
| LM, n (%) | NA | 42 (4.9%) | 27 (1.6%) | <0.001 |
| LAD, n (%) | 169 (19.8%) | 607 (34.9%) | ||
| Cx, n (%) | 99 (11.6%) | 439 (25.3%) | ||
| RCA, n (%) | 91 (10.6%) | 387 (22.3%) | ||
| Graft, n (%) | 14 (1.6%) | 28 (1.6%) | ||
| Unidentified, n (%) | 440 (51.5%) | 250 (14.4%) | ||
| No. of vessels treated | ||||
| 0 (graft only), n (%) | NA | NA | 22 (1.2%) | NA |
| 1, n (%) | NA | NA | 1391 (74.5%) | |
| 2, n (%) | NA | NA | 399 (21.4%) | |
| 3, n (%) | NA | NA | 54 (2.9%) | |
| DES only, n (%) | NA | NA | 1173 (62.9%) | NA |
| BMS only, n (%) | NA | NA | 535 (28.7%) | NA |
| LVEF | ||||
| Assessed, n (%) | 555 (90.2%) | 1175 (96.3%) | 1798 (94.5%) | <0.001 |
| Normal (>50%), n (%) | 295 (53.8%) | 755 (64.4%) | 1298 (72.3%) | |
| Mildly impaired (40–49%), n (%) | 114 (20.8%) | 208 (17.7%) | 306 (17.0%) | |
| Moderately impaired (30%–39%), n (%) | 94 (17.2%) | 161 (13.7%) | 154 (8.6%) | |
| Severely impaired (<30%), n (%) | 45 (8.2%) | 49 (4.2%) | 38 (2.1%) | |
| Method of LVEF assessment | ||||
| Echocardiography, n (%) | 518 (99.0%) | 958 (82.6%) | 1543 (87.5%) | <0.001 |
| Radionuclide ventriculography, n (%) | 1 (0.2%) | 3 (0.3%) | 3 (0.2%) | |
BMS: bare-metal stent; Cx: circumflex; DES: drug-eluting stent; LAD: left anterior descending; LM: left main; LVEF: left ventricular ejection fraction; NA: not applicable; RCA: right coronary artery.
It is worth noting the significant differences in assessment of LVEF (less often performed in group 1) and in LVEF values (lower in group 1 and higher in group 3).
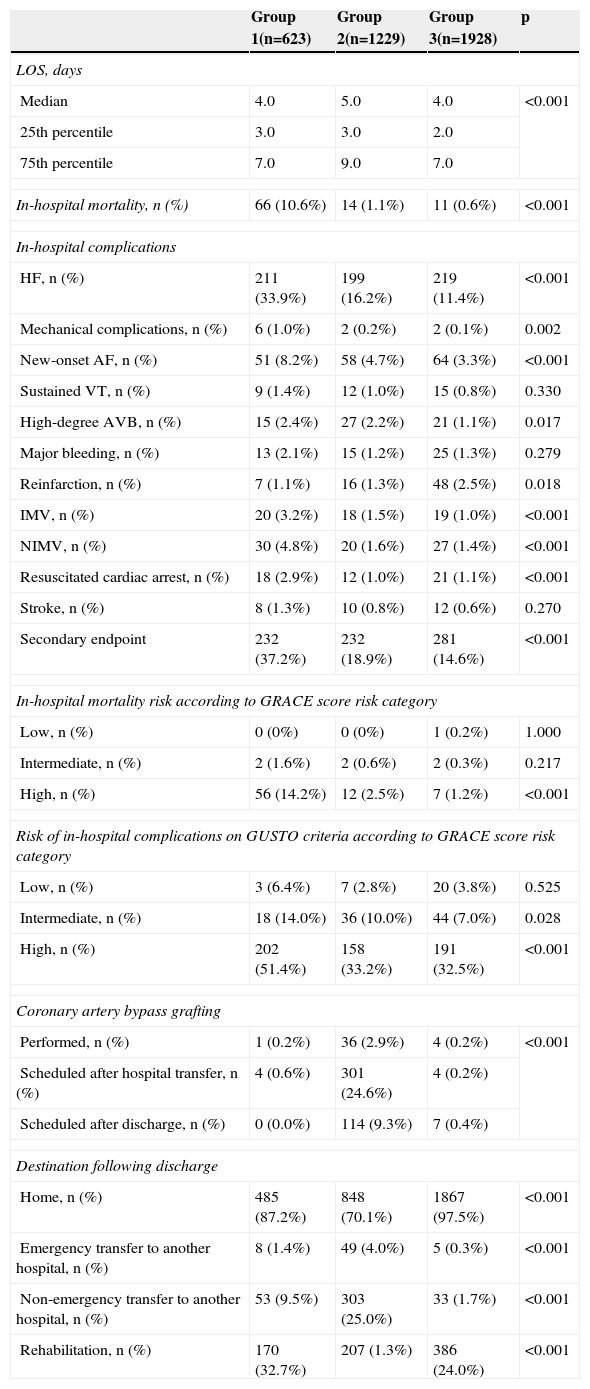
In-hospital complications and mortality and destination following dischargeTable 4 presents length of hospital stay, in-hospital mortality and complications, and destination following discharge.
Length of hospital stay, in-hospital mortality and complications, and destination following discharge.
| Group 1(n=623) | Group 2(n=1229) | Group 3(n=1928) | p | |
|---|---|---|---|---|
| LOS, days | ||||
| Median | 4.0 | 5.0 | 4.0 | <0.001 |
| 25th percentile | 3.0 | 3.0 | 2.0 | |
| 75th percentile | 7.0 | 9.0 | 7.0 | |
| In-hospital mortality, n (%) | 66 (10.6%) | 14 (1.1%) | 11 (0.6%) | <0.001 |
| In-hospital complications | ||||
| HF, n (%) | 211 (33.9%) | 199 (16.2%) | 219 (11.4%) | <0.001 |
| Mechanical complications, n (%) | 6 (1.0%) | 2 (0.2%) | 2 (0.1%) | 0.002 |
| New-onset AF, n (%) | 51 (8.2%) | 58 (4.7%) | 64 (3.3%) | <0.001 |
| Sustained VT, n (%) | 9 (1.4%) | 12 (1.0%) | 15 (0.8%) | 0.330 |
| High-degree AVB, n (%) | 15 (2.4%) | 27 (2.2%) | 21 (1.1%) | 0.017 |
| Major bleeding, n (%) | 13 (2.1%) | 15 (1.2%) | 25 (1.3%) | 0.279 |
| Reinfarction, n (%) | 7 (1.1%) | 16 (1.3%) | 48 (2.5%) | 0.018 |
| IMV, n (%) | 20 (3.2%) | 18 (1.5%) | 19 (1.0%) | <0.001 |
| NIMV, n (%) | 30 (4.8%) | 20 (1.6%) | 27 (1.4%) | <0.001 |
| Resuscitated cardiac arrest, n (%) | 18 (2.9%) | 12 (1.0%) | 21 (1.1%) | <0.001 |
| Stroke, n (%) | 8 (1.3%) | 10 (0.8%) | 12 (0.6%) | 0.270 |
| Secondary endpoint | 232 (37.2%) | 232 (18.9%) | 281 (14.6%) | <0.001 |
| In-hospital mortality risk according to GRACE score risk category | ||||
| Low, n (%) | 0 (0%) | 0 (0%) | 1 (0.2%) | 1.000 |
| Intermediate, n (%) | 2 (1.6%) | 2 (0.6%) | 2 (0.3%) | 0.217 |
| High, n (%) | 56 (14.2%) | 12 (2.5%) | 7 (1.2%) | <0.001 |
| Risk of in-hospital complications on GUSTO criteria according to GRACE score risk category | ||||
| Low, n (%) | 3 (6.4%) | 7 (2.8%) | 20 (3.8%) | 0.525 |
| Intermediate, n (%) | 18 (14.0%) | 36 (10.0%) | 44 (7.0%) | 0.028 |
| High, n (%) | 202 (51.4%) | 158 (33.2%) | 191 (32.5%) | <0.001 |
| Coronary artery bypass grafting | ||||
| Performed, n (%) | 1 (0.2%) | 36 (2.9%) | 4 (0.2%) | <0.001 |
| Scheduled after hospital transfer, n (%) | 4 (0.6%) | 301 (24.6%) | 4 (0.2%) | |
| Scheduled after discharge, n (%) | 0 (0.0%) | 114 (9.3%) | 7 (0.4%) | |
| Destination following discharge | ||||
| Home, n (%) | 485 (87.2%) | 848 (70.1%) | 1867 (97.5%) | <0.001 |
| Emergency transfer to another hospital, n (%) | 8 (1.4%) | 49 (4.0%) | 5 (0.3%) | <0.001 |
| Non-emergency transfer to another hospital, n (%) | 53 (9.5%) | 303 (25.0%) | 33 (1.7%) | <0.001 |
| Rehabilitation, n (%) | 170 (32.7%) | 207 (1.3%) | 386 (24.0%) | <0.001 |
IMV: invasive mechanical ventilation; LOS: length of hospital stay; NIMV: non-invasive mechanical ventilation.
Overall in-hospital mortality was 2.0%, and was significantly higher in group 1, including in those classified in the high-risk GRACE category, which was not seen at other risk levels. The secondary endpoint was also more frequent in group 1 (37.2% vs. 18.9% vs. 14.6%, p<0.001), and in those classified by the GRACE score as intermediate or high risk. Reinfarction was the only complication that was less frequent in group 1.
Coronary artery bypass grafting (CABG) was more frequent in group 2, which is understandable in view of the greater prevalence of left main and three-vessel disease in this group.
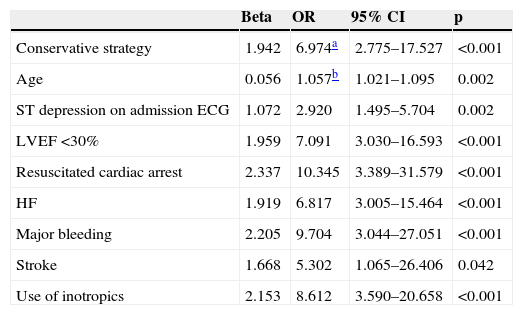
Multivariate analysis identified the predictors of in-hospital mortality and complications included in the secondary endpoint; these are shown in Tables 5 and 6.
Predictors of in-hospital mortality.
| Beta | OR | 95% CI | p | |
|---|---|---|---|---|
| Conservative strategy | 1.942 | 6.974a | 2.775–17.527 | <0.001 |
| Age | 0.056 | 1.057b | 1.021–1.095 | 0.002 |
| ST depression on admission ECG | 1.072 | 2.920 | 1.495–5.704 | 0.002 |
| LVEF <30% | 1.959 | 7.091 | 3.030–16.593 | <0.001 |
| Resuscitated cardiac arrest | 2.337 | 10.345 | 3.389–31.579 | <0.001 |
| HF | 1.919 | 6.817 | 3.005–15.464 | <0.001 |
| Major bleeding | 2.205 | 9.704 | 3.044–27.051 | <0.001 |
| Stroke | 1.668 | 5.302 | 1.065–26.406 | 0.042 |
| Use of inotropics | 2.153 | 8.612 | 3.590–20.658 | <0.001 |
OR values considering patients treated by coronary angiography and percutaneous coronary intervention as the reference group.
OR values for an increase of one year in age. For each increase of five years in age, OR=1.321 (95% CI, 1.111–1.572).
p=0.271 (Hosmer-Lemeshow); area under the receiver operating characteristic curve 0.960 (95% CI, 0.939–0.982); model sensitivity 93.9%; specificity 87.9%.
CI: confidence interval; HF: heart failure; OR: odds ratio.
Predictors of in-hospital complications.
| Beta | OR | 95% CI | p | |
|---|---|---|---|---|
| Conservative strategy | 0.386 | 1.471a | 1.043–2.076 | 0.028 |
| Age | 0.026 | 1.026b | 1.014–1.038 | <0.001 |
| ST depression on admission ECG | 0.506 | 1.659 | 1.297–2.122 | <0.001 |
| LVEF <30% | 0.965 | 2.626 | 1.550–4.450 | <0.001 |
| Killip class II | 1.567 | 4.791c | 3.520–6.520 | <0.001 |
| Killip class III | 2.135 | 8.453c | 5.525–12.935 | <0.001 |
| Killip class IV | 2.449 | 11.572c | 2.235–59.907 | <0.001 |
| PVD | 0.580 | 1.786 | 1.206–2.646 | 0.004 |
| Hb on admission | 0.121 | 1.129d | 1.056–1.208 | <0.001 |
OR values considering patients treated by coronary angiography and percutaneous coronary intervention as the reference group.
OR values for an increase of one year in age. For each increase of five years in age, OR=1.138 (95% CI, 1.072–1.208).
OR values for a reduction of one unit of hemoglobin. For increases of two units of hemoglobin, OR=1.275 (95% CI, 1.115–1.458).
p=0.169 (Hosmer-Lemeshow); area under the receiver operating characteristic curve 0.899 (95% CI, 0.885–0.912); model sensitivity 82.0%; specificity 83.9%.
CI: confidence interval; LVEF: left ventricular ejection fraction; OR: odds ratio; PVD: peripheral vascular disease.
The predictors of in-hospital mortality were a conservative strategy, age, ST-segment depression on admission ECG, severe impairment of LVEF, resuscitated cardiac arrest, congestive HF, major bleeding, stroke, and the use of inotropics. Undergoing coronary angiography without PCI was not a predictor of in-hospital mortality (OR 1.737; 95% CI [0.617–4.891], p=0.296).
The predictors of the secondary endpoint were a conservative strategy, age, ST-segment depression on admission ECG, severe impairment of LVEF, Killip class >I on admission, peripheral vascular disease and admission hemoglobin level. Undergoing coronary angiography without PCI was not a predictor of in-hospital complications (OR 0.933; 95% CI [0.701–1.243], p=0.637).
Patients treated by a conservative strategy were much more frequently referred for cardiac rehabilitation than those treated by the other strategies.
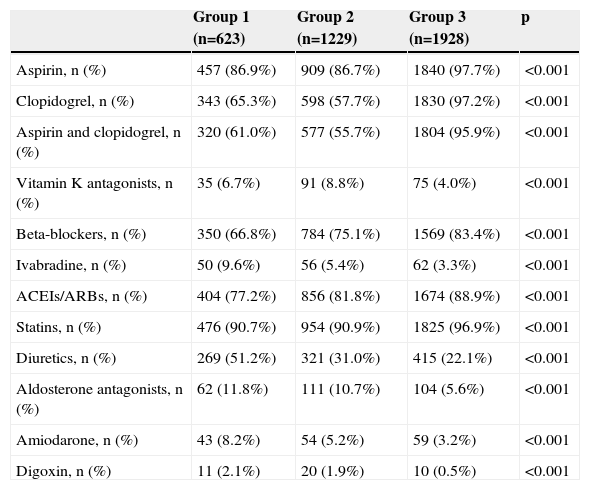
Medication at hospital dischargeTable 7 shows medication prescribed at discharge. In group 1 there was lower use of dual antiplatelet therapy, beta-blockers and angiotensin-converting enzyme inhibitors/angiotensin receptor blockers and higher rates of prescription of loop diuretics, aldosterone antagonists, amiodarone and digoxin (in line with the higher prevalence of HF and AF in this group).
Medication at hospital discharge.
| Group 1 (n=623) | Group 2 (n=1229) | Group 3 (n=1928) | p | |
|---|---|---|---|---|
| Aspirin, n (%) | 457 (86.9%) | 909 (86.7%) | 1840 (97.7%) | <0.001 |
| Clopidogrel, n (%) | 343 (65.3%) | 598 (57.7%) | 1830 (97.2%) | <0.001 |
| Aspirin and clopidogrel, n (%) | 320 (61.0%) | 577 (55.7%) | 1804 (95.9%) | <0.001 |
| Vitamin K antagonists, n (%) | 35 (6.7%) | 91 (8.8%) | 75 (4.0%) | <0.001 |
| Beta-blockers, n (%) | 350 (66.8%) | 784 (75.1%) | 1569 (83.4%) | <0.001 |
| Ivabradine, n (%) | 50 (9.6%) | 56 (5.4%) | 62 (3.3%) | <0.001 |
| ACEIs/ARBs, n (%) | 404 (77.2%) | 856 (81.8%) | 1674 (88.9%) | <0.001 |
| Statins, n (%) | 476 (90.7%) | 954 (90.9%) | 1825 (96.9%) | <0.001 |
| Diuretics, n (%) | 269 (51.2%) | 321 (31.0%) | 415 (22.1%) | <0.001 |
| Aldosterone antagonists, n (%) | 62 (11.8%) | 111 (10.7%) | 104 (5.6%) | <0.001 |
| Amiodarone, n (%) | 43 (8.2%) | 54 (5.2%) | 59 (3.2%) | <0.001 |
| Digoxin, n (%) | 11 (2.1%) | 20 (1.9%) | 10 (0.5%) | <0.001 |
ACEIs: angiotensin-converting enzyme inhibitors; ARBs: angiotensin receptor blockers.
Table 8 shows that one-year mortality was significantly higher in group 1. The Cox regression model included 564 patients, of whom 48 (8.5%) had died by the end of one year. Predictors of one-year mortality were a conservative strategy, age, ST-segment depression on admission ECG, LVEF <50%, minimum hemoglobin level, and VT or stroke during hospitalization. Undergoing coronary angiography without PCI was not a predictor of one-year mortality (HR 1.267; 95% CI [0.573–2.8], p=0.559). Figure 1 shows the Cox survival curves for mortality in the three groups over the one-year follow-up.
One-year mortality and its predictors.
| Group 1 (n=115) | Group 2 (n=222) | Group 3 (n=414) | p | |
|---|---|---|---|---|
| One-year mortality, n (%) | 30 (26.1%) | 14 (6.8%) | 17 (4.1%) | <0.001 |
| Predictors | Beta | HR | 95% CI | p |
| Conservative strategy | 1.073 | 2.925a | 1.433–5.974 | 0.003 |
| Age | 0.056 | 1.058b | 1.024–1.092 | 0.001 |
| ST depression on admission ECG | 1.376 | 3.958 | 2.061–7.601 | <0.001 |
| Minimum Hb value | 0.224 | 1.251c | 1.054–1.484 | 0.01 |
| LVEF <50% | 0.910 | 2.483 | 1.333–4.626 | 0.004 |
| VT | 1.858 | 6.409 | 1.365–30.094 | 0.019 |
| Stroke | 2.287 | 9.842 | 2.189–44.244 | 0.003 |
In Table 9 it can be seen that, stratified by GRACE score, one-year mortality was significantly higher in the intermediate and high risk categories, while Figure 2 shows the Kaplan-Meier survival curves for mortality in the three risk categories over this period.
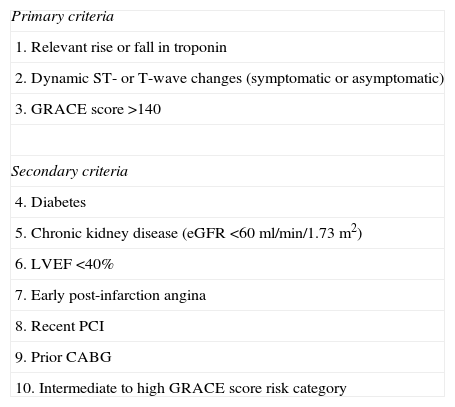
The decision-making process for revascularization in NSTEMI is complex, due to the heterogeneity of such patients in terms of risk and prognosis.2 Risk stratification is therefore recommended to identify patients at high short- and long-term risk of death or cardiovascular events, in order to opt for an early invasive strategy and optimal medical therapy.2,3 Immediate (<2 hours) invasive evaluation should be performed in patients with refractory angina, cardiogenic shock, or hemodynamic or electrical instability, and an early invasive strategy (<24 hours) should be adopted in patients with at least one high-risk criterion (Table 10). In patients with a GRACE risk score of <140 but with at least one secondary high-risk criterion (Table 10) an invasive evaluation should be performed preferably within 72 hours of admission. In other low-risk patients without recurrent symptoms, a non-invasive assessment of inducible ischemia should be performed before hospital discharge. However, meta-analyses of clinical trials10,11 have shown that an invasive strategy can be adopted as routine. The meta-analysis by Hoenig et al.10 of five trials – TACTICS-TIMI 18, ICTUS, RITA-3, FRISC-II and VINO – showed that an invasive strategy in unstable angina/NSTEMI results in a reduction of 33% in relative risk for the endpoints of refractory angina and rehospitalization at six to 12 months. While an invasive strategy is associated with a two-fold increase in the risk of periprocedural myocardial infarction (MI), there are significant 27% and 22% relative risk reductions in the rate of MI assessed at six to 12 months and three to five years, respectively. Fox et al.,11 in a meta-analysis of the FRISC-II, ICTUS and RITA-3 trials, showed that a routine versus selective invasive strategy in patients with NSTEMI reduces long-term rates of cardiovascular death or MI over a five-year period, and the largest effect is seen in high-risk patients. Age, diabetes, prior MI, ST-segment depression, hypertension, BMI <25 kg/m2 or ≥35 kg/m2, and treatment strategy were independent predictors of cardiovascular death or nonfatal MI over the follow-up period.11 Registry data1 show that a routine invasive strategy is associated with a reduction in the combined endpoint of death and MI, the difference being mainly due to higher mortality with a conservative approach.
Criteria for high risk with indication for invasive management.
| Primary criteria |
| 1. Relevant rise or fall in troponin |
| 2. Dynamic ST- or T-wave changes (symptomatic or asymptomatic) |
| 3. GRACE score >140 |
| Secondary criteria |
| 4. Diabetes |
| 5. Chronic kidney disease (eGFR <60 ml/min/1.73 m2) |
| 6. LVEF <40% |
| 7. Early post-infarction angina |
| 8. Recent PCI |
| 9. Prior CABG |
| 10. Intermediate to high GRACE score risk category |
CABG: coronary artery bypass grafting; eGFR: estimated glomerular filtration rate; LVEF: left ventricular ejection fraction; PCI: percutaneous coronary intervention. Adapted from Windecker et al.3.
Despite all this evidence, there is an inverse relation between patient risk and adoption of an invasive strategy,5,8 as also demonstrated in the study by Puymirat et al. based on the FAST-MI registry,1 in which patients treated by an invasive strategy were younger and had lower GRACE scores than those treated by a conservative approach.
The present study, covering several Portuguese centers, set out to analyze the extent of use and impact of a conservative strategy for NSTEMI in a real-world population based on a multicenter registry with uniform inclusion criteria.
The findings highlight the differences seen in other registries, notably older age, higher prevalence of females and of high-risk criteria (also seen in GRACE score categories) in patients treated by a conservative strategy, who are also less likely to be prescribed medication known to reduce mortality and morbidity in ACS patients,2 another example of the paradoxical relation between patient risk and treatment strategy.
A conservative strategy is an independent predictor of in-hospital and one-year mortality (the primary endpoint) and of in-hospital complications (the secondary endpoint), as in other studies.1,10,11 However, stratification by GRACE score category revealed no difference in in-hospital mortality between strategies in the low and intermediate risk categories, in contrast to published data.2,8 One possible explanation is the small number of deaths in these categories, making it difficult to detect real differences in the population from which the study sample was taken. One-year mortality was significantly higher in the intermediate and high risk categories, as were in-hospital complications.
These findings raise questions concerning the factors determining the decision not to adopt an invasive strategy, particularly the presence of non-cardiac comorbidities and the possible failure to make use of cardiovascular risk scores.
Of in-hospital complications, it should be noted that reinfarction was more common in the invasive strategy group (in contrast to the findings of Bauer et al.12), particularly in those undergoing PCI. The definitions used in our study of reinfarction – which does not specify the vessel in which the new event occurred – and of the PCI-treated vessel – which only considers immediate angiographic success, not procedural or clinical success13 – mean that the cause of reinfarction cannot be definitively established, and could have been related, for example, to incomplete revascularization.
Among the other predictors of in-hospital and one-year mortality and in-hospital complications, age14,15 is associated with a lower probability of an invasive strategy,16,17 which is important in view of the increasing prevalence of cardiovascular disease in aging populations.4,18
It is also worth noting the heterogeneity of patients who underwent coronary angiography without PCI, in 21.6% of whom no angiographically significant CAD was detected and 36.8% of whom were referred for CABG, meaning that 41.6% had significant CAD but did not undergo revascularization. Despite this heterogeneity, patients in this group had better outcomes than those treated conservatively, which highlights the importance of assessment of coronary anatomy when deciding on the therapeutic strategy to adopt.
In contrast to reports in the literature,2 a conservative strategy was not associated with longer hospital stay. Although the data do not indicate the reason for this, it may be because patients who underwent coronary angiography without PCI were less likely to be discharged home and had a higher rate of interhospital transfer, which may be due to a greater number of patients with indication for surgery. However, the study design does not allow a causal relation to be established.
LimitationsThe study has the limitations of all registries, since not all centers in Portugal are represented in the ProACS and those that are do not include all their patients. The limitations of the registry format also mean that the reasons for not adopting an invasive strategy are not specified, including patient preferences and contraindications. It also has the limitations inherent to observational studies, including the impossibility of proving causality in cases of correlation between parameters and the fact that treatment strategies were not randomized. The results should therefore be treated as merely indicative.
ConclusionsThe present study, based on real-life clinical practice, shows that a conservative strategy in patients with NSTEMI is associated with higher in-hospital mortality, in-hospital complications and one-year and one-year mortality.
Ethical disclosuresProtection of human and animal subjectsThe authors declare that no experiments were performed on humans or animals for this study.
Confidentiality of dataThe authors declare that no patient data appear in this article.
Right to privacy and informed consentThe authors declare that no patient data appear in this article.
Conflicts of interestThe authors have no conflicts of interest to declare.
Please cite this article as: Moreira D, Marmelo B, Delgado A, et al. A decisão de não revascularizar o enfarte agudo do miocárdio sem supradesnivelamento de ST – condicionantes e prognóstico. A realidade nacional. Rev Port Cardiol. 2015;34:315–328.


