


Whole blood viscosity (WBV) is the intrinsic resistance of blood flow in vessels, and when elevated induces endothelial shear stress and endothelial inflammation and can accelerate the atherosclerotic process. This study aims to compare WBV levels in patients with microvascular angina (MVA), patients with coronary artery disease (CAD), and normal controls, and to identify the relationship between WBV and high-sensitivity C-reactive protein as a marker of inflammation in MVA and CAD.
MethodsA total of 573 patients were studied. The MVA group consisted of 189 subjects, the CAD group consisted of 203 subjects, and the control group consisted of 181 age- and gender-matched individuals. WBV was calculated from hematocrit and plasma protein concentration at a low shear rate (0.5 s–1) and high shear rate (208 s–1) by a validated equation.
ResultsPatients with CAD and MVA had significantly higher WBV at both low and high shear rates compared to the control group. Correlation analysis revealed a significant relationship between high-sensitivity C-reactive protein and WBV at low (r=0.556; p<0.001) and high shear rates (r=0.562) in the CAD group and at low (r=0.475) and high shear rates (r=0.493) in the MVA group.
ConclusionsOverall, this study demonstrated a significant and independent association between blood viscosity and the existence of endothelial inflammation and the atherosclerotic process.
A viscosidade sanguínea contribui para a resistência intrínseca do sangue nos vasos sanguíneos, induz stress de cisalhamento no endotélio, inflamação no endotélio e processo ateroesclerótico quando os valores são elevados. Este estudo tem o objetivo de comparar os níveis da viscosidade sanguínea nos doentes com angina microvascular, com doença arterial coronária e na população normal e de identificar a relação entre a viscosidade sanguínea e a proteína C reativa de alta sensibilidade como um marcador inflamatório nos doentes.
MétodosForam selecionados 573 doentes neste estudo. O grupo da angina microvascular foi composto por 189 indivíduos, o grupo da doença arterial coronária por 203 indivíduos e o grupo controlo por 181 indivíduos combinados por idade e género. A viscosidade sanguínea foi calculada pelo hematócrito e pela concentração da proteína plasmática a uma taxa de cisalhamento baixa (0,5 s-1) e a uma taxa de cisalhamento elevada (208 s-1) através de equação válida.
ResultadosOs doentes com doença arterial coronária e com angina microvascular apresentaram viscosidade sanguínea mais elevada nas taxas de cisalhamento baixa e elevada quando comparados com o grupo controlo. A correlação revelou uma relação significativa entre a proteína C reativa de alta sensibilidade e a viscosidade sanguínea na taxa de cisalhamento baixa (r = 0,556; p < 0,001) e na taxa de cisalhamento elevada (r = 0,562) no grupo da doença arterial coronária e na taxa de cisalhamento baixa (r = 0,475) e na taxa de cisalhamento elevada (r = 0,493) no grupo da angina microvascular.
ConclusãoGlobalmente, os aspetos principais deste estudo são a demonstração de uma associação significativa e independente entre a viscosidade do sangue e a existência de inflamação no endotélio e o processo aterosclerótico.
Atherosclerosis is a prevalent cardiovascular disease characterized by inflammation and plaque formation within arterial walls. By means of coronary angiography, it is possible to visualize the contours of the epicardial coronary arterial tree in vivo. However, abnormalities in the function and structure of coronary microcirculation deserve additional attention.
Vascular endothelial cells are exposed to hemodynamic forces (including hydrostatic pressure, cyclic stretch, and fluid shear stress), which modulate the functions of these cells in health and disease. Flow patterns and hemodynamic forces in the vascular system are not uniform. In straight parts of the arterial tree, high shear stress upregulates genes that are protective against atherosclerosis under sustained laminar blood flow; however, in branches and curvatures the nonuniform and irregular blood distribution of low shear stress induces genes that promote endothelial abnormalities and atherosclerosis.1
Whole blood viscosity (WBV) is the intrinsic resistance of blood flow in vessels.2 Factors including hematocrit, total plasma protein, erythrocyte aggregation, and erythrocyte deformability may influence WBV.3 Studies have shown that elevated WBV may promote endothelial shear stress, endothelial inflammation, and vascular remodeling, and can accelerate the atherosclerotic process.4,5
The aim of this study is twofold. The first is to compare WBV levels in patients with microvascular angina (MVA), patients with coronary artery disease (CAD), and normal controls. The second is to identify the relationship between WBV and high-sensitivity C-reactive protein (hs-CRP) as a marker of inflammation in CAD and MVA.
MethodsA total of 3160 patients undergoing diagnostic coronary angiography between February 2016 and December 2017 were analyzed retrospectively. Of these, 573 patients for whom hs-CRP and WBV parameters were available were selected for the current study. The MVA group consisted of 189 subjects (93 men, mean age 58.1±8.7 years) with anginal chest pain but a normal coronary angiogram, the CAD group consisted of 203 subjects (105 men, mean age 59.3±6.9 years), and the control group included 181 age- and gender-matched individuals (96 men, mean age 59.7±7.2 years) without known cardiac disease or signs of inducible ischemia on myocardial perfusion scintigraphy or treadmill exercise test.
Patients with valvular heart disease, heart failure, cardiomyopathy, hematological disease (including anemia), cancer, active or chronic infectious or inflammatory disease, autoimmune disease, or other neurological or musculoskeletal disorders were excluded. Informed consent was obtained from all patients before noninvasive and invasive protocols. The study was approved by the local ethics committee.
All subjects underwent a detailed medical history, physical examination, and biochemical and hematological tests. After the physical examination patients underwent treadmill exercise testing and myocardial perfusion testing. If these tests revealed myocardial ischemia, the patients were enrolled for coronary angiography.
All patients performed a typical Bruce or modified Bruce protocol test in accordance with recent guidelines.6 Symptoms, baseline and peak heart rate, age-predicted maximum heart rate (APMHR), baseline and maximum blood pressure, rhythm abnormalities, and maximum ST deviation were assessed and the Duke treadmill score was calculated.
Endpoints for termination of the exercise test were clinically significant ST-segment changes (>2 mm depression in two contiguous leads measured 80 ms after the J point), worsening angina, clinically significant arrhythmias, drop in systolic blood pressure with increasing workload, signs of poor perfusion, or achievement of the APMHR without such disturbances. In patients with a borderline or nondiagnostic treadmill exercise test, stress perfusion imaging with single-photon emission computed tomography was performed with a single-head gamma camera equipped with a general purpose, low-energy high-resolution parallel hole collimator (Orbiter 400, Siemens AG), using either TL-201 or Tc-99m in accordance with the relevant guidelines.7 Patients with pathologic treadmill exercise or myocardial perfusion tests were referred for coronary angiography, which was performed using the Judkins method, with a femoral artery approach. Patients in whom coronary angiography revealed no visible disease or luminal irregularities (less than 50%), according to a consensual decision between three experienced cardiologists, were included in the MVA group.
MVA was diagnosed on the basis of typical effort-induced angina-like discomfort associated with either transient ischemic ST-segment depression (≥1 mm) during the treadmill exercise test (93 patients) or reversible perfusion defects on myocardial perfusion scintigraphy (96 patients) with angiographically normal coronary arteries and without coronary artery spasm.
For the CAD group, coronary lesions with ≥50% stenosis in vessels of diameter ≥1.5 mm were considered. The Gensini and SYNergy between PCI with TAXUS and Cardiac Surgery (SYNTAX) scores were used to determine the extent and severity of CAD. The online calculator was used for the SYNTAX scores (www.syntaxscore.com).8
The Gensini score grades stenosis in the epicardial coronary arteries as 1 for 1-25% stenosis, 2 for 26-50%, 4 for 51-75%, 8 for 76-90%, 16 for 91-99%, and 32 for total occlusion. This score is then multiplied by a factor from 0.5 to 5 taking into account the importance of the lesion's position in the coronary arterial system.9
Blood samples were drawn via the antecubital vein at admission in patients undergoing elective coronary angiography following a fasting period of 12 h and collected in Becton Dickinson Vacutainer tubes containing 3.6 mg of K2EDTA (dipotassium ethylenediaminetetraacetic acid) for hematological tests and in yellow top tubes without anticoagulant for biochemical tests. Blood glucose, creatinine, hs-CRP, and lipid profile were determined by standard methods.10 An automatic blood counter (Sysmex XT-2000i Hematology Analyzer; Sysmex, Kobe, Japan) was used for whole blood counts.
WBV was calculated from hematocrit (HCT) and plasma total protein (TP) at a low shear rate (LSR; 0.5 s–1) and a high shear rate (HSR; 208 s–1) by the previously validated formula of de Simone et al.11:


Both WBV values were calculated taking into consideration Nwose and Richards’ recommendation in the series on ‘Whole Blood Viscosity Assessment Issues’ that extrapolation of WBV from HCT in % and TP in g/l is the most appropriate approach, especially for estimating WBV in LSR.12
Statistical analysisStatistical analyses were performed using IBM SPSS software, version 22 (IBM SPSS Inc., Chicago, IL, USA). The variables were investigated using visual (histograms and probability plots) and analytical methods (Kolmogorov-Smirnov and Shapiro-Wilk tests) to determine normality of distribution. Continuous variables were presented as mean ± standard deviation or medians (interquartile range), and categorical variables were reported as number of patients and percentage. The study population was divided into three groups: control group, MVA group, and CAD group. One-way analysis of variance was used to compare normally distributed laboratory variables. Levene's test was used to assess the homogeneity of variances. The Kruskal-Wallis test was used to compare non-normally distributed laboratory variables between groups. The Mann-Whitney U test was performed to test the significance of pairwise differences using Bonferroni's correction to adjust for multiple comparisons. To investigate the associations between non-normally distributed hs-CRP and WBV scores, correlation coefficients and their significance were calculated using Spearman's correlation test. The capacity of WBV to predict CAD and MVA at both LSR and HSR was analyzed using receiver operating characteristic (ROC) curve analysis. When a significant cut-off value was observed, the sensitivity, specificity, and positive and negative predictive values are presented. For assessment of the area under the curve (AUC), a p-value <0.05 was considered statistically significant.
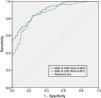
ResultsThe three study groups were similar regarding gender distribution, age, and CAD risk factors including hypertension, diabetes, hyperlipidemia, and smoking status. The mean age of the study population was 52.3±6.1 years (range 49-67 years). The baseline clinical parameters and laboratory findings of the study groups are given in Table 1.
Baseline characteristics and laboratory parameters of the study groups (n=573).
| Variables | Control group (n=181) | MVA group (n=189) | CAD group (n=203) | p |
|---|---|---|---|---|
| Clinical parameters | ||||
| Age, years | 59.7±7.2 | 58.1±8.7 | 59.3±6.9 | 0.30 |
| Male gender | 96 (53%) | 93 (49.2%) | 105 (52.5%) | 0.55 |
| Hypertension | 79 (43.6%) | 82 (43.3%) | 95 (46.3%) | 0.21 |
| Diabetes | 48 (26.5%) | 66 (34.9%) | 68 (33.4%) | 0.43 |
| Hyperlipidemia | 49 (27%) | 88 (40.7%) | 74 (34.3%) | 0.09 |
| Current smoker | 69 (38.1%) | 72 (38.9%) | 84 (41.3%) | 0.67 |
| BMI, kg/m2 | 24.2±2.5 | 25.3±1.3 | 23.8±3.6 | 0.34 |
| Gensini score | - | 4.2±2.5 | 45.5±11.7 | - |
| SYNTAX score | - | - | 21.7±4.3 | - |
| Laboratory parameters | ||||
| Hemoglobin, g/dl | 13.3±1.5 | 13.2±1.4 | 13.3±1.6 | 0.60 |
| Hematocrit, % | 39.9±5.2 | 40±4.2 | 44.3±5 | <0.001 |
| WBC, 103/μl | 6.5 (5.2-7.8) | 8.5 (6.9-10.4) | 8.5 (7.1-10.8) | <0.001 |
| MPV, 103/μl | 9.0 (8.3-10.0) | 8.8 (8.2-9.5) | 8.8 (8.0-10.0) | 0.63 |
| RDW, 103/μl | 14.7±2.9 | 15.4±1.6 | 14.7±2.3 | 0.008 |
| Platelets, 103/μl | 216 (183-252) | 245 (214-288) | 216 (178-259) | <0.001 |
| Blood glucose, mg/dl | 95±17 | 98±25 | 94±31 | 0.70 |
| Urea, mg/dl | 25.4±1.3 | 25±5.6 | 24.6±7.2 | 0.33 |
| Serum creatinine, mg/dl | 0.9±0.3 | 0.8±0.5 | 0.9±0.1 | 0.69 |
| TP, g/l | 67.2±8.1 | 73±6.2 | 73.4±8.7 | <0.001 |
| Serum albumin, mg/dl | 4.0±0.7 | 4.2±0.5 | 4.1±0.9 | 0.27 |
| Total cholesterol, mg/dl | 176±49 | 188±43 | 171±39 | 0.002 |
| LDL cholesterol, mg/dl | 109±35 | 110±41 | 101±31 | 0.03 |
| HDL cholesterol, mg/dl | 41 (35-51) | 45 (40-51) | 42 (35-49) | 0.01 |
| Triglycerides, mg/dl | 135 (95-180) | 132 (100-192) | 133 (90-174) | 0.44 |
| hs-CRP, mg/dl | 0.23±0.07 | 0.43±0.04 | 0.47±0.04 | <0.001 |
| Sodium, mEq/l | 140±2.9 | 141±3.7 | 140±3.1 | 0.42 |
| Potassium, mEq/l | 4.3±0.7 | 4.4±0.4 | 4.4±0.5 | 0.15 |
BMI: body mass index; CAD: coronary artery disease; HDL: high-density lipoprotein; hs-CRP: high-sensitivity C-reactive protein; LDL: low-density lipoprotein; MPV: mean platelet volume; MVA: microvascular angina; RDW: red cell distribution width; SYNTAX: SYNergy between PCI with TAXUS and Cardiac Surgery; TP: total protein; WBC: white blood cell count.
Values are median (IQR), mean ± SD, or n (%).
Hematological parameters including hemoglobin and mean platelet volume and biochemical parameters including fasting glucose, urea, serum creatinine, serum albumin, triglycerides, and sodium and potassium levels were not statistically significant between the groups. However, hs-CRP, red cell distribution width, hematocrit, white blood cell and platelet counts, and total protein were significantly higher in both the MVA and CAD groups compared to the control group (p<0.001). In addition, there were no significant differences between the MVA and CAD groups in these parameters. Total cholesterol, low-density lipoprotein (LDL) cholesterol, and high-density lipoprotein cholesterol were found to be significantly higher in the MVA group compared to the control and CAD groups (p<0.01) (Table 1).
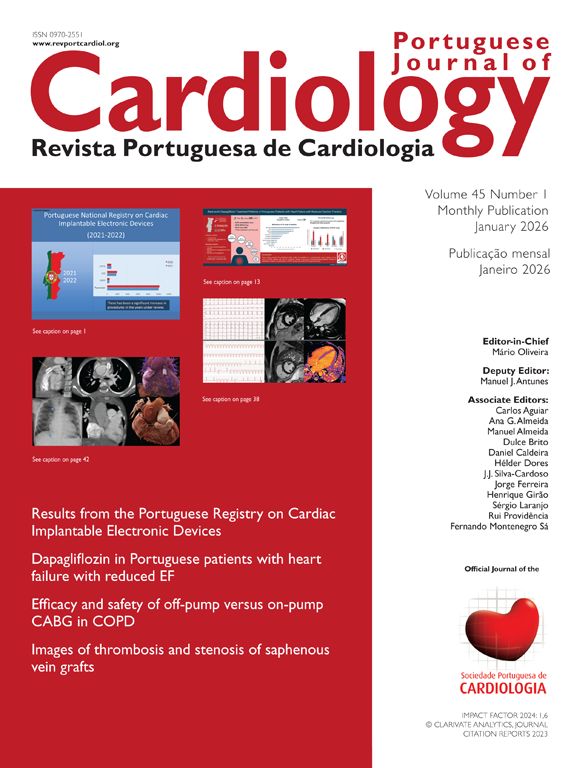
CAD and MVA patients had significantly higher WBV at LSR (72.1±27 and 62.4±18 vs. 37.4±14; p<0.001) and HSR (21±4.5 and 18.3±2.8 vs. 15.1±1.6; p<0.001) compared with the control group (Table 2). Correlation analysis revealed a significant relationship between hs-CRP and WBV at LSR (r=0.556; p<0.001) and HSR (r=0.562; p<0.001) in the CAD group and at LSR (r=0.475; p<0.001) and HSR (r=0.493; p<0.001) in the MVA group (Figure 1).
Comparison of whole blood viscosity parameters in the study groups.
| Variables | Control group | MVA group | CAD group | p |
|---|---|---|---|---|
| WBV at HSR (208 s–1) | 15.1±1.6 | 18.3±2.8 | 21±4.5 | <0.001 |
| WBV at LSR (0.5 s–1) | 37.4±14 | 62.4±18 | 72.1±27 | <0.001 |
CAD: coronary artery disease; HSR: high shear rate; LSR: low shear rate; MVA: microvascular angina.
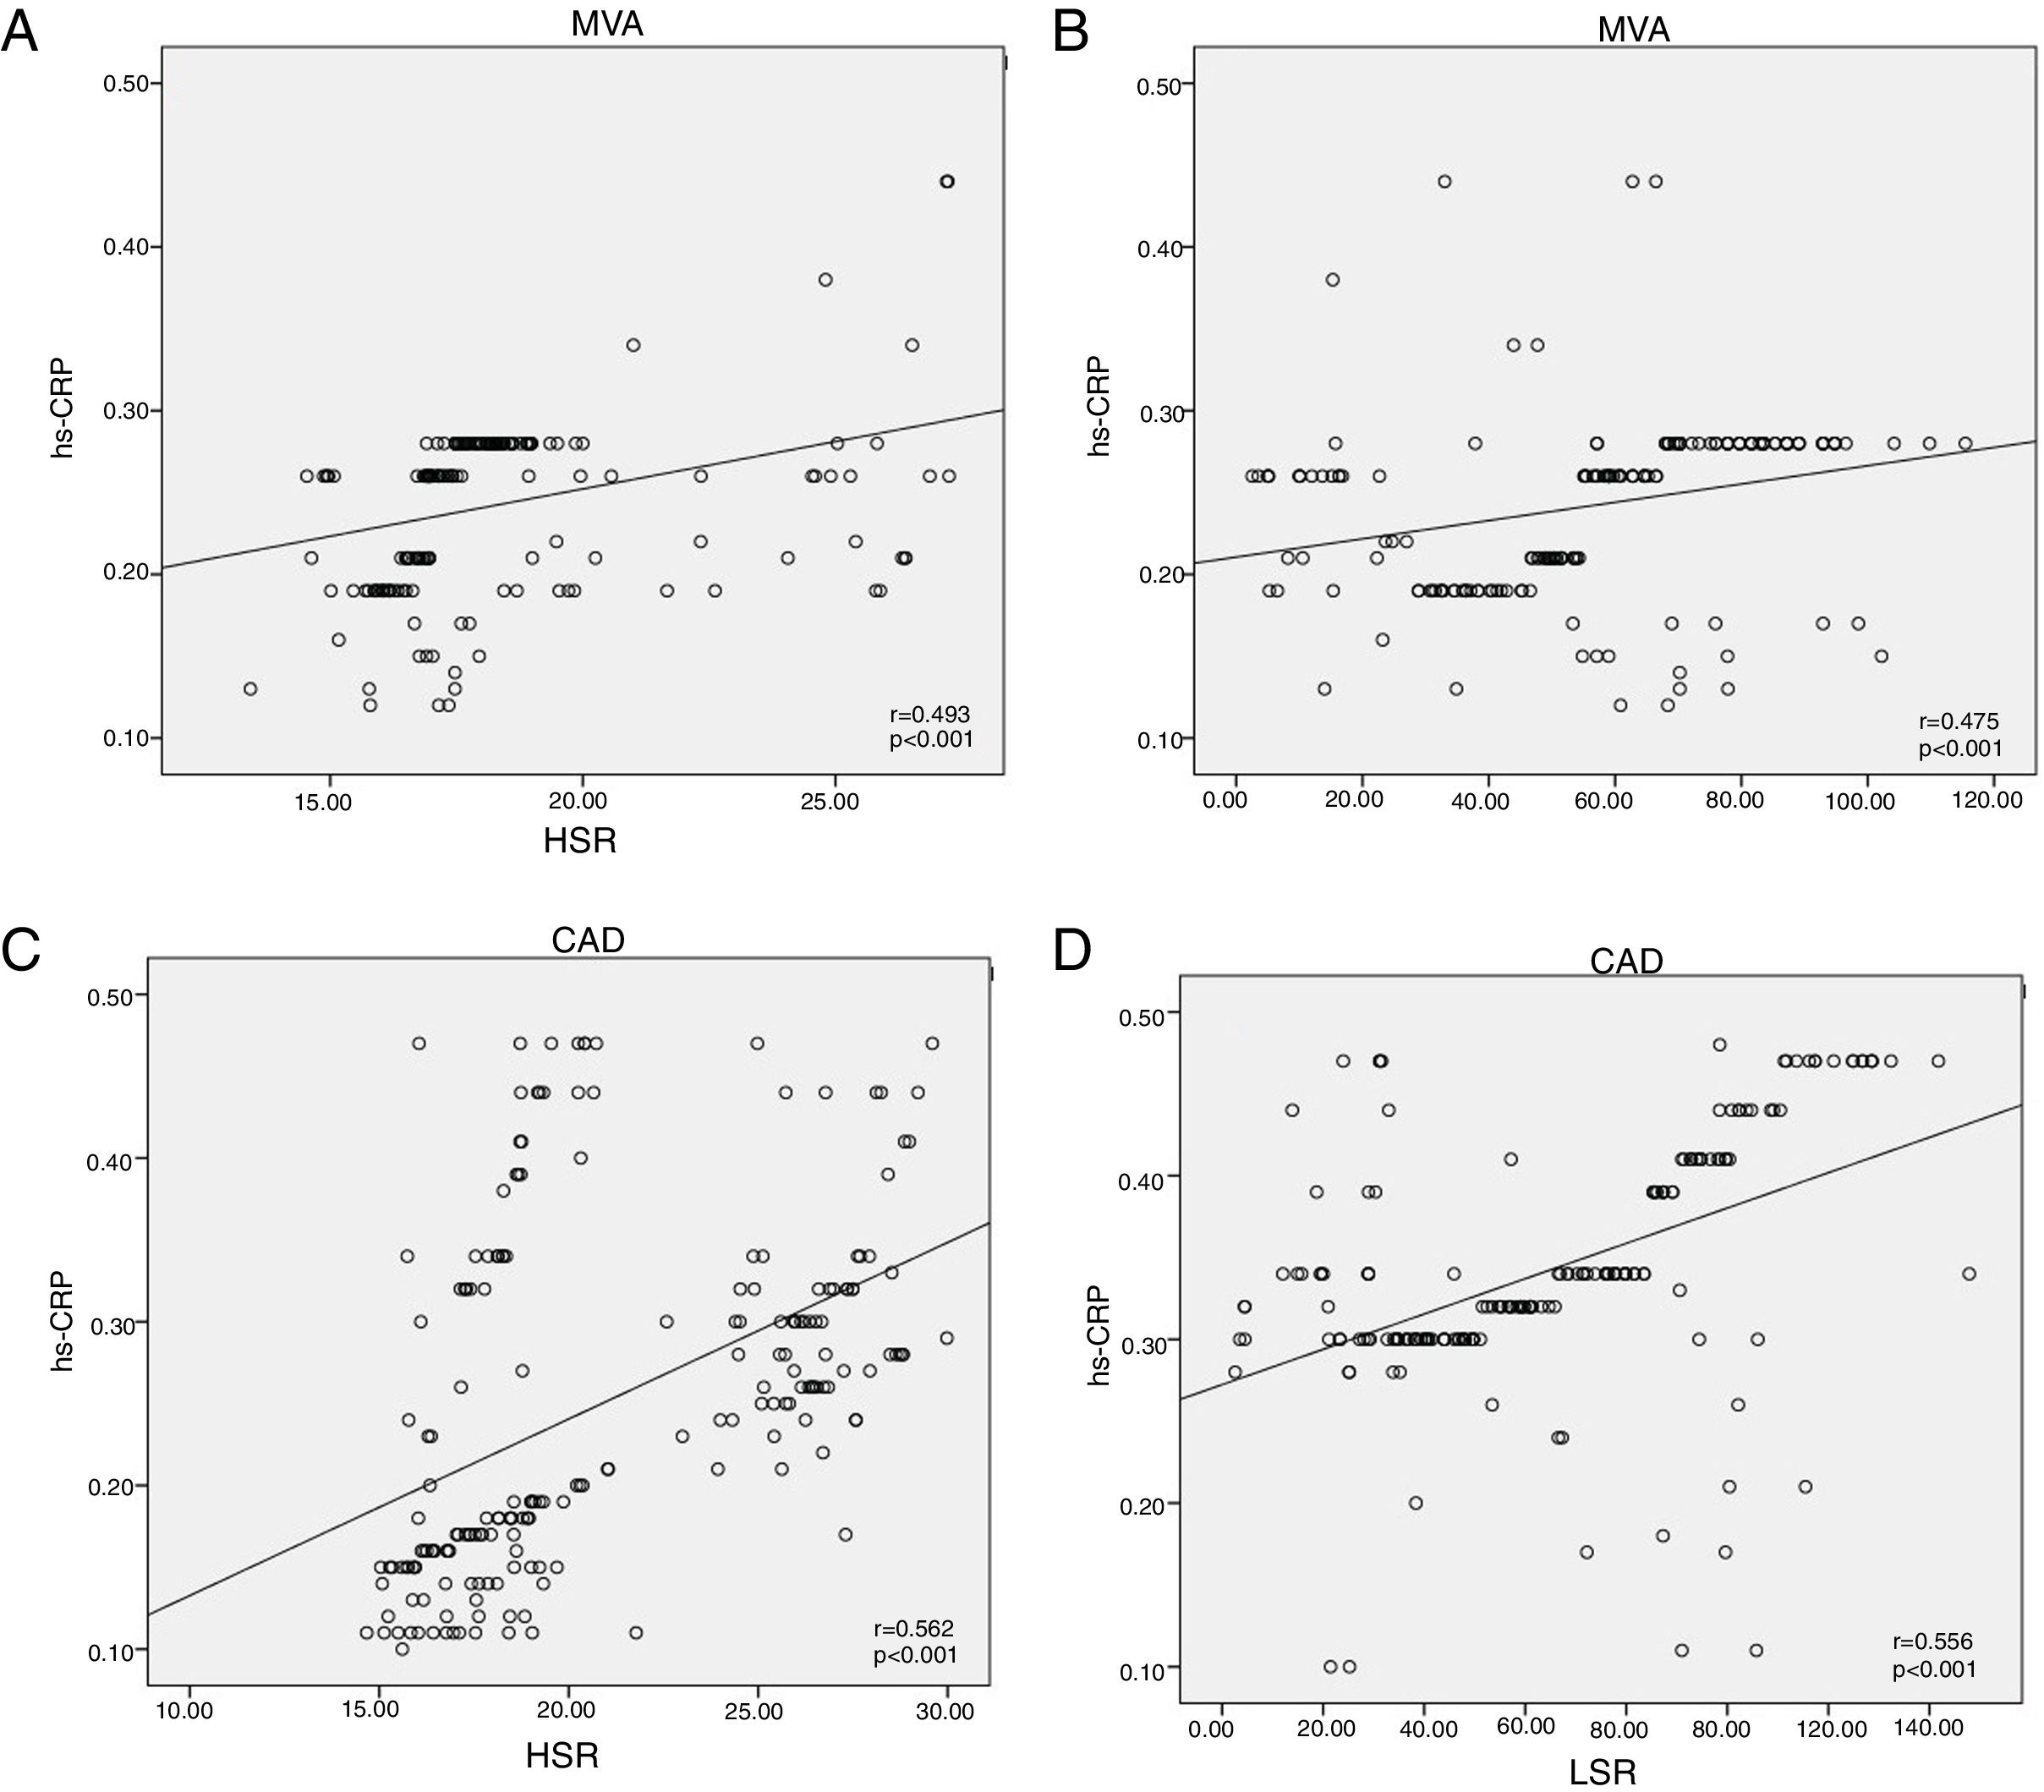
(A) Correlation between hs-CRP and HSR in the MVA group; (B) correlation between hs-CRP and LSR in the MVA group; (C) correlation between hs-CRP and HSR in the CAD group; (D) correlation between hs-CRP and LSR in the CAD group. CAD: coronary artery disease; hs-CRP: high-sensitivity C-reactive protein; HSR: high shear rate; LSR: low shear rate; MVA: microvascular angina.
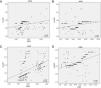
Although mean WBV values showed a progressive elevation from controls to the CAD group, there were statistically significant differences in WBV values between the CAD and MVA groups. We therefore combined these groups to differentiate the microvascular and macrovascular effects of WBV from the control group for ROC analysis, which revealed a WBV cut-off of ≥45 at LSR with sensitivity of 82% and specificity of 78% (AUC 0.861, p<0.001) and a cut-off of ≥16 at HSR with sensitivity of 83% and specificity of 77% (AUC 0.893, p<0.001) for prediction of CAD and MVA (Figure 2).
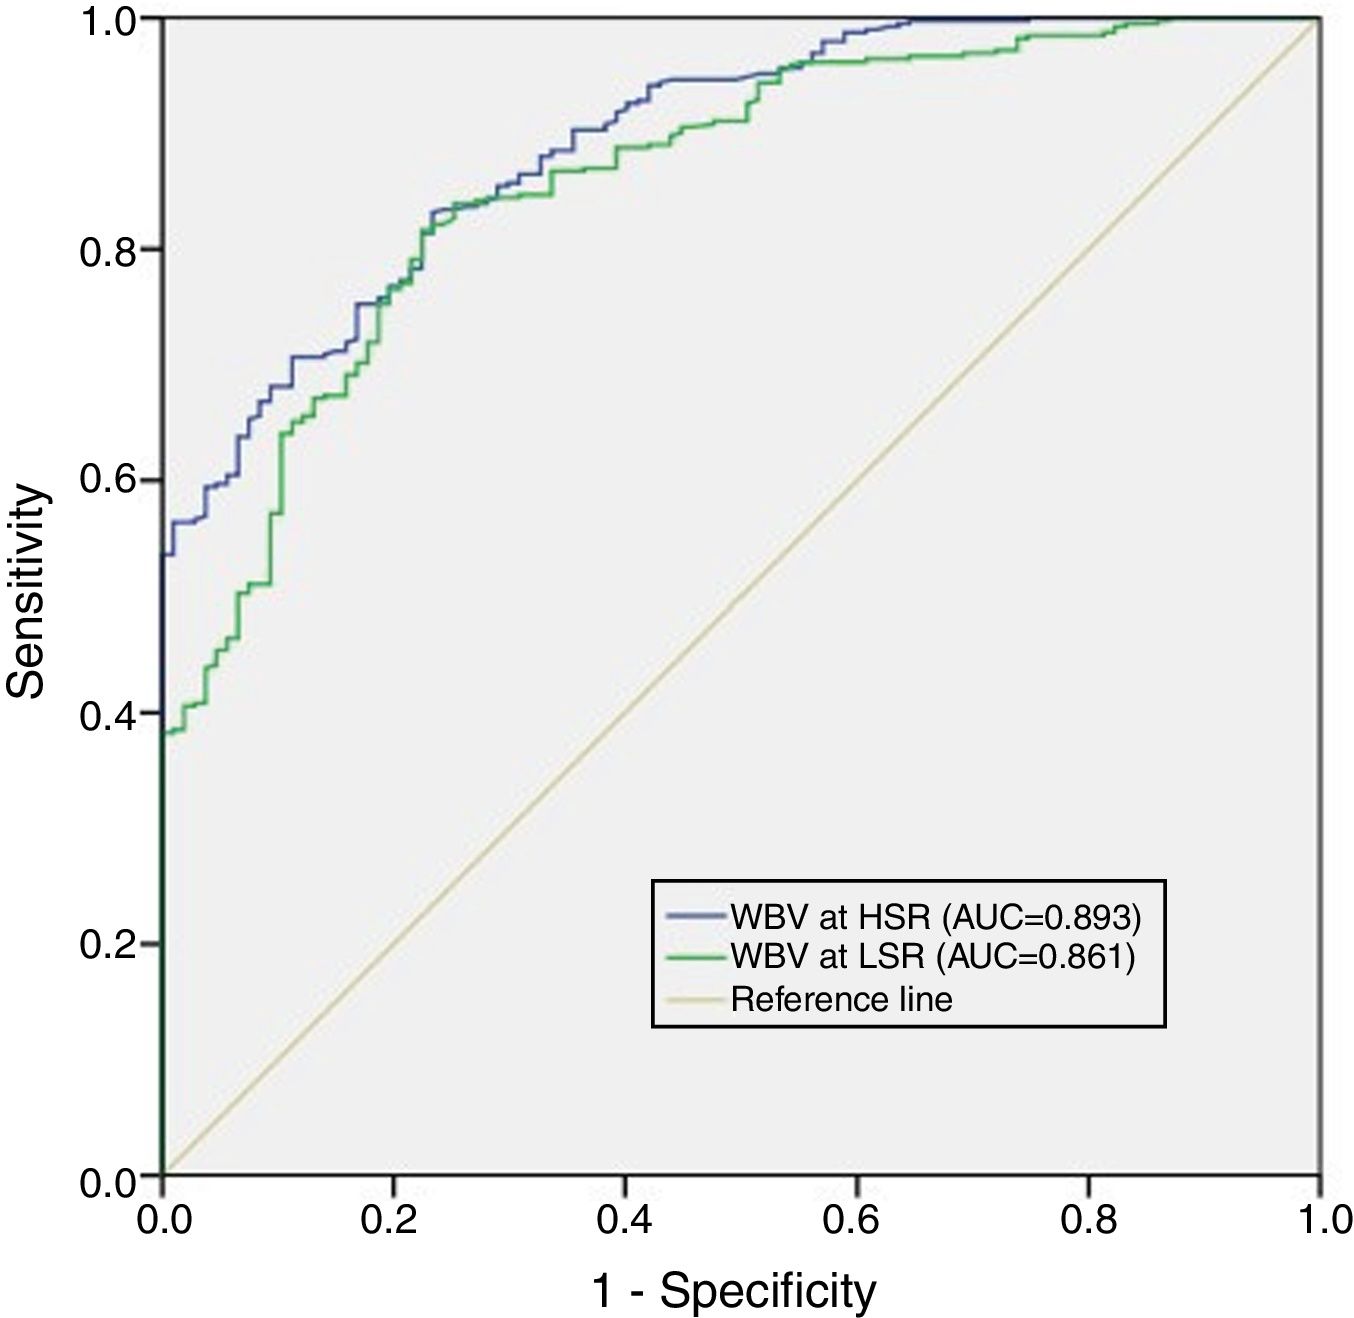
Receiver operating characteristic curve (ROC) analysis of whole blood viscosity at high shear rate and low shear rate for the prediction of coronary artery disease and microvascular angina. 95% confidence intervals for ROC curve analysis are also displayed. AUC: area under the curve; HSR: high shear rate; LSR: low shear rate; WBV: whole blood viscosity.
This study set out to assess the importance of WBV at both LSR and HSR in the setting of CAD and MVA. Our results revealed that WBV was markedly elevated in patients with CAD, in line with previous studies in which WBV had been reported to be elevated in patients with both stable and unstable angina and acute coronary syndromes. WBV has a significant independent relationship with the occurrence of adverse cardiovascular events.13–15 Furthermore, in our study ROC curve analysis demonstrated that a WBV cut-off of ≥45 at LSR (AUC 0.861, p<0.001) and a cut-off of ≥16 at HSR (AUC 0.893, p<0.001) were predictive of CAD and MVA. However, some studies have questioned the effect of WBV in patients with nonobstructive CAD or MVA.
Although the causes of MVA, particularly endothelial dysfunction, are complex, it is known to be linked to common cardiovascular risk factors such as smoking, obesity, hypercholesterolemia, and inflammation. However, local factors, such as hemodynamic forces including flow-generated endothelial shear stress and blood pressure-derived tensile stress, are also known to play an important role.16 Endothelial shear stress is defined as the frictional shear force of the flowing blood on the unit area of the arterial wall. In normal physiologic shear stress, endothelial cells produce endothelial NO synthase (eNOS) messenger ribonucleic acid (mRNA) and atheroprotective gene expression but decrease endothelin-1 (ET-1) mRNA. On the other hand, under low shear stress condition, the response of endothelial cells is to increase the uptake of oxidized LDL cholesterol, upregulating ICAM-1, VCAM-1, MCP-1, E-selectin, tumor necrosis factor-alpha (TNF-α) and bone morphogenic protein-4, but decreasing eNOS mRNA and protein expression.17,18 These responses lead to endothelial injury and dysfunction and inflammation. Furthermore, increased humoral (C3a and C5a subunits of the complement system [anaphylatoxins], kinin, and blood coagulation factors) and cellular activation (histamine, serotonin, granulocyte factors, monokines, lymphokines) as a result of inflammation lead to an increase in blood viscosity.19 This study showed that WBV elevation may be an indicator of inflammation, which is responsible for the endothelial dysfunction known to be the mechanism underlying the pathophysiology of macrovascular and microvascular coronary disease.
C-reactive protein (CRP) is a well-known acute phase protein that is produced predominantly by hepatocytes in response to various cytokines such as interleukin (IL)-6 and TNF-α.20 It has been investigated in the context of arteriosclerosis and vascular diseases. Based on multiple studies and guidelines, elevation of hs-CRP has been shown to be associated with major cardiovascular risk (hs-CRP <1 mg/l, low risk; 1-3 mg/l, intermediate risk; 3-10 mg/l, high risk; >10 mg/l, nonspecific elevation).21–23
Lipid-lowering therapy is used to reduce levels of both LDL cholesterol and CRP, and concurrently the number of CV events.24–27 However, it is unclear whether targeted inhibition of inflammation can reduce cardiovascular event rates.
Recently, the Canakinumab Anti-Inflammatory Thrombosis Outcomes Study (CANTOS) demonstrated that direct inhibition of inflammation by the interleukin-1 beta inhibitor canakinumab could reduce the risk of future cardiovascular events, while the Cardiovascular Inflammation Reduction Trial (CIRT) tested the inflammatory hypothesis of atherothrombosis by assessing whether low-dose methotrexate reduced rates of myocardial infarction, stroke, and cardiovascular death among stable CAD patients with type 2 diabetes or metabolic syndrome.28
As all these studies show the importance of inflammation at all stages of the atherothrombotic process, it is persuasive that significant positive correlations were found between the inflammatory marker hs-CRP and WBV at both LSR and HSR in our study. In particular, pathophysiologically low shear stress has been found to have an association with increased expression of inflammatory genes.29,30 In view of these findings, raised hs-CRP may be considered a reflection of increased inflammatory activity in the presence of elevated WBV.
Our analysis has some limitations. First, this was a retrospective, non-randomized, single-center study. Second, microvascular dysfunction was not documented by endothelium-independent (adenosine, dypiramidole, or papaverine challenge) or endothelium-dependent (acetylcholine challenge and cold pressor test) testing of vasodilator activity. Thirdly, WBV was not validated by accurate measurement of viscosity using a viscometer. As this study represents a pilot study for the use of WBV in assessment of the atherosclerotic process, further studies with more patients are required to ascertain the value of this parameter and similar alternative indices.
ConclusionThese results demonstrate that patients with CAD and with MVA had higher WBV at both LSR and HSR than the control group. Furthermore, hs-CRP was shown to have a positive correlation with WBV. The key strength of this study is its demonstration of a significant and independent association between simple measurement of blood viscosity and the existence of endothelial inflammation and progression of the atherosclerotic process.
FundingThe authors received no financial support for the research, authorship, or publication of this article.
Author contributionsEC and BB contributed to the design of the work and drafted the manuscript. All authors critically revised the manuscript. All gave final approval and agreed to be accountable for all aspects of the work, ensuring integrity and accuracy.
Conflicts of interestThe authors have no conflicts of interest to declare.
