


The only effective treatment for severe aortic stenosis (AS) is aortic valve replacement (AVR). The intervention should happen as soon as possible to lower the risk of heart failure and death. We aimed to assess the time between referral to the surgery center and performing the AVR for a sample of patients with severe AS diagnosis, as well as the impact it may have on hospitalization and mortality.
MethodsThis was a retrospective study including 241 patients with severe AS submitted to AVR at the surgery center between January 2018 and December 2021, or patients that died during that period.
ResultsIn a total of 174 ambulatory patients who underwent AVR, 82.2% had surgical aortic valve replacement (SAVR) and 17.8% transcatheter aortic valve implantation (TAVI). The median wait time for SAVR and TAVI was 226 and 426 days, respectively. From a total of 56 hospitalized patients who underwent AVR, 89.3% had SAVR and 10.7% TAVI. The mean wait time for SAVR and TAVI was 9 and 15 days, respectively. While waiting for intervention, 13% of patients were hospitalized and 6% died.
ConclusionsThe wait times for AVR found in our study are substantially longer than recommended for outpatient regimen. Extended wait times are linked to an increasing incidence of adverse events.
O único tratamento efetivo para a estenose aórtica (EA) severa é a substituição da válvula aórtica (SVA). A intervenção deve acontecer o mais rápido possível para reduzir o risco de insuficiência cardíaca e morte. O nosso objetivo foi avaliar o tempo desde a referenciação ao centro cirúrgico até à SVA de uma amostra de doentes com diagnóstico de EA severa e o impacto que este poderá ter na hospitalização e mortalidade.
MétodosEstudo retrospetivo com inclusão de 241 doentes com EA severa que foram submetidos a SVA no centro cirúrgico de referência entre janeiro de 2018 e dezembro de 2021 ou que faleceram em lista de espera nesse período.
ResultadosNum total de 174 doentes submetidos a SVA em regime de ambulatório, 82,2% realizaram cirurgia de substituição valvular (SAVR) e 17,8% implantação percutânea de prótese valvular aórtica (TAVI). A mediana de tempo de espera para SAVR e TAVI foi de 226 e 426 dias, respetivamente. Num total de 56 doentes submetidos a SVA em regime de internamento, 89,3% realizaram SAVR e 10,7% TAVI. A média de tempo de espera para SAVR e TAVI foi de 9 e 15 dias, respetivamente. Enquanto aguardavam por intervenção, 13% dos doentes foram internados e 6% faleceram.
ConclusõesOs tempos de espera para SVA encontrados no nosso estudo são consideravelmente superiores aos recomendados, em regime de ambulatório. Tempos prolongados de espera em ambulatório estão associados a uma incidência crescente de eventos adversos.
Aortic stenosis (AS) is the most prevalent valvular disease and the one that most frequently requires surgery or percutaneous intervention in Europe.1,2 In developed countries, the occurrence of this condition is mainly due to degenerative calcification of the aortic valve.2–4 Consequently, as the population ages, the prevalence of aortic stenosis continues to rise, with approximately 3.4% of patients over the age of 75 having severe AS.5
Severe AS presents with exertional dyspnea, chest angina, presyncope, or syncope.6,7 Echocardiography is the gold-standard test for confirming the diagnosis and assessing the severity of AS, based on the mean aortic transvalvular gradient (ΔPm), the maximum aortic transvalvular velocity (Vmax), and the aortic valve area (AVA).8–11
It is known that, once symptoms appear, the average survival of patients without appropriate intervention is two to three years.3,7 Therefore, timely intervention is crucial. The only effective treatment for severe AS is aortic valve replacement (AVR), which can be performed via surgical aortic valve replacement (SAVR) or transcatheter aortic valve implantation (TAVI). TAVI has been validated as an effective alternative to conventional surgery, particularly in older patients (≥75 years), those with multiple comorbidities, or those at high surgical risk.8
Despite the significant improvements observed, the quality of management of patients with severe AS remains suboptimal in various European hospital centers.12,13 Currently, there are no guidelines or recommendations on the waiting time from diagnosis to intervention issued by the European Society of Cardiology (ESC). However, intervention should take place as soon as possible to reduce the risk of heart failure (HF) and death.14 The Canadian Wait Time Alliance has established a benchmark maximum waiting time for SAVR of 42 days for elective cases and 14 days for urgent cases.15 More recently, wait time guidelines for TAVI were published and approved by the Canadian Cardiovascular Society (CCS), setting a maximum waiting time of 84 days for elective cases and 14 days for urgent cases.16
With the increasing prevalence of this condition, there is a potential overload on surgical centers, which may in turn lead to prolonged waiting times for valve intervention.
ObjectivesThis study aims to assess the time from referral to the surgical center to the valve intervention in a sample of patients diagnosed with severe AS and to evaluate the impact this wait time may have on hospitalization and mortality among patients on the waiting list.
MethodsThis is a retrospective, observational, descriptive, and analytical study conducted in the Cardiology Department of Local Health Unit of Braga.
Patients with a diagnosis of severe native valve AS confirmed by echocardiography performed at Hospital of Braga, who were either followed in cardiology outpatient consultations or hospitalized at this institution, and who were referred to the surgical reference center between January 2018 and December 2021 or died while on the waiting list for intervention during this period, were consecutively included (n=241).
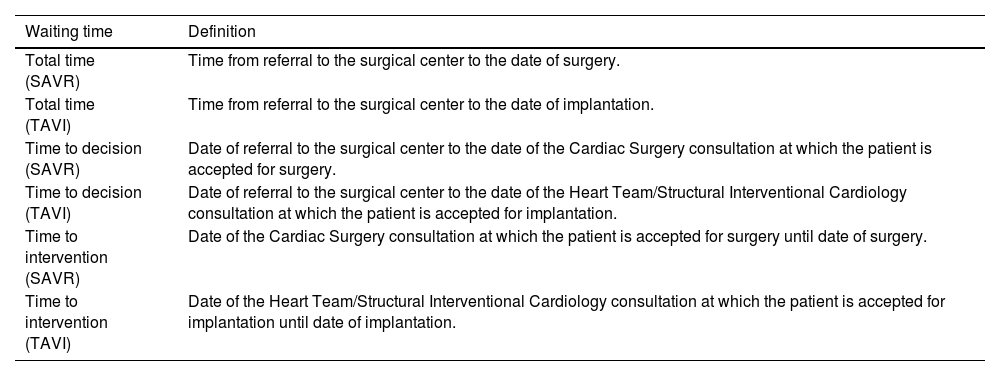
Patients <18 years of age, those who had previously undergone aortic valve procedures, those who did not meet the criteria for intervention, or those who refused the procedure were excluded. Clinical information was collected based on access to the patients’ electronic medical records, including follow-up data. Wait times were calculated according to the definitions described in the Quality Indicators for TAVI document recommended by the CCS, and were also applied to SAVR (Table 1).16,17 Patients who had been previously referred for elective SAVR and required hospitalization followed by urgent intervention were not included in the calculation of total or time-to-intervention waiting periods.
Waiting time definitions.
| Waiting time | Definition |
|---|---|
| Total time (SAVR) | Time from referral to the surgical center to the date of surgery. |
| Total time (TAVI) | Time from referral to the surgical center to the date of implantation. |
| Time to decision (SAVR) | Date of referral to the surgical center to the date of the Cardiac Surgery consultation at which the patient is accepted for surgery. |
| Time to decision (TAVI) | Date of referral to the surgical center to the date of the Heart Team/Structural Interventional Cardiology consultation at which the patient is accepted for implantation. |
| Time to intervention (SAVR) | Date of the Cardiac Surgery consultation at which the patient is accepted for surgery until date of surgery. |
| Time to intervention (TAVI) | Date of the Heart Team/Structural Interventional Cardiology consultation at which the patient is accepted for implantation until date of implantation. |
SARV: surgical aortic valve replacement; TAVI: transcatheter aortic valve implantation.
All procedures in this study were conducted in accordance with the rules of ethical conduct and good practices, following the principles of the Declaration of Helsinki,18 the Convention on Human Rights and Biomedicine,19 the guidelines of the Council for International Organizations of Medical Sciences (CIOMS),20 and the Good Clinical Practice Guidelines.21
Statistical analysisData analysis was performed using the Statistical Package for the Social Sciences, version 28. Initially, the sample was divided into two groups based on the treatment setting – outpatient or inpatient. Categorical variables were described as absolute frequency (n) and relative frequency (%). Continuous variables with a normal distribution were described using mean and standard deviation (SD), while those without a normal distribution were described using median and interquartile range (IQR). To compare categorical variables, the Chi-square test for independent samples was used. Whenever more than 20% of the cells had an expected frequency less than 5, Fisher's exact test was applied. For continuous variables with a normal distribution, the independent samples Student's t-test was used. Variables that did not follow a normal distribution were analyzed using the Mann–Whitney U test. For all tests, a p-value <0.05 was considered statistically significant, with a 95% confidence interval.
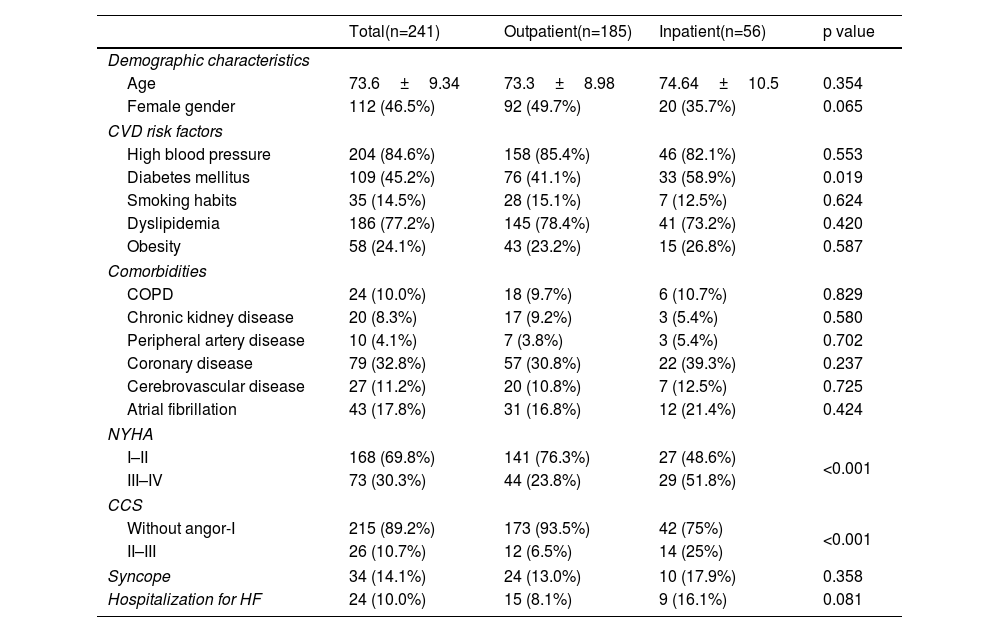
ResultsGeneral characteristicsOut of a total of 241 patients studied, the mean age was 73.6 years, 46.5% of whom were female. The most prevalent cardiovascular risk factors were arterial hypertension, dyslipidemia, and diabetes. The most common comorbidities were coronary artery disease and atrial fibrillation (Table 2). Among all patients who underwent valve replacement, 32.8% had concomitant coronary artery disease (n=79 patients).
Population characteristics and comparison of patient profiles in outpatient and inpatient settings.
| Total(n=241) | Outpatient(n=185) | Inpatient(n=56) | p value | |
|---|---|---|---|---|
| Demographic characteristics | ||||
| Age | 73.6±9.34 | 73.3±8.98 | 74.64±10.5 | 0.354 |
| Female gender | 112 (46.5%) | 92 (49.7%) | 20 (35.7%) | 0.065 |
| CVD risk factors | ||||
| High blood pressure | 204 (84.6%) | 158 (85.4%) | 46 (82.1%) | 0.553 |
| Diabetes mellitus | 109 (45.2%) | 76 (41.1%) | 33 (58.9%) | 0.019 |
| Smoking habits | 35 (14.5%) | 28 (15.1%) | 7 (12.5%) | 0.624 |
| Dyslipidemia | 186 (77.2%) | 145 (78.4%) | 41 (73.2%) | 0.420 |
| Obesity | 58 (24.1%) | 43 (23.2%) | 15 (26.8%) | 0.587 |
| Comorbidities | ||||
| COPD | 24 (10.0%) | 18 (9.7%) | 6 (10.7%) | 0.829 |
| Chronic kidney disease | 20 (8.3%) | 17 (9.2%) | 3 (5.4%) | 0.580 |
| Peripheral artery disease | 10 (4.1%) | 7 (3.8%) | 3 (5.4%) | 0.702 |
| Coronary disease | 79 (32.8%) | 57 (30.8%) | 22 (39.3%) | 0.237 |
| Cerebrovascular disease | 27 (11.2%) | 20 (10.8%) | 7 (12.5%) | 0.725 |
| Atrial fibrillation | 43 (17.8%) | 31 (16.8%) | 12 (21.4%) | 0.424 |
| NYHA | ||||
| I–II | 168 (69.8%) | 141 (76.3%) | 27 (48.6%) | <0.001 |
| III–IV | 73 (30.3%) | 44 (23.8%) | 29 (51.8%) | |
| CCS | ||||
| Without angor-I | 215 (89.2%) | 173 (93.5%) | 42 (75%) | <0.001 |
| II–III | 26 (10.7%) | 12 (6.5%) | 14 (25%) | |
| Syncope | 34 (14.1%) | 24 (13.0%) | 10 (17.9%) | 0.358 |
| Hospitalization for HF | 24 (10.0%) | 15 (8.1%) | 9 (16.1%) | 0.081 |
The results are expressed as mean±SD or n (%). CCS: Canadian Cardiovascular Society classification for angina; COPD: chronic obstructive pulmonary disease; CVD risk factors: cardiovascular risk factors; HF: heart failure; NYHA: New York Heart Association classification.
Statistically significant differences were found in New York Health Association (NYHA) classification between the two groups studied (p<0.001). In the outpatient group, more than half of the patients were classified as NYHA class II, whereas in the inpatient group, patients were more commonly classified as NYHA class III. Statistically significant differences were also observed between the two groups regarding the CCS classification for angina (p<0.001), with a higher percentage of asymptomatic patients in the outpatient group compared to the inpatient group.
More detailed information is presented in Table 3, which describes the characteristics of the inpatient population. The most common reason for hospitalization was acute decompensation of HF, accounting for more than half of the sample (53.6%), followed by angina episodes or acute myocardial infarction. Most patients had already received the diagnosis of AS at the time of admission.
Specific characteristics of the inpatient population.
| Hospitalization(n=56) | |
|---|---|
| Hospitalization motive | |
| Angor/ACS | 15 (26.8%) |
| Decompensated HF | 30 (53.6%) |
| Cardiac arrest | 0 (0%) |
| Syncope | 10 (17.9%) |
| Other | 1 (1.8%) |
| Time of diagnosis | |
| Previous | 50 (89.3%) |
| Simultaneous | 6 (10.7%) |
ACS: acute coronary syndrome; HF: heart failure.
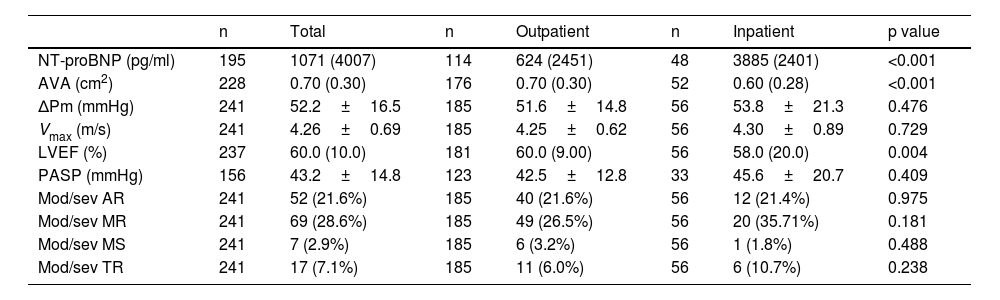
Inpatients had significantly higher median NT-proBNP values compared to outpatients (p<0.001). In echocardiographic evaluation, median AVA was 0.70 cm2 across all patients, and it was significantly smaller in the inpatient group (p<0.001). The mean values for ΔPm and Vmax were 52.2 mmHg and 4.26 m/s, respectively, in the overall cohort.
Inpatients also had significantly lower median left ventricular ejection fraction compared to outpatients (p=0.004). The mean estimated pulmonary artery systolic pressure (PASP) was 43.2 mmHg overall and there were no statistically significant differences between groups (p=0.409). The most common associated valvular diseases were moderate/severe mitral regurgitation and moderate/severe aortic regurgitation, affecting 69 (28.6%) and 52 (21.6%) of all patients, respectively (Table 4).
Analytical and echocardiographic characteristics and comparison of patient profiles in outpatient and inpatient settings.
| n | Total | n | Outpatient | n | Inpatient | p value | |
|---|---|---|---|---|---|---|---|
| NT-proBNP (pg/ml) | 195 | 1071 (4007) | 114 | 624 (2451) | 48 | 3885 (2401) | <0.001 |
| AVA (cm2) | 228 | 0.70 (0.30) | 176 | 0.70 (0.30) | 52 | 0.60 (0.28) | <0.001 |
| ΔPm (mmHg) | 241 | 52.2±16.5 | 185 | 51.6±14.8 | 56 | 53.8±21.3 | 0.476 |
| Vmax (m/s) | 241 | 4.26±0.69 | 185 | 4.25±0.62 | 56 | 4.30±0.89 | 0.729 |
| LVEF (%) | 237 | 60.0 (10.0) | 181 | 60.0 (9.00) | 56 | 58.0 (20.0) | 0.004 |
| PASP (mmHg) | 156 | 43.2±14.8 | 123 | 42.5±12.8 | 33 | 45.6±20.7 | 0.409 |
| Mod/sev AR | 241 | 52 (21.6%) | 185 | 40 (21.6%) | 56 | 12 (21.4%) | 0.975 |
| Mod/sev MR | 241 | 69 (28.6%) | 185 | 49 (26.5%) | 56 | 20 (35.71%) | 0.181 |
| Mod/sev MS | 241 | 7 (2.9%) | 185 | 6 (3.2%) | 56 | 1 (1.8%) | 0.488 |
| Mod/sev TR | 241 | 17 (7.1%) | 185 | 11 (6.0%) | 56 | 6 (10.7%) | 0.238 |
Note: Results are expressed as mean±SD, median (IQR), or n (%). AVA: aortic valve area; LVEF: left ventricular ejection fraction; Mod/sev AR: moderate/severe aortic regurgitation; Mod/sev MR: moderate/severe mitral regurgitation; Mod/sev MS: moderate/severe mitral stenosis; Mod/sev TR: moderate/severe tricuspid regurgitation; PASP: pulmonary artery systolic pressure; Vmax: peak transvalvular aortic velocity; ΔPm: mean transvalvular aortic gradient.
Among the patients who underwent intervention in an outpatient setting (n=174), 143 (82.2%) underwent SAVR and 31 (17.8%) underwent TAVI.
Regarding patients who underwent intervention during hospitalization (n=56), 50 (89.3%) underwent SAVR and the remaining 6 (10.7%) underwent TAVI.
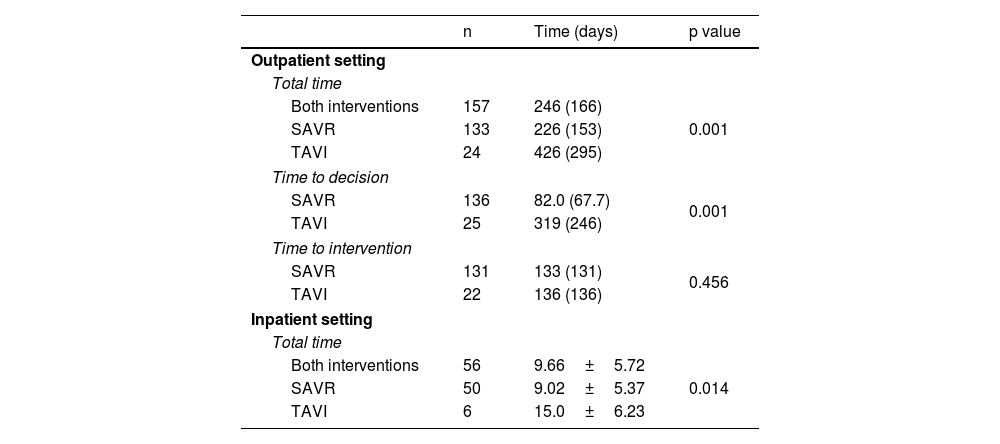
Wait times and adverse eventsBased on the results in Table 5, in the outpatient group, the median total waiting time was 246 days. The median total waiting time for TAVI was significantly longer than for SAVR (SAVR: 226 days vs. TAVI: 426 days, p<0.001). The median time-to-decision was also significantly longer for TAVI (SAVR: 82 days vs. TAVI: 319 days, p<0.001). The median time from decision to intervention was similar, and there was no statistically significant difference between the two groups (SAVR: 133 days vs. TAVI: 136 days, p=0.456).
Waiting time intervals for valve intervention.
| n | Time (days) | p value | |
|---|---|---|---|
| Outpatient setting | |||
| Total time | |||
| Both interventions | 157 | 246 (166) | 0.001 |
| SAVR | 133 | 226 (153) | |
| TAVI | 24 | 426 (295) | |
| Time to decision | |||
| SAVR | 136 | 82.0 (67.7) | 0.001 |
| TAVI | 25 | 319 (246) | |
| Time to intervention | |||
| SAVR | 131 | 133 (131) | 0.456 |
| TAVI | 22 | 136 (136) | |
| Inpatient setting | |||
| Total time | |||
| Both interventions | 56 | 9.66±5.72 | 0.014 |
| SAVR | 50 | 9.02±5.37 | |
| TAVI | 6 | 15.0±6.23 | |
Results are expressed as mean±SD or median (IQR). SAVR: surgical aortic valve replacement; TAVI: transcatheter aortic valve implantation.
In the inpatient group, the mean total waiting time was 9.66 days. The mean total waiting time for TAVI was significantly longer than for SAVR (SAVR: 9.02 days vs. TAVI: 15.0 days, p=0.014). In most hospitalized patients, referral and/or acceptance occurred during hospitalization and was prompted by clinical deterioration during the stay. All interventions performed in the inpatient setting were considered emergent or urgent.
In the outpatient group, the number of interventions performed within 90 days was 9 (4.9%), within 180 days was 50 (27.0%), and a total of 174 interventions (94.0%) were completed by the end of the study period. Within 90 days, three patients (1.6%) were hospitalized; within 180 days, eight patients (4.3%) were hospitalized; and by the end of the study period, 24 patients (13.0%) had been hospitalized. A total of 11 deaths (6.0%) occurred during the study period, of which nine occurred after the first six months (180 days) (Table 6). Among the 24 patients who required hospitalization while on the elective SAVR waiting list, 17 underwent urgent SAVR due to clinical deterioration.
Cumulative proportion of valve interventions, hospitalizations, and deaths on the waiting list in the outpatient setting.
| 90 days | 180 days | >180 days | |
|---|---|---|---|
| Valve intervention | 9 (4.9%) | 50 (27.0%) | 174 (94.0%) |
| Hospitalization for heart failure | 3 (1.6%) | 8 (4.3%) | 24 (13.0%) |
| All causes of death | 0 (0%) | 2 (1.1%) | 11 (6.0%) |
| Death due to cardiac disease | 0 (0%) | 2 (1.1%) | 5 (2.7%) |
Results are expressed as n (%).
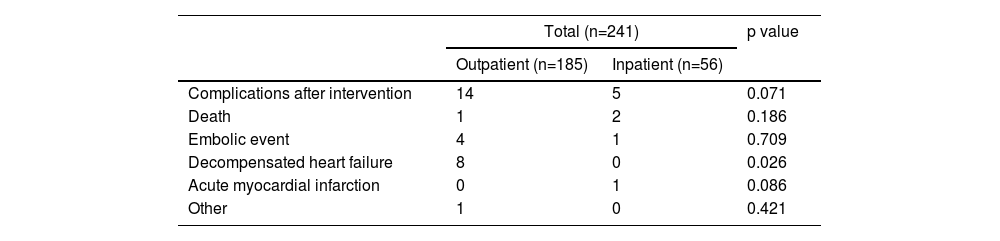
The occurrence of complications after the intervention, considering the waiting time for the procedure, with the type of setting (inpatient or outpatient) as the grouping variable, was also assessed and considered a marker of success. Intervention success was defined by mortality, the occurrence of an embolic event, acute decompensation of HF, or acute myocardial infarction within 30 days after the intervention. The result was not statistically significant (p=0.071), indicating there was no correlation between the wait time for the procedure and intervention success (Table 7). Only for the outpatient group did there appear to be a higher incidence of acute decompensation of HF in the month following the intervention.
Complications after 30 days in patients in the outpatient and inpatient settings.
| Total (n=241) | p value | ||
|---|---|---|---|
| Outpatient (n=185) | Inpatient (n=56) | ||
| Complications after intervention | 14 | 5 | 0.071 |
| Death | 1 | 2 | 0.186 |
| Embolic event | 4 | 1 | 0.709 |
| Decompensated heart failure | 8 | 0 | 0.026 |
| Acute myocardial infarction | 0 | 1 | 0.086 |
| Other | 1 | 0 | 0.421 |
Results are expressed as n (%).
According to the surgical procedure performed, the sample was divided into three groups based on surgical complexity: isolated aortic valve intervention, aortic valve intervention associated with coronary artery bypass grafting, and aortic valve intervention associated with another type of procedure, such as interventions on other heart valves, myomectomies, or ascending aorta interventions (Table 8).
Waiting time according to the type of surgical intervention performed.
| Total (n=183) | Waiting days | p value | |
|---|---|---|---|
| Isolated aortic valve intervention | 101 | 185.45 (142.7) | 0.673 |
| Aortic valve intervention+CABG | 32 | 187.1 (129.8) | |
| Aortic valve intervention+other procedures | 42 | 175.6 (140.8) | |
| Aortic valve intervention+CABG+other procedures | 8 | 236.6 (145) |
Results are expressed as mean±SD. CABG: coronary artery bypass grafting; SAVR: surgical aortic valve replacement.
Of the 193 patients who underwent SAVR, the type of intervention could only be determined for 183. No statistically significant differences were found between the type of intervention performed and the wait time for the intervention (p=0.673).
DiscussionOur study showed (1) a significant predominance of SAVR over percutaneous valve intervention (SAVR: 83.9% vs. TAVI: 16.1%); (2) wait times in the outpatient setting were considerably higher than recommended (median of 226 days for SAVR and 426 days for TAVI); (3) a progressive increase in adverse cardiovascular events, namely hospitalization due to HF and mortality, relative to the waiting time in the outpatient setting; (4) waiting times for SAVR and TAVI in the inpatient setting were in line with the recommended guidelines.15,16,22
Approximately 84% of patients underwent SAVR. Data regarding TAVI show that in Portugal, there is underutilization of this intervention compared to other European countries. In January 2017, we were performing about 40 TAVI procedures per million inhabitants, with this number increasing to 72 in 2019 after being included in the Valve for Life initiative.23 In Germany, France, and the UK, TAVI is already preferred over SAVR, and is performed in about 71.9% of patients undergoing intervention.13
The Portuguese Society of Cardiology and the Portuguese Society of Thoracic and Cardiovascular Surgery published a consensus statement on the maximum waiting time for heart surgery. The document sets maximum waiting times of two weeks for patients with severe symptoms, six weeks for patients with mild to moderate symptoms (NYHA class II), and 12 weeks for less severe elective patients.22 As the guidelines for wait times approved by the CCS are more recent, they were used as the reference for this study. For SAVR, the recommended waiting times are 42 days for elective cases and 14 days for urgent cases.15 For TAVI, the recommended waiting times are 84 days for elective cases and 14 days for urgent cases.16
In an inpatient setting, although the waiting time for TAVI is longer than for SAVR, our results are in line with the waiting time limit established by the CCS. However, the waiting times in the outpatient setting were considerably higher than recommended: the median total waiting time for SAVR and TAVI was 226 and 426 days, respectively; the median time-to-decision for SAVR and TAVI was 82 and 319 days, respectively; and the median time from decision to intervention for SAVR and TAVI was 133 and 136 days, respectively.
One possible explanation for these numbers is the likely overload of the surgical center's capacity. Known data in Portugal show that valvular disease accounts for half of the surgical activity in hospitals within the National Health Service network and has consistently increased over the past years. Data from 2015 on Cardiac Surgery showed that Portugal ranks in the middle of the table for the number of cases per million inhabitants (589 cases/million inhabitants), compared to other European countries. However, it has the lowest number of centers per million inhabitants (0.6 centers/million inhabitants).22 However, there are no similar published data for TAVI yet. On the other hand, it was observed that the vast majority of patients undergoing TAVI at the center where this study was conducted first attend a thoracic cardiac surgery consultation before being referred to the structural interventional cardiology consultation. This referral system, which is not transferable to other hospitals, likely explains the delay in the decision-making process for TAVI: although the time from decision to intervention is similar for both procedures, the time-to-decision for TAVI is nearly four times longer than for SAVR.
A Canadian retrospective study showed that the median waiting time for SAVR was 50 days and for TAVI it was 84 days.24 Additionally, another study evaluated different time intervals in a population of patients undergoing TAVI. Thus, the median total waiting time was 105 days; the median time from referral to decision was 54 days; and the median time from decision to intervention was 34 days.25
In our study, we found that 13% of patients required hospitalization due to HF while on the waiting list, with 70.8% of these undergoing urgent SAVR due to worsening of their condition; mortality on the waiting list reached 6%. Similar studies have shown that the probability of hospitalization on the waiting list ranges from 3.6% to 12%, and the risk of death on the waiting list for SAVR in clinical practice varies from 2% to 14%.24–29
After 90 days on the waiting list, only 4.9% of patients had undergone SAVR. Most patients were intervened after 180 days of waiting, and most of the events occurred after this period. On the other hand, a study conducted at three European centers showed that after three months of waiting, 82.3% of patients had already undergone intervention.13
The wait times in our study are significantly higher compared to other countries in Europe and around the world and are much higher than those recommended by the guidelines, which could impact the mortality and hospitalization of patients on the wait list. With the anticipated increase in the prevalence of AS, if no measures are taken, the overload of surgical centers will become increasingly noticeable. In fact, regarding cardiac surgery, we are facing a higher average number of cases per surgical center compared to most European countries. On the other hand, the number of TAVI interventions performed in Portugal per million inhabitants, compared to other European countries, is substantially lower.
The conducted study should be interpreted in the context of several limitations. Firstly, the sample size: the data collection method used did not allow us to assess the actual number of patients intervened over the four years, as patients who underwent echocardiography at an external facility to the Hospital of Braga were not included in the study. Secondly, this study only evaluated the occurrence of surgical complications or adverse events within 30 days after the valve intervention. It would be interesting to extend the follow-up period for patients after intervention, as some recovery quality markers (echocardiographic, clinical, analytical findings, etc.) require more time to become evident. On the other hand, the center where the study was conducted does not have a cardiac surgery service or a structural intervention team for TAVI placement, so the results may differ from centers with these same capabilities. Finally, our study is observational, so there may be confounding factors associated with it, and it is single-center, which limits the extrapolation of waiting times to other regions of the country.
ConclusionIn summary, in the studied population, the most frequent valve intervention for the treatment of severe AS is SAVR. In both settings, the wait time for TAVI is longer than for SAVR. In the outpatient setting, the waiting times found in our study are considerably higher than those recommended. Prolonged wait times in the outpatient setting are associated with adverse events, namely hospitalization and mortality while on the waiting list.
In the future, this study could serve as a reference for analyzing wait time management in other surgical centers. Equally important is the reflection within the community of cardiologists, cardiac surgeons, and interventional cardiologists on the quality of management for patients with severe AS in Braga.
Ethical approvalBraga Hospital Ethics Commission. Reference number: 60_2022.
Conflicts of interestThe authors declare no conflicts of interest.
