


The electrocardiogram continues to be essential in the diagnosis of acute myocardial infarction, and a useful tool in arrhythmic risk stratification. We aimed to determine which electrocardiographic variables can successfully predict the occurrence of ventricular arrhythmias (VA) in patients following ST-segment elevation myocardial infarction (STEMI).
MethodsWe performed an observational study including 667 patients with STEMI admitted to the University Hospital in Sancti Spíritus, Cuba. Demographic variables, cardiovascular risk factors, and clinical variables were recorded. Electrocardiographic variables included QT interval duration (measured and corrected) and QT dispersion, QRS duration and dispersion, JT interval duration and ST-segment elevation magnitude. We also determined left ventricular ejection fraction and glomerular filtration rate. A binary statistical regression model and a regression tree were used to determine the variables that successfully predicted VA.
ResultsVA occurred in 92 (13.8%) patients, within the first 48 hours in 68 (73.9%) and after this period in 24 (26.1%) patients. The variables associated with VA were QT interval duration >529 ms and QT dispersion >66 ms, QRS dispersion >50 ms, and the presence of ST-segment elevation in six or more leads.
ConclusionsThe main predictor of VA occurring during the initial 48 hours was QT interval duration, while, after this period, it was QRS dispersion.
O eletrocardiograma continua a ser essencial no diagnóstico de enfarte agudo do miocárdio e é uma ferramenta útil na estratificação de risco de arritmias. O nosso objetivo consistiu em determinar quais as variáveis eletrocardiográficas que podem prever a ocorrência de arritmias ventriculares em doentes pós-enfarte do miocárdio com elevação do segmento ST.
MétodosEfetuámos um estudo observacional em 667 doentes com enfarte do miocárdio com elevação do segmento ST admitidos no University Hospital de Sancti Spíritus, Cuba. As variáveis demográficas, os fatores de risco cardiovasculares, assim como as variáveis clínicas foram registadas. As variáveis eletrocardiográficas incluíram a duração do intervalo QT (não corrigida e corrigida) e a dispersão do QT, a duração e a dispersão do QRS, a duração do interval JT e a dimensão da elevação do segmento ST. Também determinámos a fração de ejeção ventricular esquerda e a taxa de filtração glomerular. O modelo binário de regressão estatística e uma árvore de regressão foram utilizados para determinar as variáveis que previssem com sucesso as arritmias ventriculares.
ResultadosAs arritmias ventriculares ocorreram em 92 (13,8%) doentes, no período de 48 horas em 68 (73,9%) e após este período em 24 (26,1%). As variáveis associadas a arritmia ventricular foram: duração do intervalo QT >529 ms e dispersão do QT >66 ms, dispersão do QRS >50 ms e a presença da elevação do segmento ST em seis ou mais elétrodos.
ConclusõesO principal fator preditor de arritmias ventriculares durante as 48 horas iniciais pós STEMI foi a duração do intervalo QT, enquanto, após este período, foi a dispersão do QRS.
The risk of death and complications following ST-elevation myocardial infarction (STEMI) remains high in spite of significant scientific advances. According to European Union data, in-hospital mortality due to myocardial infarction (MI) varies between 4 and 12%1; 80% of all deaths occur in middle- or low-income nations.2 In Cuba, the mortality rate due to MI in 2018 was 65.3 per 100 000 population, accounting for almost half of all deaths due to ischemic heart disease.3
Potentially life-threatening ventricular arrhythmias (VA) are clearly associated with mortality in patients with ischemic heart disease.4,5 VA are more frequent in patients with prolonged ischemic time before initial medical contact, cardiogenic shock, infarctions affecting a large amount of myocardial mass, and incomplete revascularization.6 VA occurring 48 hours or more after STEMI onset are associated with higher mortality rates, but the prognostic significance of VA in the first 48 hours is controversial.6,7 Kosmidou et al.8 report that sustained VA occurring prior to revascularization increase the risk of mortality at three-year follow-up (hazard ratio 2.62; 95% confidence interval [CI] 1.48-4.61; p<0.001). Other studies suggest that VA in the first 48 hours may be associated with increased risk of in-hospital mortality, but have no prognostic implications in the long term.9–12
In the setting of MI, the first ECG is diagnostic in 60% of cases, non-diagnostic with abnormal findings in 25% and normal in 15%. Typical electrocardiographic changes occur in 90% of cases when the culprit artery is the left anterior descending, in 70-80% of patients if the right coronary artery is involved, and in only 50% when the left circumflex is the culprit artery.13 Current European guidelines on STEMI management recommend performing an ECG within 10 minutes of first medical contact.1
Identifying electrocardiographic signs that enable successful prediction of the risk of sudden death in patients with STEMI remains a major challenge. Electrocardiographic variables that have been studied include QT interval duration and dispersion,14 QRS complex duration and dispersion,15–17 T-peak-to-T-end interval (Tp-e),18,19 Tp-e/QT ratio,20 and QRS and ST-segment abnormalities.21
Identification of arrhythmic risk remains a gap in the evidence according to STEMI guidelines published in 2018.1 The standard ECG is a useful and widely available tool which can be incorporated in stratification algorithms. The aim of this study is to determine which electrocardiographic variables can successfully predict the occurrence of VA in patients following STEMI.
MethodsStudy design and populationWe performed an observational study including all patients diagnosed with STEMI admitted to the coronary care unit of Camilo Cienfuegos University Hospital, Sancti Spíritus, Cuba, between January 1, 2013 and March 31, 2018. STEMI diagnosis was defined as a new ST-segment elevation measured at the J point (cut-points: ≥2.5 mm in men aged <40 years, ≥2 mm in men aged ≥40 years, or ≥1.5 mm in women in leads V2-V3, and/or ≥1 mm in other leads, in the absence of left ventricular hypertrophy) in at least two contiguous leads,1 in the setting of typical angina. A total of 769 patients were enrolled, of whom those with left bundle branch block or previous atrial fibrillation, those receiving treatment with drugs known to prolong the QT interval, with life expectancy less than one year due to a non-cardiac condition, or with a history of previous MI, were excluded. After application of the exclusion criteria, the study group comprised 667 patients, divided into two groups depending on the presence or absence of VA, defined as more than three premature ventricular beats.
Clinical variablesThe following demographic and clinical variables were collected for each patient: cardiovascular risk factors (hypertension, previous ischemic heart disease, hypercholesterolemia, tobacco use, chronic obstructive pulmonary disease [COPD], diabetes, obesity), systolic blood pressure, diastolic blood pressure and heart rate at admission, and pharmacological treatment used during hospitalization. Killip class22 was used to assess the degree of acute heart failure. MI location from the first recorded ECG was classified as proposed by Bayés de Luna (large anterior, mid-anterior, anteroapical, septal, inferior, inferolateral and lateral).23 Left ventricular ejection fraction (LVEF) was determined by transthoracic echocardiography using the biplane Simpson method. Glomerular filtration rate (GFR) was calculated using the Cockcroft-Gault formula; in women the result was multiplied by 0.85.24 No patients underwent primary percutaneous coronary intervention (PCI), due to unavailability of a cardiac catheterization laboratory.1 Reperfusion therapy was based on thrombolysis (1 500 000 UI intravenous streptokinase).
Electrocardiographic variablesElectrocardiographic variables were obtained from the ECG performed at admission and every 24 hours during hospitalization. The ECG trace was recorded at a paper speed of 25 mm/sec and voltage gain of 10 mm/mV. Two observers independently measured the following parameters manually and using a magnifying glass from each ECG lead:
- •
QT interval (QTi): measured in ms as the time from the beginning of the QRS complex to the end of the T wave (point of return of the T wave to the baseline, or the nadir between the T and U waves if the latter is present or measured by drawing a tangent to the descending limb of the T wave), measured in all 12 leads and then averaged.
- •
Corrected QT interval (QTc): corrected using Bazett's formula.25
- •
QT dispersion (QTd): the difference between minimum and maximum QTi.
- •
Corrected QT dispersion (QTcd): the difference between minimum and maximum corrected QTi.
- •
QRS duration: measured in ms as the time from the beginning to the end of the QRS complex, measured in each of the 12 leads.
- •
QRS dispersion: the difference between minimum and maximum QRS duration.
- •
JT interval: measured in ms from the end of the QRS to the end of the T wave, measured in each of the 12 leads.
- •
ST elevation >1 mV: measured in all leads where present, from the baseline to the J point, taking the TP segment as the baseline.
- •
ST depression >1 mV: measured in all leads where present, from the baseline to the point of maximum depression, taking the TP segment as the baseline.
- •
ST elevation in aVR, and number of leads with ST elevation. Extensive ST elevation was defined as the presence of ST elevation in six or more leads.
Data were collected on the record form (Appendix 1) and statistical analysis was performed using a database created with IBM SPSS® version 21.0 for Windows, using variables from the record form. Continuous data were summarized as means and standard deviation. Categorical data were expressed as absolute values and percentages. Normality of distribution of variables was verified through the Kolmogorov-Smirnov test with a significance threshold of p=0.05. Comparison of quantitative variables between groups, in cases of normal distribution, was performed with the Student's t test for independent samples; if the distribution was non-normal the Mann-Whitney nonparametric test was used. The strength of association between qualitative variables was determined through Pearson's nonparametric chi-square test. When more than 20% of the expected frequencies were less than 5, Fisher's exact test was used. For statistical validation of the study results, a level of significance of 95% (p<0.05) was adopted for the degrees of freedom previously fixed in each case.
To determine the main predictive factors of VA, a forward stepwise binary statistical regression model was created and likelihood ratios were used for to select the variables.
To determine the significance of each predictor in the prognosis, a classification tree model was used. The splitting method used during the growing of the tree was the exhaustive chi-squared automatic interaction detector algorithm, with 10-fold cross-validation. Using the results of this multivariate analysis it was determined which variables were significantly and independently associated with a higher mortality risk (p<0.05).
Ethical aspectsThe principles of the Declaration of Helsinki26 were respected, and the study was approved by the hospital's ethics committee. All patients were informed about the research and informed consent was obtained; for critical or unconscious patients it was provided by a first-degree relative. Patient names were not included in the database, and information allowing patient identification was also avoided in order to respect patient privacy and confidentiality.
ResultsVA were recorded in 92 patients (13.8%), occurring within 48 hours of STEMI onset in 68 and after this period in the other 24 patients. In-hospital mortality was higher among patients who presented VA. Mean age, gender distribution, and cardiovascular risk factors were similar in the VA and control groups. Regarding clinical variables obtained at admission, heart rate showed lower means among patients who presented VA, although with no statistically significant difference (Table 1). Mortality is analyzed in Figure 1.
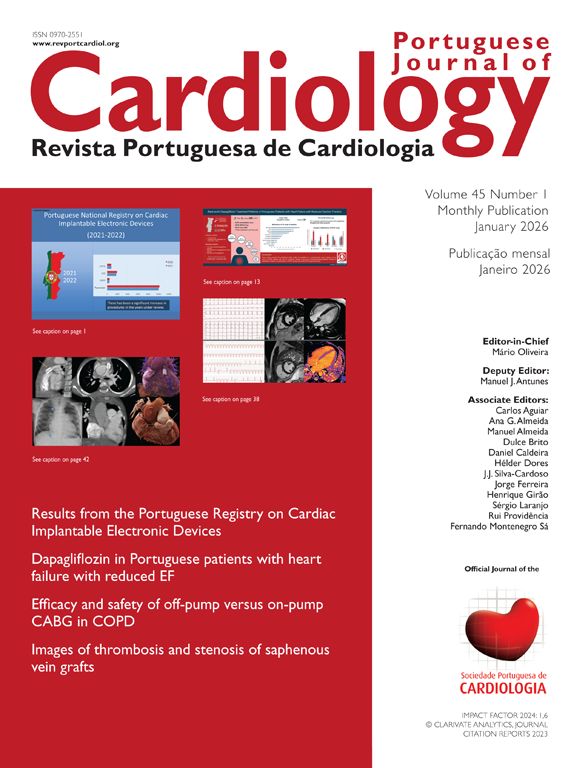
Main findings of the variables studied on admission.
| Variables | With VA ≤48 hours | Without VA ≤48 hours | p | With VA >48 hours | Without VA >48 hours | p |
|---|---|---|---|---|---|---|
| 68 (10.2%) | 599 (89.8%) | 24 (3.6%) | 643 (96.4%) | |||
| Demographic variables | ||||||
| Age, years | 68.7±12.7 | 67.3±12.8 | 0.379 | 69.2±12.8 | 67.3±12.8 | 0.490 |
| Male, n (%) | 47 (69.1%) | 394 (65.8%) | 0.581 | 13 (54.2%) | 428 (66.6%) | 0.208 |
| Female, n (%) | 21 (30.8%) | 205 (34.2%) | 11 (45.8%) | 215 (33.4%) | ||
| Risk factors, n (%) | ||||||
| Hypertension | 57 (83.8%) | 472 (78.8%) | 0.320 | 19 (79.2%) | 510 (79.3%) | 0.986 |
| Diabetes | 23 (33.8%) | 177 (29.5%) | 0.466 | 9 (37.5%) | 191 (29.7%) | 0.413 |
| Hypercholesterolemia | 9 (13.2%) | 87(14.5%) | 0.774 | 3 (12.5%) | 93 (14.5%) | 0.788 |
| Smoking | 36 (52.9%) | 344 (57.4%) | 0.479 | 14 (58.3%) | 366 (56.9%) | 0.891 |
| History of CAD | 34 (50.0%) | 263 (43.9%) | 0.338 | 13 (54.2%) | 284 (44.2%) | 0.333 |
| Obesity | 16 (23.5%) | 166 (27.7%) | 0.635 | 12 (50.0%) | 171 (26.6%) | 0.012 |
| COPD | 14 (20.6%) | 140 (23.3%) | 0.606 | 5 (20.8%) | 149 (23.2%) | 0.789 |
| Clinical variables (at admission) | ||||||
| Heart rate, bpm | 84.3±24.7 | 81.2±24.4 | 0.329 | 88.9±26.9 | 81.25±24.3 | 0.131 |
| SBP, mmHg | 109.9±38.9 | 113.3±39.1 | 0.498 | 100.0±42.3 | 113.5±38.9 | 0.098 |
| DBP, mmHg | 65.0±26.8 | 67.9±25.1 | 0.365 | 58.3±27.9 | 67.9±25.1 | 0.065 |
| Electrocardiographic variables | ||||||
| QTc, ms | 505.2±96.6 | 452.3±85.5 | <0.001 | 489.5±85.3 | 456.5±87.4 | 0.072 |
| QTcd, ms | 78.8±30.5 | 65.7±31.6 | <0.001 | 86.9±36.0 | 66.3±31.4 | 0.002 |
| QRS duration, ms | 106.8±9.9 | 96.8±7.7 | <0.001 | 105.0±8.8 | 97.5±8.4 | <0.001 |
| QRS dispersion, ms | 44.7±12.9 | 35.4±12.0 | <0.001 | 46.3±12.4 | 35.9±12.3 | <0.001 |
| JT interval, ms | 322.9±53.0 | 300.9±50.8 | <0.001 | 305.4±55.4 | 303.9±51.5 | 0.888 |
| ST elevation >1 mV, n (%) | 21 (30.9%) | 166 (27.7%) | 0.581 | 7 (29.2%) | 180 (28.0%) | 0.900 |
| ST depression >1 mV, n (%) | 18 (26.5%) | 158 (26.4%) | 0.987 | 6 (25.0%) | 170 (26.4%) | 0.875 |
| ST elevation in aVR, n (%) | 4 (5.9%) | 16 (2.7%) | 0.141 | 1 (4.2%) | 19 (3.0%) | 0.733 |
| ST elevation in >6 leads, n (%) | 19 (27.9%) | 83 (13.9%) | 0.002 | 11 (45.8%) | 91 (14.2%) | <0.001 |
| Reperfusion therapy, n (%) | ||||||
| Fibrinolysis | 39 (57.4%) | 321 (53.6%) | 0.555 | 11 (45.8%) | 349 (54.3%) | 0.415 |
| No reperfusion | 20 (29.4%) | 189 (31.6%) | 0.718 | 11 (45.8%) | 198 (30.8%) | 0.119 |
| Drug therapy, n (%) | ||||||
| Beta-blocker | 39 (57.4%) | 313 (52.3%) | 0.425 | 14 (58.3%) | 338 (52.6%) | 0.578 |
| ACEI | 62 (91.2%) | 507 (84.6%) | 0.149 | 18 (75.0%) | 551 (85.7%) | 0.146 |
| Statin | 47 (69.1%) | 433 (72.3%) | 0.581 | 18 (75.0%) | 462 (71.9%) | 0.736 |
| Aspirin | 66 (97.1%) | 562 (93.8%) | 0.281 | 23 (95.8%) | 605 (94.1%) | 0.721 |
| Clopidogrel | 60 (88.2%) | 544 (90.8%) | 0.490 | 23 (95.8%) | 581 (90.4%) | 0.368 |
| LMWH | 68 (100.0%) | 596 (99.5%) | 0.559 | 23 (95.8%) | 641 (99.7%) | 0.083 |
| Dobutamine | 6 (8.8%) | 43 (7.2%) | 0.622 | 4 (16.7%) | 45 (7.0%) | 0.075 |
| Killip class, n (%) | ||||||
| I | 28 (41.2%) | 309 (51.6%) | 0.423 | 14 (58.3%) | 323 (50.2%) | 0.170 |
| II | 18 (26.5%) | 139 (23.2%) | 3 (12.5%) | 154 (24.0%) | ||
| III | 16 (23.5%) | 108 (18.0%) | 3 (12.5%) | 121 (18.8%) | ||
| IV | 6 (8.8%) | 43 (7.2%) | 4 (16.7%) | 45 (7.0%) | ||
| MI location, n (%) | ||||||
| Anteroapical | 12 (17.7%) | 64 (10.7%) | 0.005 | 4 (16.7%) | 72 (11.2%) | <0.001 |
| Large anterior | 19 (27.9%) | 83 (13.9%) | 11 (45.8%) | 91 (14.2%) | ||
| Mid-anterior | 11 (16.2%) | 124 (20.7%) | 1 (4.2%) | 134 (20.8%) | ||
| Inferior | 16 (20.7%) | 261 (43.6%) | 3 (12.5%) | 274 (42.6%) | ||
| Inferior plus right ventricle | 1 (1.5%) | 12 (2.0%) | 0 (0.0%) | 13 (2.0%) | ||
| Inferolateral | 5 (7.4%) | 36 (6.0%) | 5 (20.8%) | 36 (5.6%) | ||
| Lateral | 4 (5.9%) | 15 (2.5%) | 0 (0.0%) | 19 (3.0%) | ||
| Septal | 0 (0.0%) | 4 (0.7%) | 0 (0.0%) | 4 (0.6%) | ||
| Other variables | ||||||
| LVEF, % | 42.6±11.6 | 46.8±10.9 | 0.003 | 42.9±11.3 | 46.5±10.9 | 0.123 |
| GFR, ml/min/1.73 m2 | 78.5±24.9 | 83.1±27.5 | 0.184 | 77.4±30.8 | 82.9±27.2 | 0.336 |
| Blood glucose, mmol/l | 7.3±1.6 | 7.2±1.9 | 0.760 | 8.3±3.2 | 7.2±1.8 | 0.004 |
| Cholesterol, mmol/l | 4.9±1.7 | 4.8±1.5 | 0.551 | 4.4±0.8 | 4.8±1.5 | 0.207 |
| White cell count, 109/l | 10.4±1.9 | 10.6±1.8 | 0.368 | 10.8±1.3 | 10.6±1.8 | 0.664 |
| Hemoglobin, g/l | 11.3±1.9 | 11.5±1.7 | 0.326 | 10.8±1.6 | 11.5±1.8 | 0.066 |
| Peak CK, U/l | 1828.4±620.4 | 1935.3±536.3 | 0.126 | 1966.6±587.6 | 1922.9±544.8 | 0.700 |
| Sodium (Na+), mEq/l | 139 | 137 | 0.234 | 138 | 141 | 0.187 |
| Potassium (K+), mEq/l | 3.9 | 4.1 | 0.082 | 3.8 | 3.7 | 0.972 |
| Chorine (Cl-), mEq/l | 99 | 102 | 0.991 | 101 | 103 | 0.098 |
| Magnesium, mEq/l | 1.8 | 1.9 | 0.854 | 1.7 | 1.9 | 0.067 |
| Deceased, n (%) | 23 (33.8%) | 54 (9.0%) | <0.001 | 11 (45.8%) | 66 (10.3%) | <0.001 |
ACEI: angiotensin-converting enzyme inhibitor; bpm: beats per minute; CAD: coronary artery disease; DBP: diastolic blood pressure; GFR: glomerular filtration rate; LMWH: low molecular weight heparin; LVEF: left ventricular ejection fraction; QTc: corrected QT interval; QTcd: corrected QT dispersion; SBP: systolic blood pressure; VA: ventricular arrhythmias.

Electrocardiographic variables that were significantly associated with VA were QTi duration and dispersion, QRS duration and dispersion, JT duration, and the presence of ST elevation in six or more leads.
The use of reperfusion therapy (thrombolysis) was similar in both groups. It was not performed in 307 patients due to the following reasons: 127 (41.4%) due to prolonged ischemic time, 82 (26.7%) due to no initial diagnosis, 37 (12.1%) due to cardiogenic shock, 21 (6.8%) due to previous hemorrhagic stroke, 14 (4.6%) due to prolonged cardiopulmonary resuscitation, 11 (3.6%) due to known bleeding disorder, nine (2.9%) due to transient ischemic attack in the previous six months, and six (2.0%) due to gastrointestinal bleeding in the last month.
No significant differences were observed in Killip class or pharmacological treatment. Aspirin and clopidogrel were used in more than 90% of patients. VA were more frequent in cases of large anterior MI. GFR was lower in patients who presented VA, although without statistical significance.
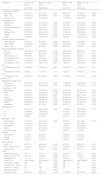
The multivariate analysis showed the following variables to be electrocardiographic predictors of VA with statistical significance: QT duration and dispersion, QRS duration and dispersion, and the presence of ST elevation in six or more leads (Table 2). The cut-points used are shown in the table.4,14,27–29
Binary logistic regression of the main electrocardiographic predictors of ventricular arrhythmias.
| Variables | B | Sig | Exp(B) | 95% CI for exp(B) | |
|---|---|---|---|---|---|
| Lower | Higher | ||||
| >6 leads with ST elevation | 0.881 | 0.002 | 2.415 | 1.389 | 4.196 |
| QTc ≥480 ms | 0.547 | 0.031 | 1.728 | 1.053 | 2.836 |
| QRS duration ≥100 ms | 1.814 | 0.017 | 6.137 | 1.383 | 27.234 |
| QRS dispersion ≥40 ms | 0.798 | 0.010 | 2.222 | 1.206 | 4.092 |
| QTcd ≥60 ms | 0.593 | 0.033 | 1.810 | 1.049 | 3.121 |
| JT interval ≥400 ms | 0.871 | 0.085 | 2.388 | 0.887 | 6.429 |
| Constant | -4.945 | 0.000 | 0.007 | ||
CI: confidence interval; QTc: corrected QT interval; QTcd: corrected QT dispersion.
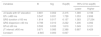
LVEF was related to electrocardiographic measurements (QRS dispersion and QTcd) (Table 3).
Relationship between electrocardiographic measurements and left ventricular ejection fraction.
| Variables | LVEF <45% | LVEF ≥45% | Student's t test | p | 95% CI for exp(B) |
|---|---|---|---|---|---|
| QRS dispersion | 38.1 (12.6) | 35.0 (12.2) | 3.172 | 0.002 | 1.16-4.95 |
| QTcd | 70.4 (32.4) | 64.4 (30.9) | 2.408 | 0.016 | 1.09-10.78 |
CI: confidence interval; LVEF: left ventricular ejection fraction; QTcd: corrected QT dispersion.
Two regression tree models were created in order to stratify predictors according to the occurrence of VA within 48 hours of STEMI or later.
The regression tree model for arrhythmia occurring within 48 hours (early VA) showed QTi greater than 529 ms as the main predictive variable, the second predictor as QTcd greater than 66 ms, and the third as the presence of ST elevation in six or more leads (Figure 2). In the case of VA occurring after more than 48 hours (late VA), the main predictive variable was QRS dispersion greater than 50 ms and the second was the presence of ST elevation in six or more leads (Figure 3).


Our results highlight the importance of analyzing the electrocardiogram to predict the occurrence of VA after STEMI. In our study QTi was an important predictor of VA within 48 hours of STEMI onset, while QRS dispersion was the main predictor of arrhythmias after this period.
Jiménez-Candil et al.27 found that QTc ≥450 ms was an independent predictor of risk of death or recurrent ischemia (adjusted odds ratio [OR] 3.8; 95% CI 2.5-6.5; p<0.001). Also, a meta-analysis including 23 observational studies concluded that the relative risk of sudden death and death due to coronary artery disease, in patients with higher compared to lower QT duration, was 1.44 and 1.71, respectively.28 Another marker found to be statistically significant in the present study was QTd, agreeing with the results of Chavez et al.,28 who identified ischemic heart disease, hypertension, and diabetes as variables associated with QTcd greater than 50 ms.
In our patient group, QRS dispersion was the main predictor of late VA. A previous study showed a stronger association between QRS dispersion and VA during the early phases of STEMI compared to QTd, but in that study the course of time was not taken into account.29 Various mechanisms of VA (increased automaticity, triggered activity, reentry) may be found in patients with MI. Focal activity due to abnormal automaticity is the predominant mechanism initiating tachycardia in acute ischemia. Increased potassium levels secondary to opening of KATP channels cause shortening of repolarization, leading to slow conduction and inexcitability. The resulting inhomogeneity of depolarization increases QTi and QRS dispersion during acute ischemia.30–32 There is also increased sympathetic activity.33 In our study, QRS dispersion, a reflection of heterogeneity of depolarization, becomes the main predictor of VA after 48 hours, suggesting a dynamic and time-dependent pathophysiology of MI-associated arrhythmias, which could be important when deciding the most appropriate pharmacological therapy.33 In the reviewed literature, we found no similar studies demonstrating QRS dispersion as a VA predictor more than 48 hours after STEMI onset.
The role of QRS duration in predicting complications of MI has been previously studied.15–17 When QRS duration is greater than 120 ms there is delayed depolarization of the left ventricular lateral wall that is related to reduced LVEF.26,34 Taskensen et al.35 found that QRS duration between 90 and 120 ms is associated with adverse events, lower LVEF and greater severity of the underlying coronary artery disease. Another prospective cohort study showed that, for every 10 ms increase in QRS duration, the risk of sudden death increases by 27%, and patients with a QRS duration greater than 110 ms had a 2.5-fold higher risk of sudden death.29
The presence of ST elevation in six or more leads was the second strongest VA predictor within 48 hours. Clemmensen et al.36 described a method to estimate the area of saved myocardium by considering the difference between the actual size of the infarction and the size predicted by the ST elevation. Hathaway et al.37 found that the sum of the absolute ST deviation greater than 19 mm and QRS duration greater than 100 ms were strong predictors of 30-day mortality (OR 1.53; 95% CI 1.38-1.69). Mauri et al.38 also described a relationship between the number of involved leads and worse prognosis.
In our series mortality was higher in patients who presented VA. In the GUSTO I trial, designed to compare thrombolytic strategies, 10% of patients presented VA. In-hospital and 30-day mortality were significantly higher in patients who presented VA regardless of the time of onset, within 48 hours or later.38 On the other hand, in the HORIZONS-AMI trial,39 5.2% of patients presented VA following PCI, with 85% occurring in the first 48 hours. There was no association between VA and mortality after three years of follow-up. This suggests the relationship between mortality and VA may be influenced by reperfusion therapy.
The results we present could be useful in middle- or low-income countries, where there is a need for ways to deliver high-quality medical care at a lower cost. The latest advances in technology are not universally available but our country opts for high-quality medical care using available resources.
Study limitationsWe analyzed a small sample of patients, and so the results obtained need to be reproduced and assessed in a larger population. Furthermore, these are data from patients with STEMI treated with streptokinase and cannot be extrapolated to patients revascularized by primary PCI.
ConclusionsThe ECG represents a useful tool to stratify the risk of VA in patients with STEMI. The main predictor of VA occurring within 48 hours of STEMI onset was QTd, while, for those occurring after this period, it was QRS dispersion, probably reflecting changes in arrhythmogenic mechanisms dependent on the time course of ischemia.
Sources of fundingNone.
Conflicts of interestThe authors have no conflicts of interest to declare.
None.
The following are the supplementary material to this article:

