


Echocardiography guidelines suggest normalizing left ventricular (LV) volumes and mass (LVM) to body size. During pregnancy, continuous weight variation impacts on body surface area (BSA) calculation, limiting the longitudinal analysis of cardiac remodeling (CR) and reverse remodeling (RR) variables. Our aim was to identify the most common indexing methodologies in the literature on pregnant populations through a systematic review; and, to compare four scaling methods: (i) none (absolute values); (ii) indexing to the BSA before pregnancy; (iii) allomeric indexing; and (iv) indexing to BSA measured at the same day of cardiac assessment, using an illustrative example.
MethodsWe performed a systematic review of CR and RR during pregnancy and post-partum, using two databases. We included studies reporting longitudinal echocardiographic analysis of cardiac chamber volumes in humans. We used a prospective cohort study of healthy pregnant women who underwent four echocardiographic evaluations during pregnancy and postpartum, as an illustrative example.
ResultsTwenty-seven studies were included, most studies indexed to BSA measured at each evaluation moment (n=21). Within-subjects design was the most reported to analyse longitudinal data (n=17). Indexation to the pre-pregnancy BSA or application of allometric indexes revealed a higher effect than BSA measured at each evaluation and an equal effect to not indexing using within-subjects design. The within-subjects designs also revealed a higher effect size value than the between-subjects design for longitudinal analysis of LVM adaptations during pregnancy and postpartum.
Conclusion(s)This study concludes that indexation methods do not impact the clinical interpretation of longitudinal echocardiographic assessment but highlights the need to harmonize normalization procedures during pregnancy.
As Guidelines de Ecocardiografia Transtorácica recomendam a indexação dos volumes e massa do ventrículo esquerdo à área de superficie corporal (ASC). Durante a gravidez, a contínua variação do peso e consequentemente da ASC poderão influenciar a avaliação da remodelagem cardíaca (RC) e remodelagem reversa (RR). Os objetivos foram identificar as metodologias de indexação mais utilizadas na avaliação ecocardiográfica em gestantes através de uma revisão sistemática; bem como comparar quatro métodos de indexação [i) valores absolutos; ii) indexação ASC prévia à gestação; iii) coeficientes alométricos (CA); iv) indexação à ASC calculada em cada momento de avaliação] utilizando um exemplo ilustrativo.
MétodosA revisão sistemática baseou-se na RC e RR na gestação, recorrendo-se a duas bases de dados. O exemplo ilustrativo baseou-se num estudo de coorte prospetivo que incluiu quatro avaliações ecocardiográficas durante a gestação e pós-parto.
ResultadosForam incluídos 27 estudos, em que na maioria foi aplicada indexação das variáveis ecocardiográficas à ASC calculada em cada momento da avaliação (n=21). Os testes estatísticos baseados na variabilidade intra-sujeito foram os mais utilizados para análise longitudinal dos dados (n=17). No exemplo ilustrativo, a indexação à ASC prévia à gestação ou uso de CA demonstraram um tamanho de efeito superior à indexação à ASC calculada em cada momento de avaliação e igual à ausência de indexação, na análise intra-sujeito. Testes estatísticos baseados na variabilidade intra-sujeito demonstraram um tamanho de efeito superior aos baseados na variabilidade inter-sujeito para avaliação longitudinal da massa cardíaca.
ConclusãoO presente estudo revelou a necessidade de harmonização dos métodos estatísticos e indexação das variáveis ecocardiográficas para a avaliação da RC e RR na gravidez.
The European and American guidelines for transthoracic echocardiography recommend indexing the left ventricular size and mass to body surface area (BSA), to enable a more accurate interpretation and comparison of cardiac structural changes between individuals with different body sizes.1 Pregnant women experience continuous BSA variation during gestation and after delivery. This weight change differs significantly between women and is influenced by the women's pre-pregnancy BSA, nutrition and/or physical activity.2,3 Weight changes during pregnancy and postpartum may interfere in the longitudinal analysis of cardiac remodeling (CR) and reverse remodeling (RR) processes (within-group variation) and in the comparison between distinct study groups, e.g., healthy versus pregnant women with cardiovascular risk factors (between-group variation).
In this context, evaluating the most appropriate normalization method for assessing structural and hemodynamic cardiac changes throughout pregnancy and postpartum becomes highly relevant.
We identified four possible methods to display cardiac remodeling during pregnancy, puerperium and postpartum periods: (1) none (absolute values) without indexing; (2) indexing to the baseline BSA (before pregnancy); (3) allometric indexing; or (4) indexing to BSA measured on the same day as the cardiac assessment.
Out of the aforementioned methods, only method four takes into consideration weight variation of the pregnant women throughout gestation, while methods (1), (2) and (3) overlook the effect of fetus development and maternal adaptations as crude values, baseline BSA (before pregnancy), or allometric indexes, respectively are used. Accordingly, the first three methods do not account for the extra weight from the fetus (such as placenta and blood volume expansion) and for the interpretation of CR and RR.
There is consensus that using absolute values, without any indexation, to compare groups may lead to bias in the results. Vinayagam et al. highlighted the relevance of correcting for BSA when comparing subjects with a wide range of body shapes and sizes, as is standard practice in pediatric cardiology.4 However, the ideal methodology for indexing and embracing fetus development when studying cardiac hemodynamics and structure in pregnancy is still missing.
Furthermore, using a between-subjects or within-subjects design will yield distinct results since the individual variation is not taken into account in the within-subjects test.
ObjectivesThe purposes of this study were to: (1) identify the most common indexing methodologies in the literature for the pregnant population through a systematic review and (2) compare four methods using an illustrative example from a longitudinal cohort of pregnant women evaluated at four time points (before and after delivery).
MethodsSystematic reviewThis systematic review complies with PRISMA statement.5
Eligibility criteriaThe search was limited by publication date (1 August 2016 and 1 August 2021) and study language. We included original articles (clinical trials, cohort studies, registry-based cohort studies, case–control studies) with longitudinal echocardiographic analysis of CR and RR during pregnancy and post-partum (quantification of left atrium volume, LV mass, LV end-diastolic or end-systolic volumes) in humans. We excluded case reports or case series, abstract proceedings and original studies with cardiac assessments other than transthoracic echocardiography.
Search strategyA systematic search was performed on the MEDLINE and Web of Sciences Core Collection databases. A manual search was done on reference lists of the included articles. The search strategy included six search components: pregnancy, echocardiography, publication date and article language, excluding offspring terms and specific publication types. Each component combined MeSH terms (controlled language) and free-text keywords selected by the study authors. The complete search strategy is defined in Table S1.
Selection processOne author (AFF) screened the titles and abstracts of all citations identified by the searches using an online reviewing software (Rayyan Systems Inc., USA). Potentially eligible studies were assessed for inclusion criteria. Reference lists from included articles were also reviewed.
Data extractionData extracted from the selected papers included: author(s) name; year of publication; country; study design; study groups, assessment time points (both during pregnancy or post-partum); recruitment period; total number of participants; number of participants in each study group (if applicable); indexation method; cardiac chambers indexed (LV mass and volumes, and left atrium volume); statistical methods for between-group comparison and for within-group/longitudinal comparison; discussion or comment about indexation methods in the article.
Data analysisResults are presented using descriptive statistics.
Prospective cohort studyA convenience sample of pregnant women who had their first medical appointment at the Obstetrics Department of Centro Hospitalar Universitário de São João, Porto, from March 2019 to April 2021 were invited to participate. Pregnant women aged <18 years, with pre-existing cardiomyopathy, renal disease, chronic obstructive airway disease, active systemic infection, genetic syndromes, type-1 diabetes mellitus, obesity, arterial hypertension or gestational hypertension were excluded.
Women were evaluated at the following time points: (1) first trimester (10–15 weeks, baseline conditions, the initial phase of cardiac remodeling); (2) third trimester (30–35 weeks, peak of cardiac remodeling, when cardiac adaptations are expected to be most prominent); (3) 6–8 weeks after delivery; and (4) 6–7 months after delivery (cardiovascular RR stages to assess cardiac recovery). The evaluation included clinical characterization through questionnaires, clinical examination and cardiac assessment by transthoracic echocardiography.
Ethics and consentAll study participants provided written informed consent. The Ethics Committee of Centro Hospitalar Universitário São João approved this study in November 2018 (ID 201/18). Confidentiality and data anonymity were complied with the guidelines emanating from the Declaration of Helsinki of 1964, revised in Fortaleza, in 2013.
Clinical evaluationClinical evaluation included measurement of blood pressure (after 5-minutes rest, sitting position), height and weight. Body mass index (weight (kg)/height (m)2) and body surface area [Du Bois formula: 0.007184×height (cm)0.725×weight (kg)0.425] were calculated.6
Clinical characterizationMaternal cardiovascular health, obstetric and perinatal outcomes, maternal health-related habits, mother's smoking habits, drinking and medical history were systematically collected. For the present pregnancy, obstetric outcomes (especially, gestational diabetes, type of delivery and gestational age at delivery) were also registered.
Echocardiographic assessmentAt each evaluation moment, a single operator performed conventional transthoracic echocardiography (TTE) with a 3 MHz phased-array probe (ACUSON SC2000 PRIMETM). All images, measurements and variables were obtained from standard views according to the recommendations of the European Society of Cardiology for chamber quantification and diastolic function evaluation and at least three cardiac cycle images were collected for data analysis.7,8 TTE was analyzed and validated by an independent cardiologist and discrepancies were settled by discussion and consensus agreement. Structural parameters in mm (interventricular septum in diastole – IVSd and posterior wall thickness in diastole – PWd, left ventricular internal diameter in diastole – LVEDd and systole – LVESd) and their derived parameters (LV mass and relative wall thickness) were obtained from a 2-dimensional parasternal long-axis view. LV mass was estimated using the following equation 0.8×(1.04×[(LVEDd+PWd+IVSd)3−(LVEDd)3]+0.6).
Left ventricular mass (LVM) was presented according to each previously stated methods: (1) absolute values, without indexing; (2) indexing to the basal (previous pregnancy) BSA; (3) using allometric indexes; or 4) indexing to BSA measured at the same day of cardiac assessment.
Statistical analysisContinuous variables were reported as median, minimum and maximum, and categorical as absolute values and relative frequencies.
To evaluate cardiac structural changes throughout pregnancy and after delivery, we used the Friedman test (F-statistics, for within-subject assessment) and Kruskal–Wallis test (H-statistics, for between-subject assessment), computed for LV mass, using the four indexation methods. Non parametric tests were used because the LV mass values in each time-point period did not reveal a normal distribution (assessed through visual analysis of histograms in tandem with Q–Q plots’ examination). The Friedman test effect size (Kendall's W value) and the Kruskal–Wallis effect size (η2) will be estimated as a standardized metric, regardless of the scale or method used to measure the outcome variable – cardiac chambers dimensions – in (1) absolute value or (2) basal BSA indexed (LVM/basal BSA, using Du Bois formula); or (3) using allometric indexes; or (4) BSA indexed according to TTE moment.
For the third method, allometric indexes were estimated using a constant denominator: height1.7 or height2.7, that have been proposed as an advantage method over indexing to BSA in both normal subjects and obese people, by avoiding within variability.9,10 We sought to discover whether pregnant population could also benefit from this method and used the two most agreed upon methods in the literature. Mathematically, indexation methods (1), (2) and (3) were expected to produce a similar effect size since there is a common denominator for each one: (1) equals to one (e.g., absolute values); (2) equals to basal BSA (constant across evaluation follow-up); (3) equals to height1.7 or height2.7 (constant across evaluation follow-up).
The level of significance was 0.05.
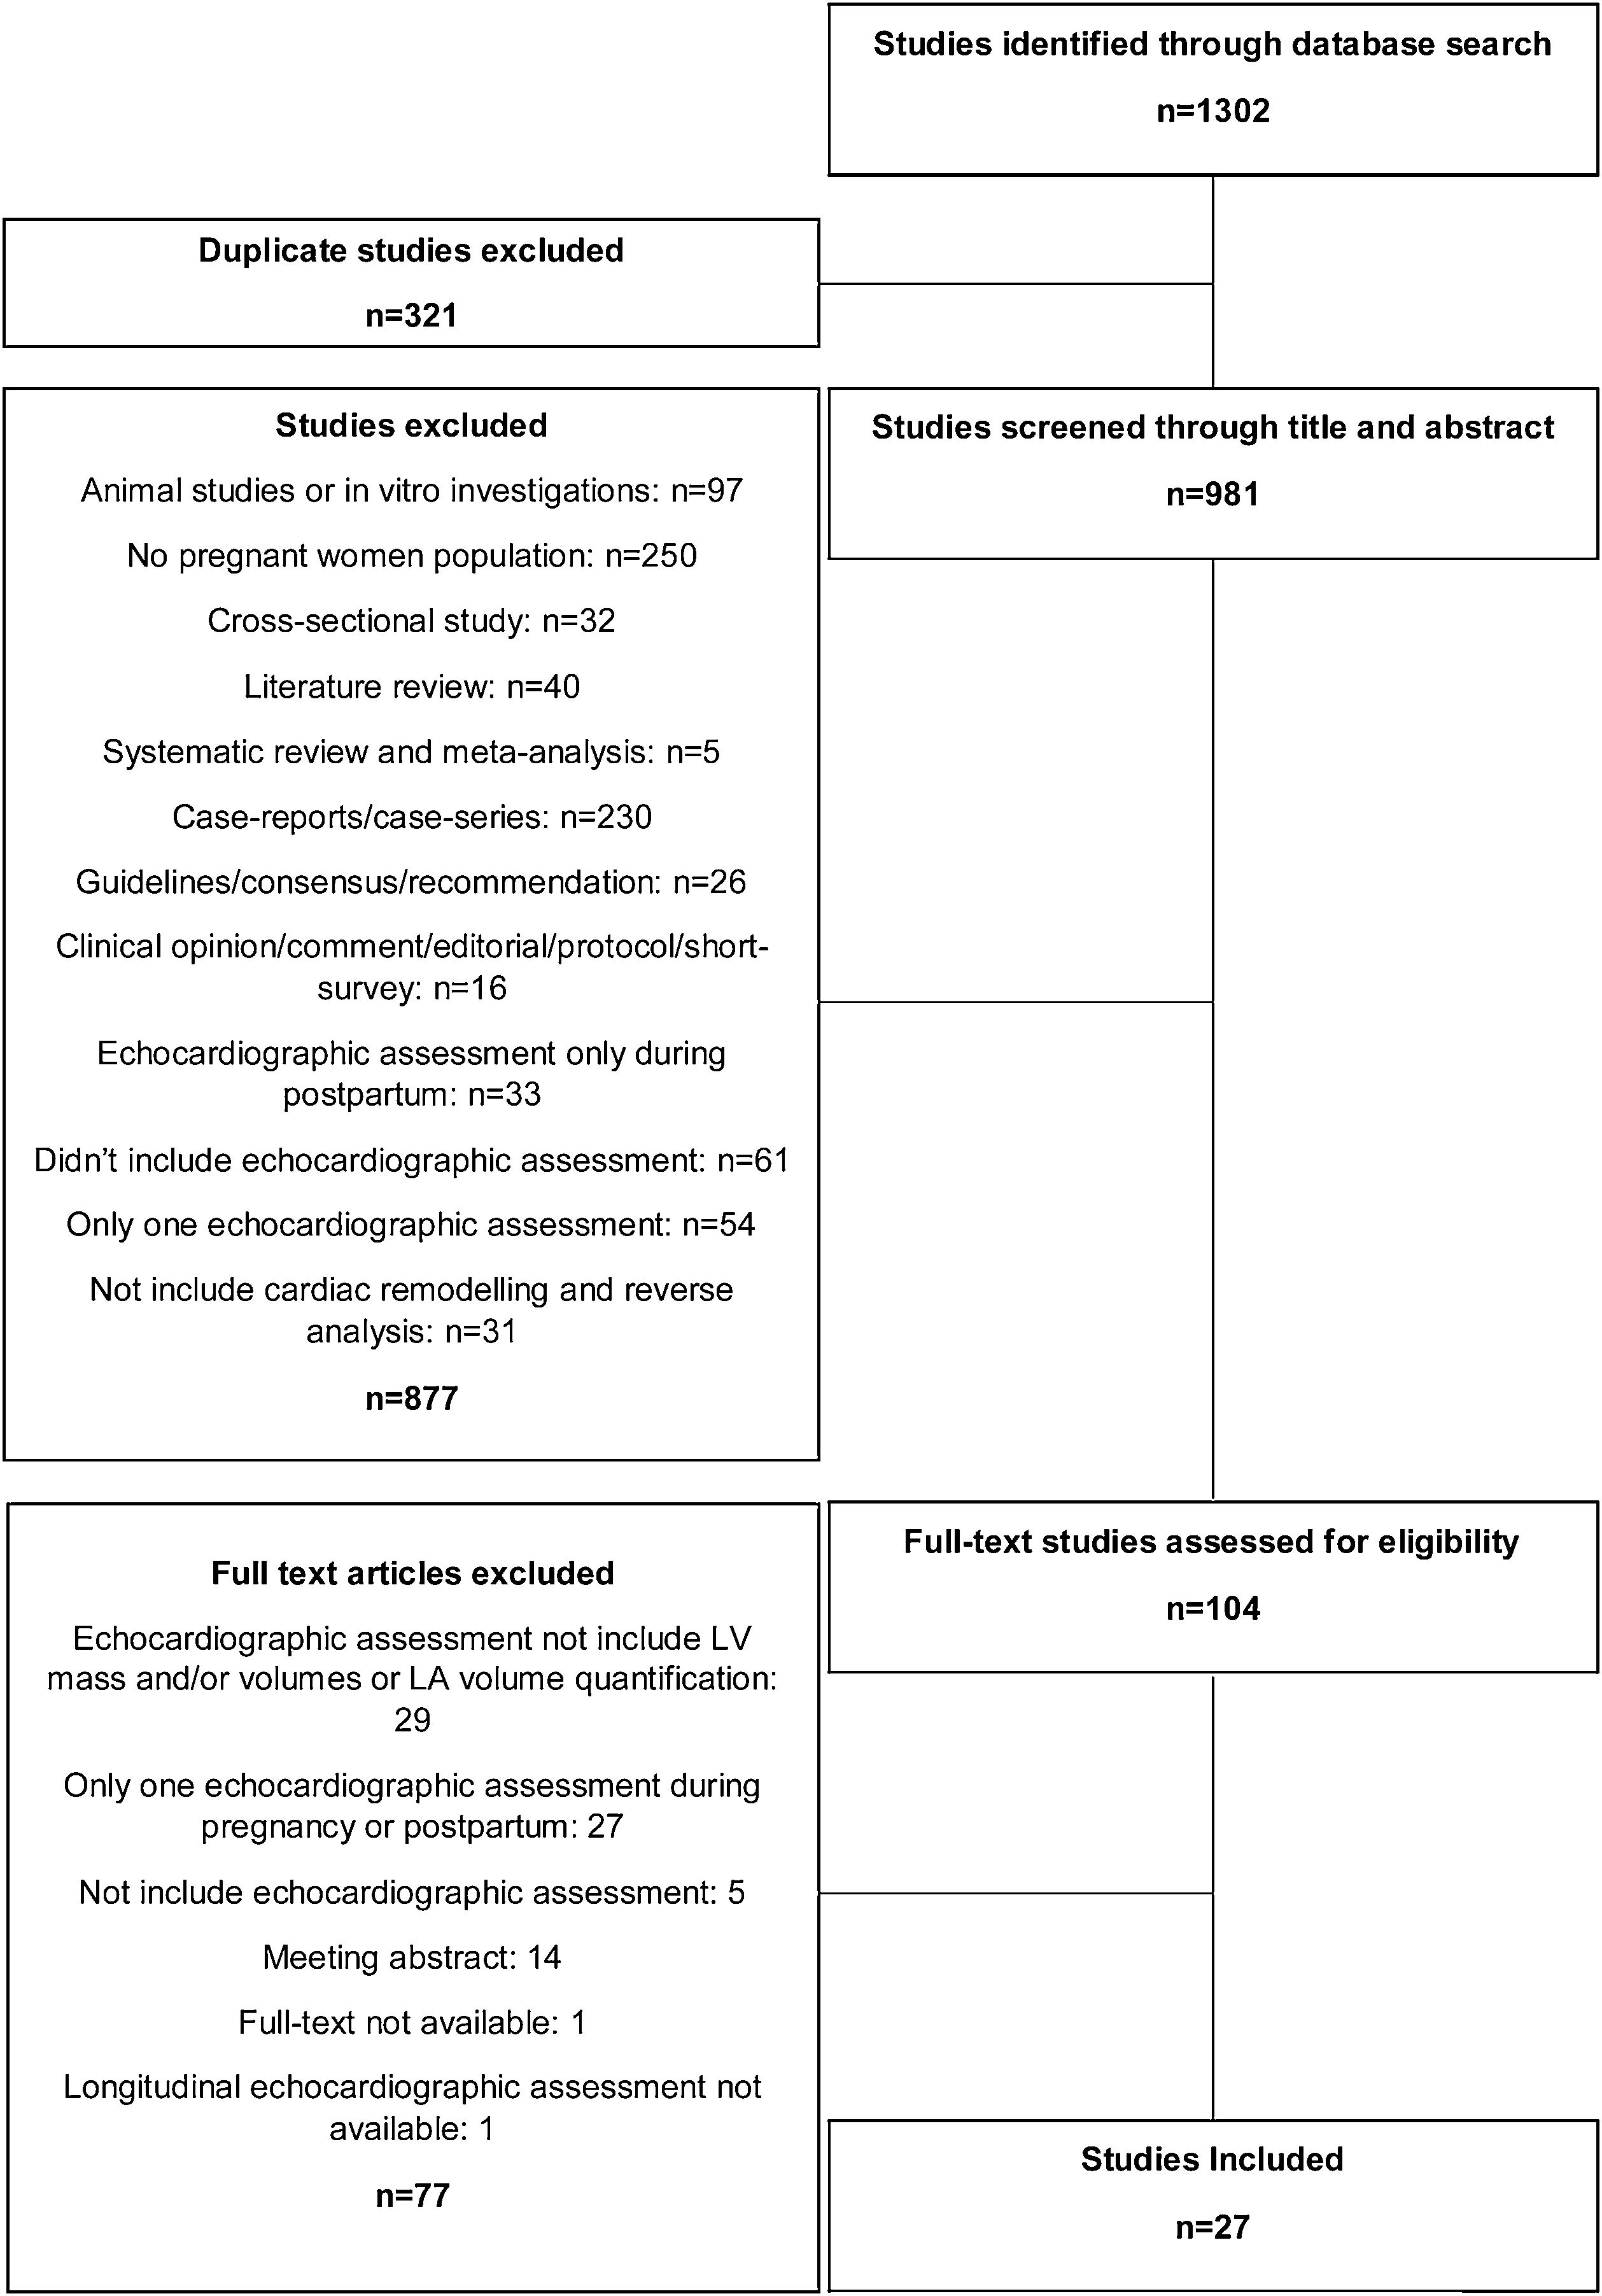
ResultsSystematic review resultsTwenty-seven eligible studies were included in this systematic review (Figure 1), whose characteristics are shown in Tables 1 and 2. All studies had an observational design, with three case control studies,11–13 six retrospective longitudinal cohort studies14–19 and 18 prospective longitudinal cohort studies.20–36 Four studies did not include echocardiographic assessment during the post-partum period.11,15,27,36 However, in these articles, the investigators performed at least two echocardiographic evaluations during pregnancy. Although all longitudinal studies repeated cardiac assessments during the follow-up period, four articles did not analyse the progression of cardiac remodeling and/or reverse remodeling during pregnancy and after delivery, respectively.12,14–16 Regarding echocardiographic variables, namely LA volume, LV volumes or mass, six studies used absolute values without indexing them to BSA.13,17,18,21,24,35 LV mass was the most indexed variable to BSA, followed by LA volume. Golinska-Grzybala et al. was the only study to highlight the importance of BSA indexation in analyzing the echocardiographic changes in subjects with distinct body shapes and sizes.
Summary of systematic reviews of echocardiographic assessment during pregnancy and postpartum.
| Study design | Aim | Country | Recruitment period | Echocardiographic assessment during pregnancy | Echocardiographic assessment after delivery | |
|---|---|---|---|---|---|---|
| Adeyeye et al., 201611 | Case-controlled study | “…assessment of changes in left and right ventricular dimensions (in systole and diastole), left and right atrial dimensions (in diastole), LV systolic and diastolic functions, and LV mass during trimesters of normal pregnancy.” | Nigeria | Missing | Beginning of the 2nd trimester (15±1 weeks), beginning of the 3rd trimester (28±1 weeks), and middle of the 3rd trimester (35±1 weeks) | n/a |
| Cong et al., 201620 | Prospective study | “…to determine longitudinal strain in each of the three myocardial layers in normal pregnant women according to gestation proceeding.” | China | Missing | 1st trimester (12–14 weeks), 2nd trimester (22–28 weeks) and 3rd trimester (36–40 weeks) | 6–9 weeks after delivery |
| Burlingame et al., 201721 | Prospective study | “…to examine BNP and NT-proBNP levels and to correlate them with cardiac structure and function through pregnancy and the postpartum period in normal women.” | United States of America | August 2007 to January 2011 | 1st trimester (6–12 weeks), 2nd trimester (18–24 weeks), 3rd trimester (30–36 weeks) and intrapartum (during labor or immediately prior to delivery) | First 48 h postpartum, 6–12 weeks postpartum, and 6–12 months postpartum |
| Lindley et al., 201714 | Retrospective study | “…the objective of this study was to compare clinical and functional outcomes of peripartum cardiomyopathy patients with pre-eclampsia to those who did not have pre-eclampsia.” | United States of America | 2004–2014 | Before delivery | 6–24 months after diagnosis |
| Meera et al., 201715 | Retrospective study | “…to evaluate changes in LV function using speckle tracking echocardiography in patients with gestational diabetes mellitus compared with women with normal pregnancy.” | United States of America | 2009–2014 | 1st trimester, 2nd trimester (13–26 weeks) and 3rd trimester (27–42 weeks) | n/a |
| Sato et al., 201716 | Retrospective study | “…analyzed gestational hypertension in pregnancies with aortic coarctation and the perinatal changes of echocardiographic parameters.” | Japan | Aortic coarctation diagnosis between 1982 and 2015 | 1st trimester, 2nd trimester and 3rd trimester | After delivery and 1 years after delivery |
| Sengupta et al., 201722 | Prospective study | “…to assess serial changes in maternal myocardial contractile function during normal pregnancy and labor and to determine the role of maternal hemodynamic characteristics in these changes.” | India | April 2010 to January 2013 | 1st trimester (10–12 weeks), 2nd trimester (22–26 weeks) and 3rd trimester (30–34 weeks) | Once at labor (first or second stage) |
| Golińska-Grzybała et al., 201823 | Prospective study | “…to evaluate changes in the pulmonary artery diameter (PAD) and their correlations with cardiac remodeling and haemodynamic parameters throughout gestation.” | Poland | 2014 and 2015 | 1st trimester (between weeks 10 and 14) and between 2nd and 3rd trimesters (between weeks 25 and 30) | 12–38 weeks postpartum |
| Hieda et al., 201824 | Prospective study | “…to compare LV systolic and diastolic function before and during a subsequent pregnancy between women with and without a history of gestational hypertensive disorders.” | United States of America | Missing | Early (4–8 weeks of gestation) and late pregnancy (32–36 weeks) | 6–10 weeks after delivery |
| Shahul et al., 201812 | Prospective case–control study | “…primary analysis was the association between antepartum activin A levels and postpartum cardiac dysfunction using global peak longitudinal strain. We also performed an exploratory analysis to evaluate the relationship between postpartum activin levels and measurements of diastolic function and mean arterial pressures.” | United States of America | July 2013 to November 2016 | 3rd trimester | 12 months after delivery |
| Umazume et al., 201825 | Prospective study | “…to characterize changes in cardiac structures and function in normal pregnancies, …” | Japan | Began in April 2014 | 1st (∼136/7 gestational weeks), 2nd (140/7∼276/7 gestational weeks) and 3rd (280/7 gestational weeks) trimesters | Within 1 week after childbirth and approximately 1 month postpartum |
| Umazume et al., 201826 | Prospective study | “…to better characterize the heart in hypertensive disorders of pregnancy (HDP) in relation to various cardiac biomarkers, using longitudinally prospectively collected data on simultaneous echocardiography and blood variables from women with HDP.” | Japan | April 2014 to March 2016 | 1st trimester, 2nd trimester and 3rd trimester | 1 week and 1 month after delivery |
| Yu et al., 201817 | Retrospective study | “…investigated the LV function of patients with pregnancy-induced hypertension using VVI, combined with NT-pro BNP levels.” | China | March 2014 to July 2016 | 3rd trimester | 3 months after delivery |
| Ghi et al., 201927 | Prospective study | “…to compare longitudinal echocardiographic findings in women with uncomplicated monochorionic and dichorionic twin pregnancies.” | Italy | 2014 to 2016 | 1st trimester (11–13 weeks), 2nd trimester (20–23 weeks) and 3rd trimester (28–32 weeks) | n/a |
| Kimura et al., 201928 | Prospective study | “…to investigate the values and the changes of brain natriuretic peptide (BNP) and cardiac troponin in pregnant women.” | Japan | February 2012 to February 2013 | 3rd trimester(28–30 weeks gestation) | Within 4 days of delivery |
| Kimura et al., 201929 | Prospective study | “…to elucidate the changes in cardiac diastolic function during pregnancy and early after delivery.” | Japan | February 2012 to February 2013 | 3rd trimester(28–30 weeks of gestation) | Within 4 days of delivery |
| Tasar et al., 201930 | Prospective study | “…to determine the effects of normal pregnancy on left atrial mechanics using new morphologic and functional echocardiographic parameters while considering left atrial geometry.” | Turkey | October 2012 to June 2013 | 1st trimester, 2nd trimester and 3rd trimester | 6-Month postpartum |
| Aguilera et al., 202031 | Prospective study | “…to compare maternal cardiac function and structure in women with gestational diabetes mellitus and those with uncomplicated pregnancy at 35–36 weeks’ gestation and at about 6 months after delivery and assess whether the rate of cardiovascular recovery differs between women with gestational diabetes mellitus and controls.” | United Kingdom | Missing | 35–36 weeks gestation | 6 months after delivery |
| Ambrožič et al., 202013 | Prospective case–control study | “…to assess these time-dependent changes in both hemodynamic, systolic and diastolic function parameters using transthoracic echocardiography in women with severe preeclampsia.” | Slovenia | Missing | 1 day before delivery | 1 and 4 days postdelivery |
| Del Prado Díaz et al., 202032 | Prospective study | “…to evaluate and describe changes in RV morphology and function, comparing with LV changes, throughout single gestation pregnancy in a cohort of women without cardiovascular disease.” | Spain | Missing | 2nd trimester (24±2 weeks) and 3rd trimester (32±2 weeks) | From the third month after delivery |
| Duarte et al., 202018 | Retrospective study | “…to characterize changes in LV longitudinal and circumferential strain in women with repaired tetralogy of Fallot, from the preconception to the postpartum period, to help inform counseling of these women regarding the impact of pregnancy on ventricular mechanics.” | United States of America | 2011–2016 | Within 18 months prior to conception or in the 1st trimester and 3rd trimester | 4–6 weeks postpartum |
| Herrera et al., 202019 | Retrospective study | “…to assess the accuracy of measurements of pulmonary artery pressure as estimated by right ventricular systolic pressure using echocardiography as compared with pressures determined directly with right-heart catheterization.” | United States of America | 2006–2017 | After 20 weeks of gestation | 3 months postpartum |
| Sonaglioni et al., 202033 | Prospective study | “…to evaluate any changes in the common carotid artery intima-media thickness during normal pregnancy and in the postpartum period, and to correlate these changes with neutrophil-to lymphocyte ratio and red blood cells distribution width.” | Italy | October 2019 to February 2020 | 1st trimester (12–14 weeks) and 3rd trimester (36–38 weeks) | 6–9 weeks after delivery |
| Umazume et al., 202034 | Prospective study | “…to characterize the cardiac morphofunctional changes in normotensive women with twin or singleton pregnancies and to determine their associations with BNP, NT-proBNP, and hs-TnI levels using longitudinal prospectively collected data.” | Japan | April 2014 to March 2016 | 1st (∼136/7 gestational weeks), 2nd (140/7∼276/7 gestational weeks) and 3rd (280/7 gestational weeks) trimesters | Within 1 week after childbirth and approximately 1 month postpartum |
| Giorgione et al., 202135 | Prospective study | “…to compare echocardiographic findings immediately before and after childbirth in women with hypertensive disorders of pregnancy.” | United Kingdom | February 2019 to August 2019 | 4.5 [2–8] days before delivery | 3.5 [2–6] days after delivery |
| Golinska-Grzybala et al., 202136 | Prospective study | “…evaluation of the effect of overweight and obesity on myocardial function and parameters of blood flow in the uterine arteries, as well as on birthweight in pregnant women without cardiovascular disorders.” | Poland | 2014–2015 | 1st trimester (between weeks 10 and 14) and between 2nd and 3rd trimesters (between weeks 25 and 30) | n/a |
| Sonaglioni et al., 202133 | Prospective study | “…to investigate the influence of chest shape, assessed non-invasively by modified Haller index (MHI), on ventricular-arterial coupling in a population of healthy women with uncomplicated pregnancy.” | Italy | October 2019 to June 2020 | 1st trimester (12–14 weeks) and 3rd trimester (36–38 weeks) | 6–9 weeks after delivery |
Summary of systematic reviews of study groups and echocardiographic variables assessed for cardiac remodeling and reverse remodeling evaluation during pregnancy and postpartum.
| Total number of participants | Study groups | Indexed to BSA (in each evaluation moment or not) | LV mass indexed | LV EDV indexed | LV ESV indexed | LA volume indexed | Comparison between study groups | Comparison among follow-up period | |
|---|---|---|---|---|---|---|---|---|---|
| Adeyeye et al., 201611 | 200 | Normal pregnant women versus healthy nonpregnant volunteers | In each evaluation moment | Yes | n/a | n/a | n/a | YesIndependent samples Student's t-test | YesANOVA |
| Cong et al., 201620 | 101 | Pregnant women versus nonpregnant women | In each evaluation moment | Yes | Yes | No | n/a | YesIndependent samples Student's t-test | YesANOVA |
| Burlingame et al., 201721 | 116 | Pregnant women recruited from the community | n/a | No | No | No | No | n/a | YesLinear mixed models (Tukey–Kramer adjustment for multiple comparisons was performed) |
| Lindley et al., 201714 | 39 | Pregnant women who developed peripartum cardiomyopathy with pre-eclampsia versus pregnant women who developed peripartum cardiomyopathy without pre-eclampsia | In each evaluation moment | Yes | No | No | Yes | YesStudent's two-sample t-test | No |
| Meera et al., 201715 | 90 | Healthy pregnant women versus pregnant women with gestational diabetes | In each evaluation moment | Yes | n/a | n/a | n/a | YesStudent's t-test | No |
| Sato et al., 201716 | 15 | Pregnant women with gestational hypertension versus pregnant women without gestational hypertension | In each evaluation moment | Yes | No | No | No | YesStudent's t-test | No |
| Sengupta et al., 201722 | 55 | Healthy pregnant women versus nulliparous | In each evaluation moment | n/a | No | No | Yes | YesIndependent samples Student's t-test | YesLinear mixed models |
| Golińska-Grzybała et al., 201823 | 69 | Consecutive healthy outpatients with a single pregnancy | In each evaluation moment | Yes | No | No | Yes | Yes(not specify the statistical method applied) | YesRepeated measures ANOVA and Bonferroni post hoc correction for multiple comparisons |
| Hieda et al., 201824 | 41 | Women with a history of gestational hypertensive disorders versus women without such a history | n/a | n/a | No | n/a | n/a | YesPost hoc multiple comparisons 170 were made by Mann–Whitney U test with the use of the Bonferroni correction | YesRepeated measures ANOVA using linear mixed models |
| Shahul et al., 201812 | 85 | Pregnant women with preeclampsia versus pregnant women with gestational or chronic hypertension versus healthy pregnant women | In each evaluation moment | Yes | No | No | Yes | YesParametric or nonparametric t-tests as appropriate | No |
| Umazume et al., 201826 | 51 | Healthy pregnant women | In each evaluation moment | Yes | n/a | n/a | Yes | n/a | YesWilcoxon's rank sum test and Student's t-test with Bonferroni's correction |
| Umazume et al., 201825 | 75 | Normotensive pregnant women versus hypertensive disorders of pregnancy | In each evaluation moment | Yes | n/a | n/a | Yes | Yes(not specify the statistical method applied) | YesWilcoxon's rank-sum test and Student's t-test with Bonferroni correction |
| Yu et al., 201817 | 82 | Pregnant women with gestational hypertension versus pregnant women with preeclampsia versus healthy pregnant women | n/a | n/a | No | No | n/a | YesStudent's t-test | YesStudent's t-test |
| Ghi et al., 201927 | 67 | Healthy women with twin monochorionic pregnancy versus healthy women with twin dichorionic pregnancy | In each evaluation moment | Yes | No | No | n/a | YesIndependent samples Student's t-test | YesRepeated measures ANOVA |
| Kimura et al., 201928 | 405 | Consecutive pregnant women recruitment | In each evaluation moment | n/a | n/a | n/a | Yes | n/a | YesPaired t-test |
| Kimura et al., 201929 | 397 | Consecutive pregnant women recruitment | In each evaluation moment | Yes | No | No | Yes | n/a | YesPaired t-test |
| Tasar et al., 201930 | 47 | Only healthy women with singleton first pregnancies | In each evaluation moment | Yes | Yes | Yes | No | n/a | YesANOVA with the Tukey test |
| Aguilera et al., 202031 | 146 | Pregnant women with gestational diabetes mellitus versus control with uncomplicated pregnancy | In each evaluation moment | Yes | No | No | Yes | YesIndependent samples Student's t-test or the Mann–Whitney U test | YesLinear mixed models with two random effects (random intercept and random slope) and an unstructured variance–covariance matrix |
| Ambrožič et al., 202013 | 60 | Pregnant women with severe preeclampsia versus healthy pregnant women | n/a | No | No | No | No | YesStudent's t-test or Mann–Whitney U test were used for comparison between two groups depending on the distribution | YesRepeated measures ANOVA or Friedman test depending on the distribution |
| Del Prado Díaz et al., 202032 | 133 | Healthy pregnant women versus nulliparous | In each evaluation moment | Yes | No | No | No | YesIndependent samples Student's t-test | YesLinear mixed models (due to longitudinal sample nature with the maximum restricted likelihood method. Medium values were estimated and compared by square minimums and multiple comparisons were corrected by Bonferroni method) |
| Duarte et al., 202018 | 16 | Pregnant women with repaired tetralogy of Fallot, who were enrolled in the standardized outcomes in reproductive cardiovascular care (STORCC) registry | n/a | n/a | No | No | n/a | n/a | YesRepeated measures ANOVA |
| Herrera et al., 202019 | 46 | Pregnant women with pulmonary hypertension | In each evaluation moment | Yes | n/a | n/a | n/a | Yes(not specify the statistical method applied) | YesStudent's t-test |
| Sonaglioni et al., 202033 | 73 | Consecutive healthy pregnant women | In each evaluation moment | Yes | Yes | Yes | No | n/a | YesRepeated measures ANOVA |
| Umazume et al., 202034 | 66 | Women with singleton pregnancies versus women with twin pregnancies | In each evaluation moment | Yes | n/a | n/a | Yes | Yes(not specify the statistical method applied) | YesStudent's t-test with Bonferroni correction |
| Giorgione et al., 202135 | 30 | Women with hypertensive disorders during pregnancy | n/a | No | No | No | No | n/a | YesPaired t-test or Wilcoxon signed-rank test |
| Golinska-Grzybala et al., 202136 | 87 | Women with normal weight versus overweight and obese women | In each evaluation moment | Yes | Yes | Yes | Yes | YesMann–Whitney U test | YesRepeated measures ANOVA and Bonferroni post hoc correction for multiple comparisons |
| Sonaglioni et al., 202137 | 59 | Healthy pregnant women | In each evaluation moment | Yes | Yes | Yes | Yes | n/a | YesRepeated measures ANOVA |
Four studies used a non-pregnant control group.11,20,22,32 Ten articles did not include study group comparisons (eight used consecutive pregnant women recruitment,21,23,26,28–30,33,37 one focused on pregnant women with pulmonary hypertension19 and one included only women with hypertensive pregnancy disorders).35 Related to the statistical analysis used for longitudinal evaluation of CR and RR, the selection of tests (such as repeated measures ANOVA, linear mixed models, Wilcoxon and paired t-test) from within-subjects design was reported in 17 articles13,18,21–29,31–33,35–37 and not specified in three manuscripts (reporting only used of Student's t-test17,19,32). In addition, between-subject design was reported in only three studies to assess the cardiac adaptations during the follow-up period.11,20,30
Illustrative example – pregnant women cohortWe enrolled 45 pregnant women with a median age of 33 [25,41] years, of whom 40% were multiparous. Only three participants developed gestational diabetes. Regarding smoking habits, five pregnant women maintained smoking during gestation, three stopped smoking at the beginning of pregnancy, and ten were former smokers. The variation of body mass index and BSA during pregnancy and postpartum are represented in Table 3. Data were analyzed considering four indexation methodologies and using a within and a between design.
Variation of body mass index and BSA during pregnancy and postpartum.
| Prior to pregnancy | 1st trimester | 3rd trimester | 1 month after delivery | 6 months after delivery | |
|---|---|---|---|---|---|
| Body mass index (kg/m2) | 22.66 [17.91; 29.37] | 23.31 [18.67; 29.55] | 27.13 [21.15; 33.23] | 24.57 [18.29; 30.49] | 23.44 [17.53; 31.51] |
| Body surface area (m2) | 1.68 [1.48; 1.92] | 1.71 [1.50; 1.94] | 1.80 [1.58; 2.02] | 1.71 [1.50; 1.99] | 1.69 [1.46; 2.01] |
Values reported through median [minimum; maximum].
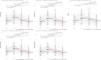
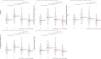
We focused on the longitudinal variation of LVM to analyse the CR and RR during pregnancy and postpartum, respectively. Figures 2 and 3 show the variation of LVM, using Friedman and Kruskal–Wallis tests, respectively. In these plots, each point represents one pregnant woman, and a dashed connective line depicts the change between evaluation times.
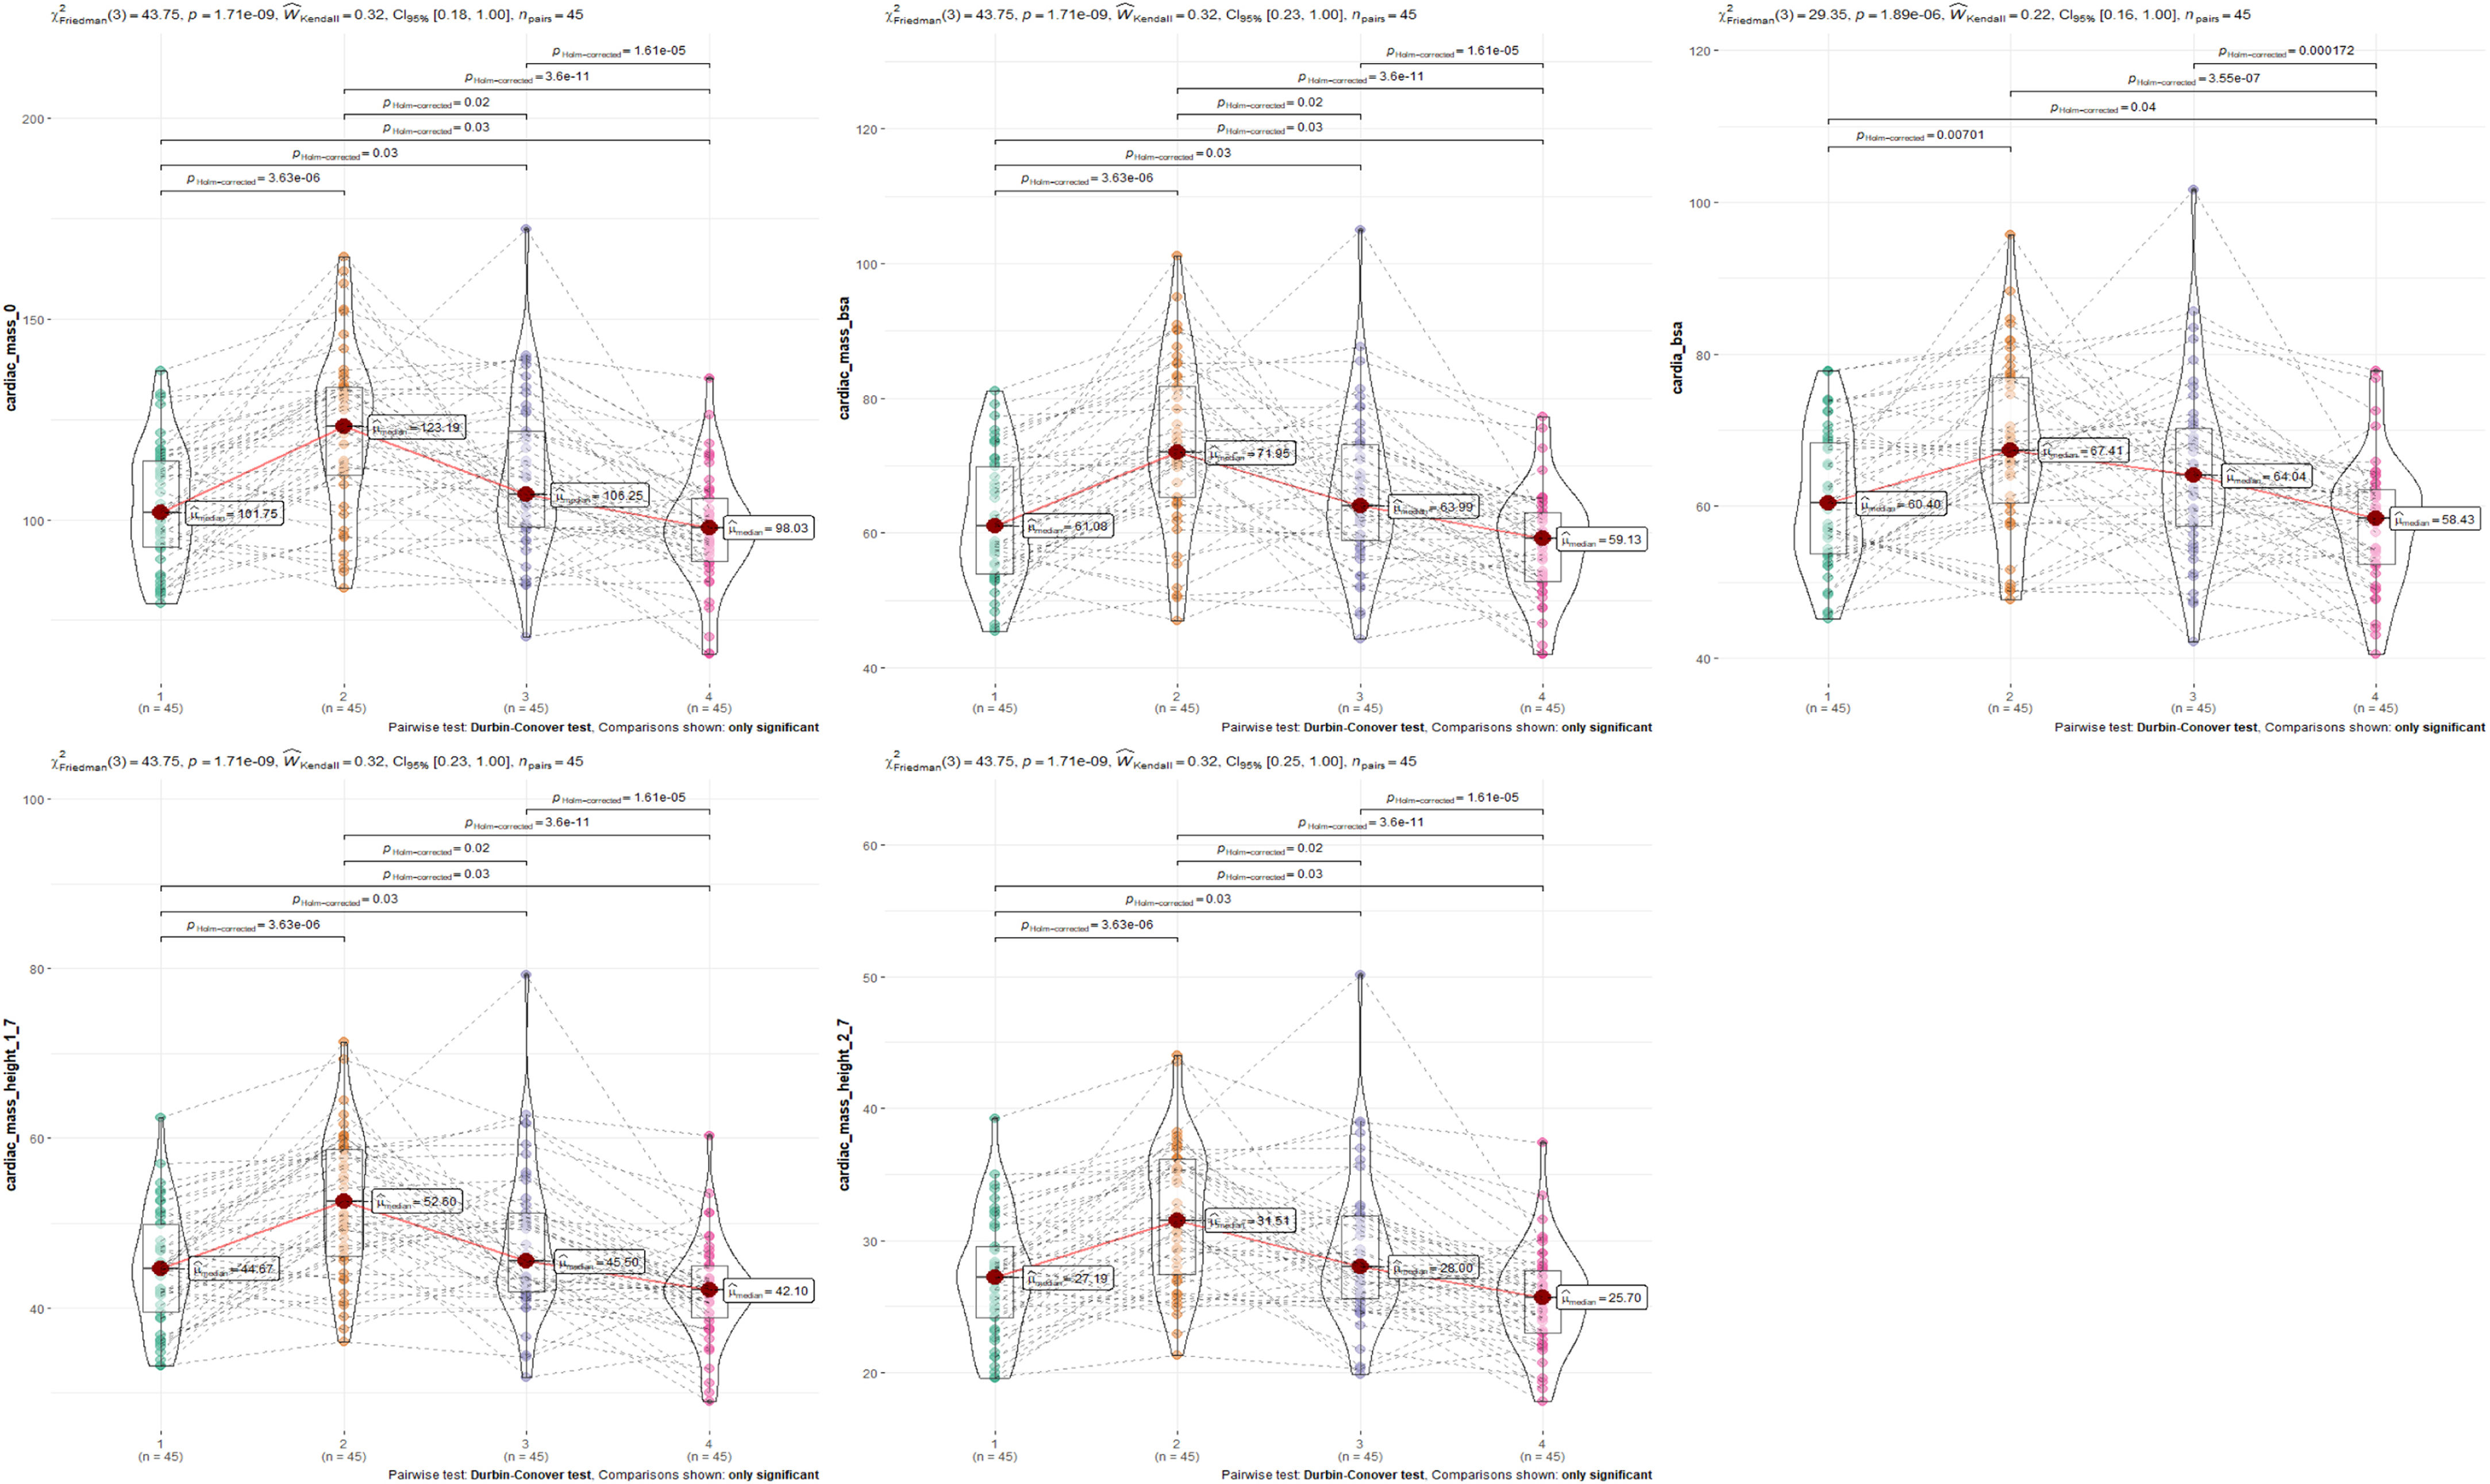
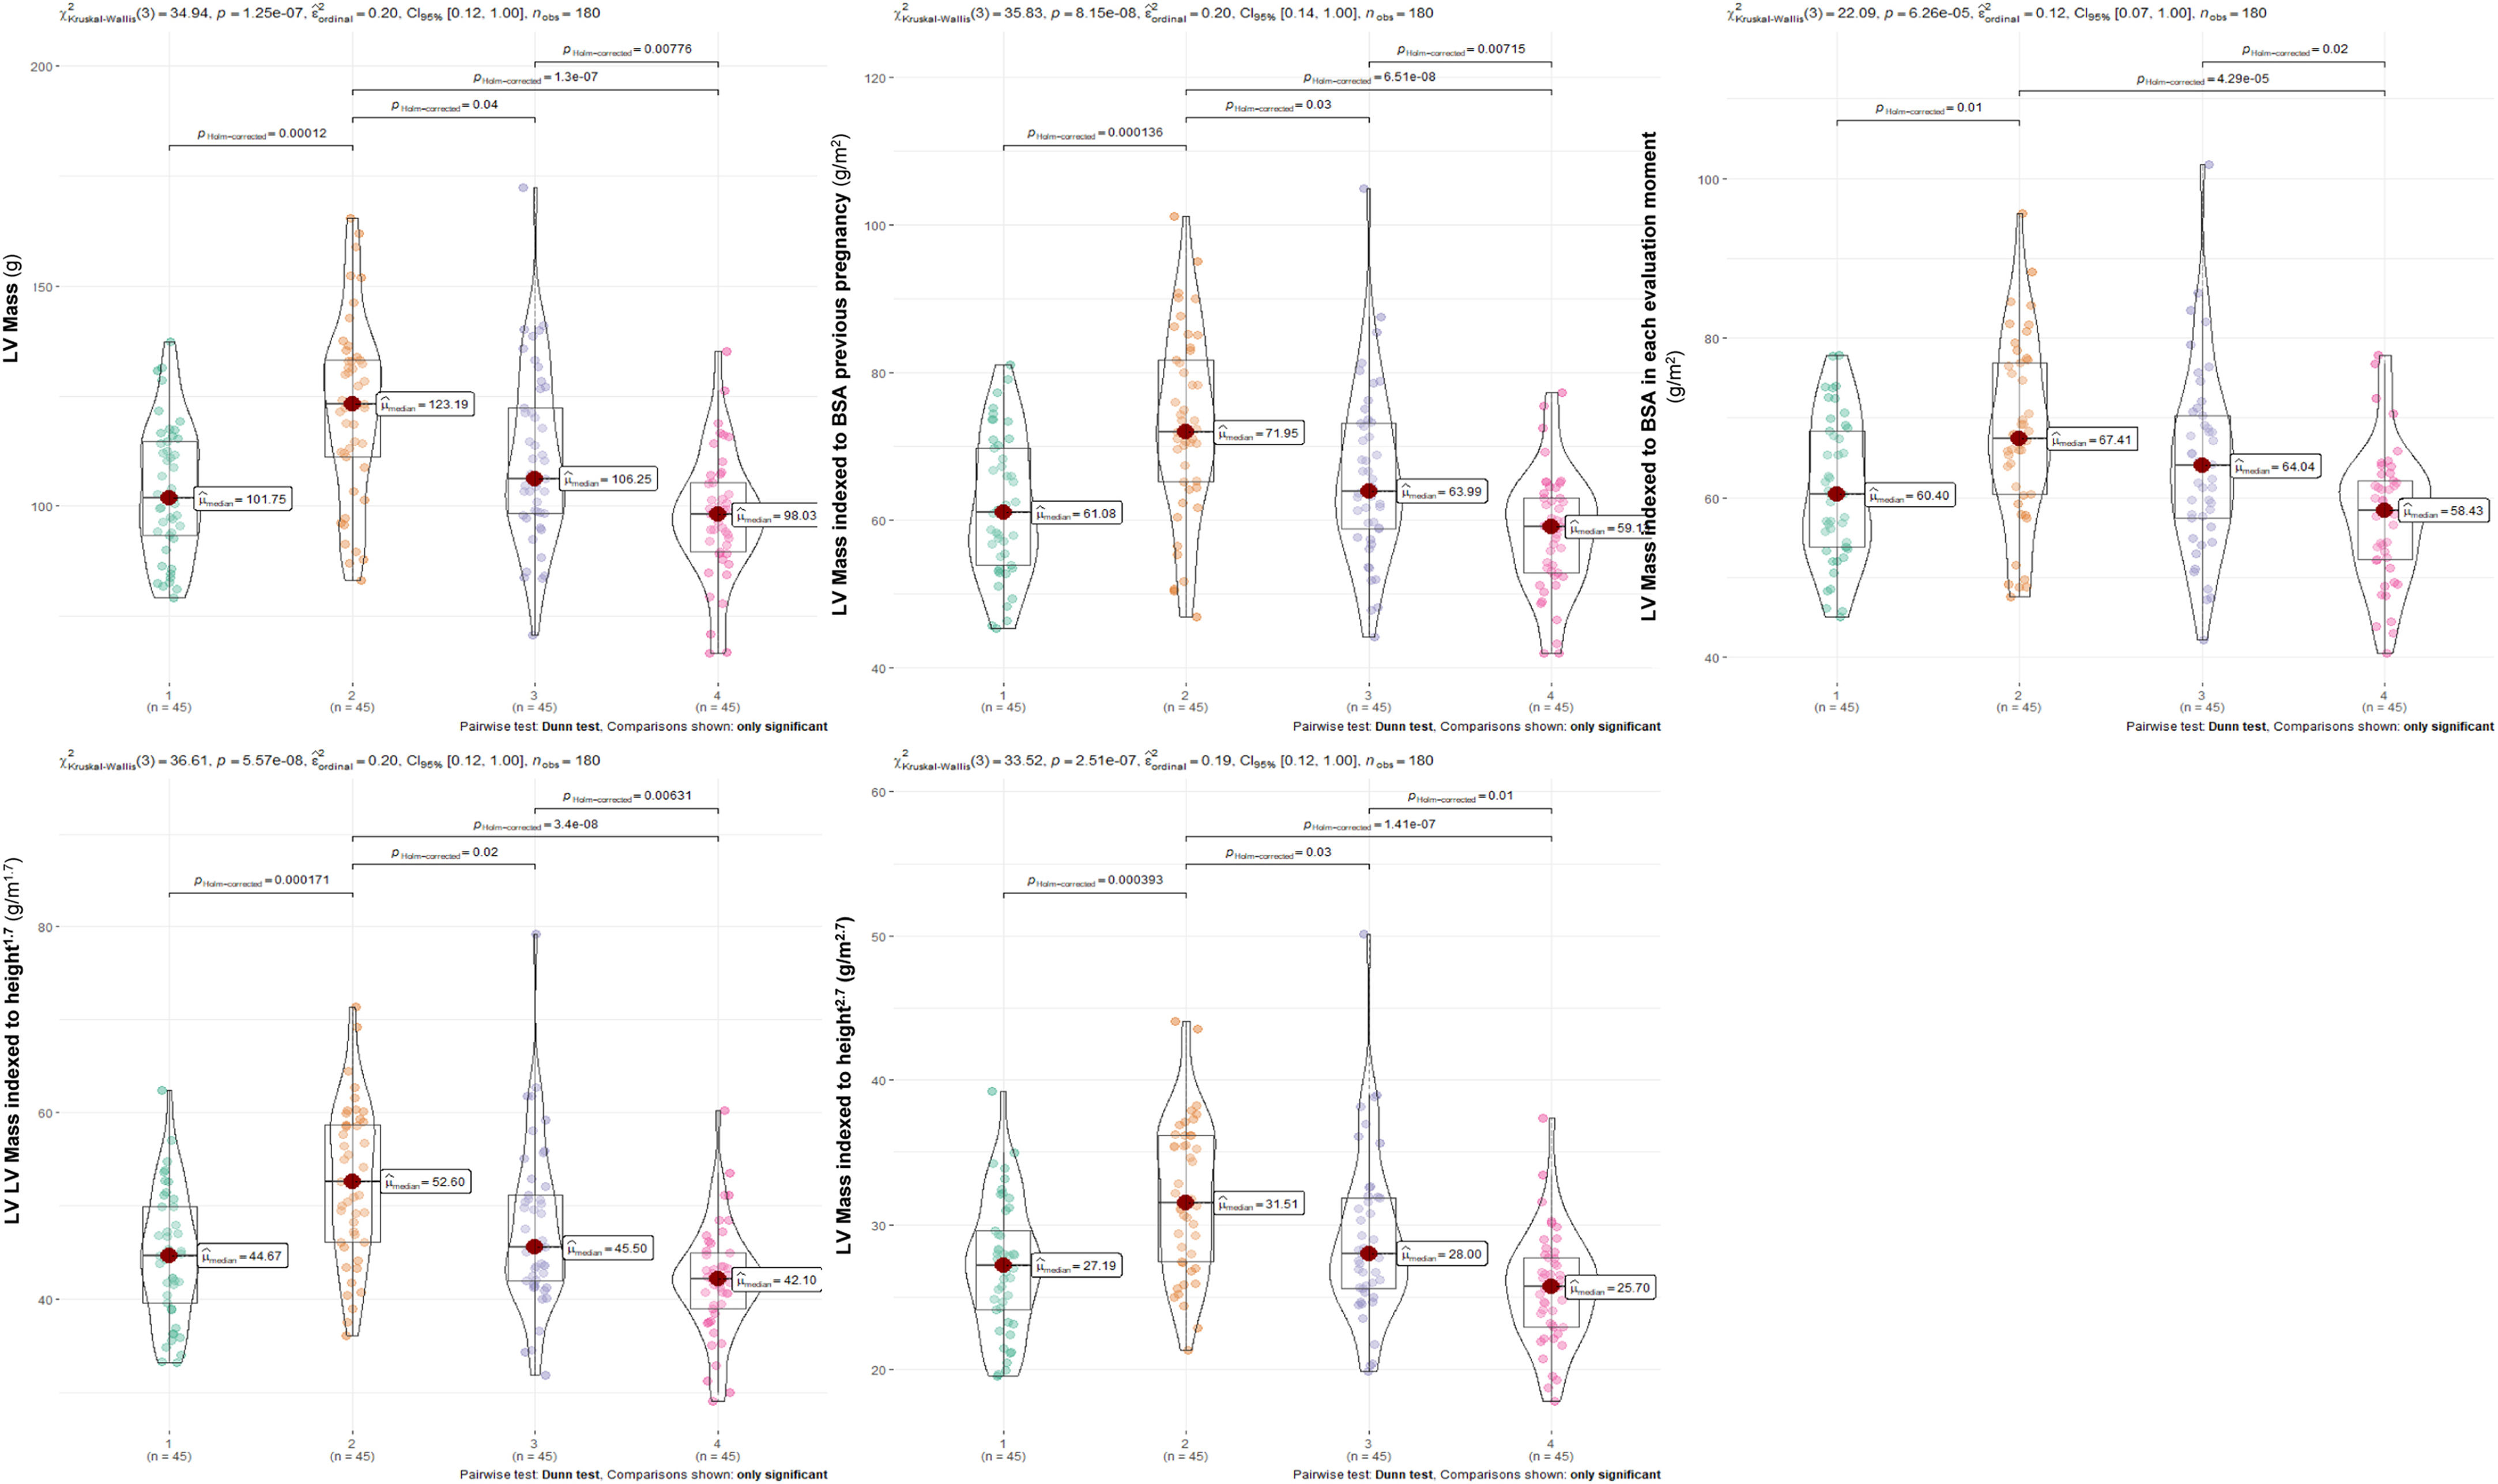
Related to LVM progression, a significant increase was found from 1st to 3rd trimesters followed by a significant decrease from the 3rd trimester to 6 months postpartum regardless of the indexation method used (Figures 2 and 3). However, when LVM was indexed to BSA at each time-point, the LVM regression from the 3rd trimester to 1st month after delivery lost statistical significance, contrasting with results from other indexation methodologies (Figures 2 and 3).
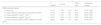
Comparison among different methods of indexation using a within or a between designThe effect size can be used as a standardized metric to compare the magnitude of reported effects for LVM indexation (LVMi), using four different normalization methods (1) absolute values, without indexing; (2) indexing to pre-pregnancy BSA; (3) allometric indexing or (4) indexing to BSA measured at the same day of cardiac assessment).
Regarding the within-subjects design, the effect size of the variation of LVM analysis was similar when indexed to pre-pregnancy BSA, without indexation or using allometric indexation (Table 4). However, the effect size was smaller when indexed to BSA computed at each time-point (Table 4). The comparisons made by the within-subjects design were all statistically significant (p=<0.05).
Comparison among different methods of indexation using a within or a between design.
| F statistic | p-Value | Effect size | Confidence interval | |
|---|---|---|---|---|
| Within-subjects design | ||||
| LV mass (g) | 43.75 | 1.71E−09 | 0.32 | [0.18; 1.00] |
| LV mass indexed to BSA previous pregnancy (g/m2) | 43.75 | 1.71E−09 | 0.32 | [0.23; 1.00] |
| LV mass indexed to height1.7 (g/m1.7) | 43.75 | 1.71E−09 | 0.32 | [0.23; 1.00] |
| LV mass indexed to height2.7 (g/m2.7) | 43.75 | 1.71E−09 | 0.32 | [0.25; 1.00] |
| LV mass indexed to BSA in each evaluation moment (g/m2) | 29.35 | 1.89E−06 | 0.22 | [0.16; 1.00] |
| H statistics | p-Value | Effect size | Confidence interval | |
|---|---|---|---|---|
| Between-subjects design | ||||
| LV mass (g) | 34.94 | 1.25E−07 | 0.20 | [0.12; 1.00] |
| LV mass indexed to BSA previous pregnancy (g/m2) | 35.83 | 8.15E−08 | 0.20 | [0.14; 1.00] |
| LV mass indexed to height1.7 (g/m1.7) | 36.61 | 5.57E−08 | 0.20 | [0.12; 1.00] |
| LV mass indexed to height2.7 (g/m2.7) | 33.52 | 2.51E−07 | 0.19 | [0.12; 1.00] |
| LV mass indexed to BSA in each evaluation moment (g/m2) | 22.09 | 6.26E−05 | 0.12 | [0.07; 1.00] |
Concerning the between-subjects design, the effect size of the LVM comparison among four time points was similar using pre-pregnancy BSA indexation, allometric indexes or without any indexation method (Table 4). The effect size reported in LVM indexed to BSA calculated for each time-point of cardiac assessment was lower (Table 4). The comparisons made by the between-subjects design were all statistically significant (p=<0.05).
Focusing on comparisons between within and between-subjects designs, the first one displayed higher effect size values in all indexation methods (Table 4). Additionally, we found that the effect size calculated from LVM progression indexed to BSA in each evaluation through within-subject design was similar to the effect size quantified in the between-subjects design when indexed to pre-pregnancy BSA, without indexation or using allometric indexes.
DiscussionWe performed a systematic review to explore which indexation methods were applied most frequently in literature to evaluate cardiac remodeling and reverse remodeling during pregnancy and postpartum, respectively. Current evidence suggested that echocardiographic parameters were mostly indexed to BSA measured at each point of evaluation.11,12,14,15,19,20,22,23,25–34,36–38 Additionally, we found that indexation was most commonly performed to evaluate LV mass and LA volume.11,12,14,15,19,20,22,23,25–34,36–38 Most studies selected within-subjects design to analyse the longitudinal cardiac remodeling and reverse remodeling processes.13,18,21–29,31–33,35–37
In our illustrative echocardiographic example, focused on LVM assessment, we gauged alternative scaling methods, (1) using absolute values without indexing; (2) indexing to pre-pregnancy BSA; (3) using allometric indexes (indexes 1.7 and 2.7) or (4) indexing to BSA measured on the same day of cardiac assessment. The indexation method used conditioned the effect magnitude of the LVM variation during pregnancy and postpartum. Considering the progressive increase of BSA during pregnancy due to fetus development, maternal weight gain, and the potential incomplete weight recovery after delivery, the assessment of CR and RR exclusively related to volume overload is difficult to estimate. Indeed, indexing with pre-pregnancy BSA and allometric indexes end up dismissing the contribution of the fetus development. Indeed, indexing to BSA measured at each evaluation could underestimate the impact of the CR process, since changes in LVM could be neutralized by the increased BSA across gestation. In addition, the selection of statistical tests from within versus between-subjects design is critical and depends on the research question and the experimental design study. In within-subjects analysis, the effect sizes were higher in all indexation methods selected compared to between-subject analysis. The within-subjects design considers two sources of variability: (1) differences across individuals and (2) the variability due to within-subjects, while the between-subjects design only considers the first source of variability. When using the BSA indexation for each moment in the within-subjects design, one is reducing the second source of variability by handing a new and changeable variable contributing to a small effect size like the ones obtained by the between-subjects analysis without longitudinal BSA variation. However, the effect size comparisons were not statistically assessed. To our knowledge, this is the first work to evaluate the impact of indexation for the longitudinal analysis of cardiac adaptation, specifically LVM, during pregnancy and 1–6 months after delivery, as well as to discuss the potential statistical methods applied for evaluation purposes.
In the literature review, we found that most studies used a within-subjects design to analyse longitudinal cardiovascular adaptations during pregnancy and postpartum statistically. We also discovered that the echocardiographic parameters were mostly indexed to BSA measured at each evaluation moment. According to the illustrative example, this was associated with lower effect size values compared to the lack of normalization method, using absolute values. Only three of twenty-five research articles selected between-subjects design to explore CR and RR, all of them using BSA indexation measured at each evaluation moment, which we revealed to result in the lowest effect size.11,20,30
Interestingly, even in publications that included a comparison of independent study groups (for example, pregnant women with repaired tetralogy of Fallot versus nulliparous women; or, pregnant women with gestational hypertension versus pregnant women with preeclampsia versus healthy pregnant women; or pregnant women with severe preeclampsia versus healthy pregnant women), some authors did not index echocardiographic variables to analyse cardiac adaptations during the follow-up period between study groups.13,17,18 Only Golinska-Grzybala et al. reported the importance of indexing echocardiographic parameters among study groups that differ significantly in body shapes or size.36 In contrast, the vast majority authors did not give any reason or justification for their choice of indexation method.11,12,14–16,20,22,25,27,31,32,34 A longitudinal analysis comparing study groups was not the purpose of our illustrative example.
Some studies, especially in overweight and obese subjects, suggested height-based indexing as more advantageous method than indexing to BSA for detection of left ventricular hypertrophy.1,10,39 However, the selection of a better allometric coefficient is not agreed upon and may vary according to study sample age (for example, three arose as the optimal height exponent for indexing LVM in juvenil population).40,41 The allometric coeffient 1.7 was reported as more sensitive to classify obesity-related LV hypertrophy than BSA indexation, being consistently correlated with cardiovascular events and all-cause mortality.10 In addition, LVM/height2.7 showed an increased capacity to diagnose LV hypertrophy and to detect increased (∼two-fold) population-attributable risk for fatal and nonfatal cardiovascular outcomes compared to BSA.42 In pregnancy, this method has not been explored yet.
The present study presented some limitations: small sample size including only a single tertiary center; lack of statistical evaluation of the effect size between within and between-subjects designs; the findings from our illustrative example only apply to LVM assessment, limiting the potential inferences for other cardiac metrics. In addition, the results about effect size differences could not transpose into clinically relevant findings, and there was no longitudinal outcomes to compare the performance of different indexation methods on clinical results.
ConclusionOur literature review showed different approaches and methodologies concerning indexation of echocardiographic parameters and statistical analysis for the study of CR and RR progression in pregnancy. Although there was a most common approach: indexing to BSA at the time of evaluation (twenty-one out of twenty-seven studies), this topic needs further discussion and consensus among the scientific community. Regarding the longitudinal progression of LVM, we tested two additional alternative indexation methods, indexing to the pre-pregnancy BSA or using allometric indexes, which yielded a higher magnitude of effect compared to the already used indexation (BSA measured at each evaluation), and an equal effect to not indexing, using within-subjects design. Additionally, we trust it is relevant to explore the effect of BSA variation in LV remodeling and RR assessment through generalized mixed model’ application adjusting to baseline BSA or weight gain/loss during pregnancy/postpartum, without any normalization of echocardiographic parameters. In summary, we have to seek the best-performing monitoring index.
Authors’ contributions| Conceived the ideas or experimental design of the study | Francisca Saraiva |
| Performed experiments/data collection | Ana Filipa Ferreira; Francisca Saraiva |
| Data analysis and interpretation | Ana Filipa Ferreira; Francisca Saraiva; Sílvia Diaz; António Barros |
| Primary author | Ana Filipa Ferreira |
| Provided revisions to scientific content of manuscript | Francisca Saraiva; Maria João Azevedo; Sílvia Diaz; António Barros; Inês Falcão-Pires; Carla Sousa; Benedita Sampaio-Maia; Carla Ramalho |
| Provided funding | Inês Falcão-Pires; Adelino Leite-Moreira |
| Provided access to crucial research component: equipment and lab | Adelino Leite-Moreira |
| Provided access to crucial research component: recruitment process | Carla Ramalho |
| Provided support to crucial research component: echocardiographic assessment | Carla Sousa |
| Provided support to crucial research component: statistical analysis | Francisca Saraiva; Sílvia Diaz; António Barros |
| Principal investigator | Inês Falcão-Pires |
This work was supported by Bolsa de Estudo João Porto da Sociedade Portuguesa de Cardiologia, by RTP Maratona da Saúde 2017 and by national funds through FCT – Portuguese Foundation for Science and Technology, under the scope of the Cardiovascular R&D Center – UnIC (UIDB/00051/2020 and UIDP/00051/2020). Ana Filipa Ferreira and Maria João Azevedo are supported by Foundation for Science and Technology (SFRH/BD/138925/2018 and SFRH/BD/144982/2019, respectively).
Conflict of interestsThe authors have no conflict of interests to declare.
The following are the supplementary data to this article:

