Cardiovascular disease is an important cause of death and disability worldwide, and hypertension is responsible for at least 45% of all deaths due to heart disease and 51% of deaths due to stroke. This study aimed to estimate and describe the distribution of prevalence, awareness, treatment and control of hypertension in the Portuguese population in 2015.
MethodsA national survey using a representative sample of 4911 individuals residing in Portugal and aged between 25 and 74 years was implemented. Trained nurses performed a health interview and a physical examination, including blood pressure measurement (right arm, three measurements at 1-min intervals). The prevalence of hypertension was stratified by gender, age group, marital status, education, occupation and type of residential area. Associations between hypertension prevalence and sociodemographic factors were assessed using bivariate and multivariate Poisson regression.
ResultsThe overall hypertension prevalence was 36.0%. The highest rates were observed in males (39.6%), in individuals aged between 65 and 74 years (71.3%), and in those with low levels of education (62.6%) and with no formal occupation (64.5%). Among hypertensive individuals, 69.8% were aware of their condition and 69.4% were under treatment, of whom 71.3% were controlled. Rates of awareness and medical treatment were significantly higher among women and older individuals.
ConclusionsA large majority of the adult Portuguese population are likely to reach blood pressure levels defined as hypertension in adulthood. Significant differences in hypertension prevalence were found according to gender, age and socioeconomic status, which highlights the importance of population strategies in public health policies.
As doenças cardiovasculares são uma importante causa de morte e incapacidade, sendo que a hipertensão arterial (HTA) é responsável por, pelo menos, 45% da mortalidade por doença cardíaca e 51% por acidente vascular cerebral. Este estudo pretende estimar e descrever a distribuição da prevalência, awareness, tratamento e controlo da HTA na população portuguesa em 2015.
MétodosRealizou-se um inquérito nacional com uma amostra representativa de 4911 indivíduos, dos 25 aos 74 anos, residentes em Portugal, e que compreendia a realização de uma entrevista de saúde e exame físico que incluía a medição da pressão arterial (braço direito, três medidas, intervalos de um minuto). A prevalência de HTA foi estratificada por sexo, grupo etário, estado civil, educação, ocupação e nível de urbanização. Estimou-se a associação entre a HTA e os fatores sociodemográficos usando regressão de Poisson bivariada e multivariada.
ResultadosA prevalência de HTA foi de 36,0%, sendo mais elevada em indivíduos do sexo masculino (39,6%), entre os 65 e 74 anos (71,3%), com baixo nível de escolaridade (62,6%) e sem ocupação formal (64,5%). Dos indivíduos hipertensos, 69,8% tinham conhecimento da sua condição de saúde, 69,4% faziam medicação anti hipertensora e, destes, 71,3% estavam controlados. A prevalência do conhecimento e tratamento farmacológico da HTA foi mais elevada em mulheres e indivíduos mais velhos.
ConclusõesA maioria da população adulta portuguesa poderá vir a ter HTA ao longo da vida. Foram encontradas diferenças importantes na prevalência de HTA de acordo com o sexo, a idade e o nível socioeconómico, o que enfatiza a importância de estratégias populacionais nas políticas de saúde pública.
Cardiovascular disease is the leading global cause of death and disability, causing about 17 million deaths per year, about a third of all deaths worldwide. Of these, 9.4 million deaths are due to hypertension-related complications.1 Hypertension is an important risk factor for developing cardiovascular disease, and is estimated to be responsible for at least 45% of all deaths due to heart disease and 51% of deaths due to stroke.2
Epidemiological studies suggest that there is a continuous increase in the risk of developing cardiovascular disease, stroke and kidney disease with increasing systolic (SBP) and diastolic (DBP) blood pressure levels.3,4 In 2008, approximately 40% of adults aged over 25 years worldwide had been diagnosed with hypertension.5 In Europe, the European Health Examination Survey (EHES) Pilot Project reported a hypertension prevalence of 33.1% among men and 22.8% among women (aged 25-64 years), although with considerable variation in blood pressure measurements between different populations.6
In Portugal, high hypertension prevalences have been previously reported for the general population.7,8 Two studies, representative of the Portuguese population (aged 18-90 years, Portuguese mainland), which included blood pressure measurement, have been performed: one in 2003 (the PAP study), which reported a prevalence of 42.1%,9 and the other in 2011-2012 (the PHYSA study),10 in which the prevalence was 42.2%. In 2014, the fifth Portuguese National Health Survey estimated a lower prevalence of hypertension (24.5%), but this was based on the Portuguese population over 15 years old and on self-reported data.11
Monitoring hypertension prevalence in the Portuguese population is essential for public health planning, especially for the definition of health strategies in primary prevention, such as nutrition policies, and also hypertension management, resource allocation and appraisal of health programs. Moreover, indicators of availability of and compliance with appropriate treatment (prevalence of individuals who are aware of their condition, are being treated and have hypertension under control) also need to be nationally monitored, which will help public health professionals to tailor strategies of hypertension prevention for high-risk individuals.
Given this context, the aim of this study was firstly to estimate and describe the distribution of hypertension prevalence in the Portuguese population in 2015, and secondly to estimate the distribution of awareness, treatment and control of hypertension.
MethodsThe 2015 Portuguese National Health Examination Survey (INSEF) was a cross-sectional population-based study by the National Health Institute Doutor Ricardo Jorge (INSA) in cooperation with the five Regional Health Administrations, the two Regional Health Secretariats of the Autonomous Regions of the Azores and Madeira, and the Norwegian Institute of Public Health.12
Target populationThe INSEF target population was non-institutionalized individuals aged between 25 and 74 years, resident in Portugal for more than 12 months, and able to follow an interview in Portuguese.
SamplingSampling was based on a two-stage probabilistic stratified cluster design. The national territory was divided into 386 primary sampling units (PSUs), corresponding to the catchment areas of the health centers. The PSUs were stratified by region and by type of residential area, with allocation proportional to the population weight.
In the first stage, 49 PSUs (seven per region) were selected with selection probability proportional to population size. In the second stage, individuals (secondary sampling units), registered users of the National Health System, were selected in each selected PSU by simple random sampling.
The minimum sample size was set at 4200 individuals at national level in order to estimate the expected prevalence of 50% with an error margin of ±5% at a 95% confidence level, assuming a design effect of 1.5.12 The original sample size was inflated to 12 289 individuals to account for differences in response rates expected at regional level.
Recruitment of participantsAll the selected individuals were invited to participate by letter two weeks prior to the beginning of the fieldwork. One week later, they were contacted by telephone to assess eligibility and to schedule an appointment with the study team in their health center. For those who did not agree to participate, a brief questionnaire concerning various health conditions and behaviors was administered by telephone.12
Data collectionThe survey encompassed core physical measurements, blood collection and a health interview. The INSEF fieldwork took place between February and December 2015.
Health professionals who had completed about 21 hours of training on all survey procedures conducted all interviews and examinations in health center facilities.
Information on sociodemographic characteristics, health status, disease and disability, health determinants and risk factors, preventive health care and use of health care services, including medication intake and self-reported medical diagnosis of hypertension, was collected by computer-assisted personal interview.
Blood pressure was measured according to the EHES procedures13 using an automated blood pressure measurement device (Omron M6). Cuffs were selected according to the individual's arm size (M for arm conference ≤32 cm; L for arm conference >32 cm). All participants rested for 5 min in a sitting position before the measurements. Three consecutive measurements were performed on the right arm at 1-min intervals. Specific medical conditions defined in the EHES procedures13 were considered exclusion criteria for blood pressure measurement.
Data quality, including interobserver variability in blood pressure measurement, was monitored during the fieldwork. The monitoring included checking the distribution of the last digit of the measures and also the mean value of each parameter measured by nurse and instrument.12,13
For the purposes of this study, blood pressure was recorded as the mean of the second and third readings if all three readings were available, or the mean of the first and second readings if the third reading was missing, or the second, third or first reading if two consecutive readings were missing.
Measurements and definitionsThe definitions proposed for the EHES were used for this study.14
Hypertension prevalence was defined as the proportion of individuals among all survey participants with SBP≥140 mmHg or DBP≥90 mmHg or who reported taking antihypertensive medication two weeks before the interview (defined in EHES as actual or potential hypertension).
The prevalence of awareness of hypertension was defined as the proportion of individuals among those defined as having hypertension who self-reported hypertension, as diagnosed by a physician.
The prevalence of antihypertensive drug use was defined as the proportion of individuals who reported taking antihypertensive medication among those classified as having hypertension.
The proportion of controlled hypertension was defined as the proportion of individuals with SBP<140 mmHg or DBP<90 mmHg among those who reported taking antihypertensive medication in the two weeks before the interview.
The distribution of individuals according to the month of the last blood pressure measurement by a physician was classified as follows: less than three months; 3-5 months; 6-11 months; 12 months or more.
Statistical analysisThe survey response rate was calculated as the proportion of participants to the total number of eligible cases and cases with unknown eligibility.12
Means, standard deviations, counts and percentages were used to describe study participants.
Hypertension prevalence was stratified by gender (female or male), age group (25-44, 45-54, 55-64, 65-74 years), marital status (married or in a civil union, unmarried [single, divorced, separated or widowed]), working status (employed, unemployed, other [student, retired or homemaker]), educational level (no formal education or the first cycle [four years] of basic education, second or third cycle [six or eight years] of basic education, secondary education, higher education) and type of residential area (urban or rural). Associations between hypertension and sociodemographic factors were assessed by crude (PR) and adjusted (aPR) prevalence ratios estimated using bivariate and multivariate Poisson regression models, respectively. Poisson regression models have been recently identified as a better choice than logistic regression models for cross-sectional studies when the outcome event is not a rare one.15–17 All variables found to be significant in bivariate analyses were introduced into the multiple regression models.
Awareness, treatment and control of hypertension were also stratified by gender and age group.
All statistical analyses were performed using sampling weights to account for different selection probabilities resulting from the complex sample design and to match the population distribution in terms of geographic region, age group and gender.18
The statistical analysis was carried out using [SVY] in Stata® version 11 (College Station, TX).19 The significance level for all analyses was set at 5%.
Ethical considerationsThe INSEF study was approved by the Ethics Committee of the Portuguese National Health Institute Doutor Ricardo Jorge, the National Data Protection Commission (CNPD), and eight regional ethics committees. Written informed consent was obtained from all participants before data collection.
ResultsOf the 12289 selected individuals, 4911 participated in INSEF 2015, leading to a participation rate of 43.9%. Only one individual did not undergo blood pressure measurement due to a medical condition.
The participants’ characteristics are described in Supplementary Table 1. Participants were mostly married or in a civil union (68.4%), of working age (84.3% aged 25-64 years); 27.7% had only the first cycle or no education, 73.6% lived in an urban area and 61.9% were employed.
Mean SBP and DBP were 125.4 mmHg (95% confidence interval [CI]: 124.3-126.3; standard deviation [SD]: 16.0) and 73.9 mmHg (95% CI: 73.2-74.7; SD: 10.0), respectively. Both SBP and DBP were higher in males (SBP: 130.0 mmHg, 95% CI: 128.8-131.3, SD: 14.5 and DBP: 76.0 mmHg, 95% CI: 75.1-76.8, SD: 9.9) than in females (SBP: 121.0 mmHg, 95% CI: 119.5-122.6, SD: 16.1 and DBP: 72.1 mmHg, 95% CI: 71.1-73.2, SD: 9.7).
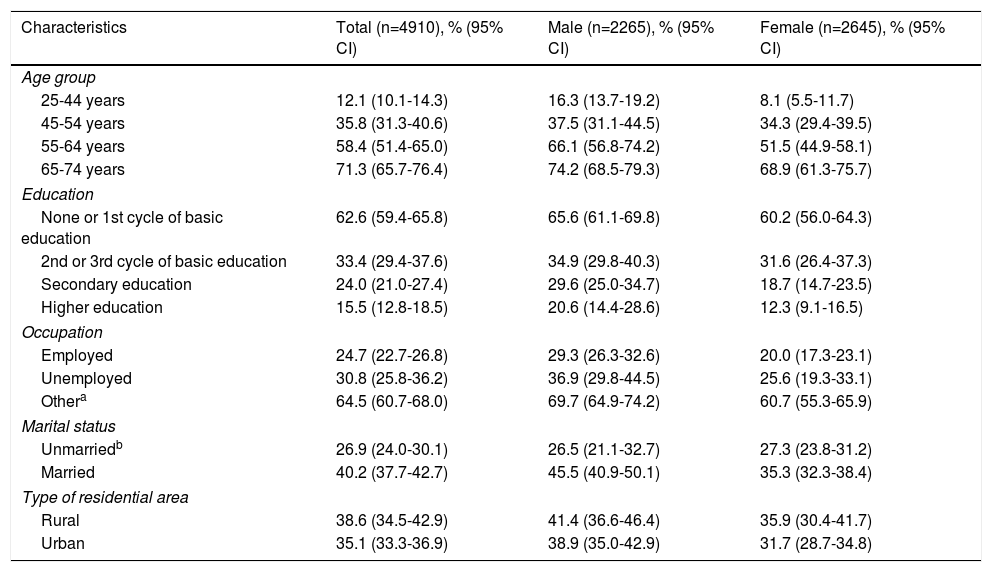
The overall hypertension prevalence was 36.0% (95% CI: 34.3-37.7). A significantly higher prevalence was observed in males (39.6%, 95% CI: 36.5-42.8) than in females (32.7%, 95% CI: 30.1-35.5). Prevalence increased with age, reaching 71.3% in the 65-74 age group. The highest prevalences were found among individuals with the first cycle or no formal education, those who had no formal occupation (student, retired or homemaker) and those who reported being married or in a civil union (Table 1).
Prevalence of hypertension according to gender, age group, education, occupation, marital status and type of residential area.
| Characteristics | Total (n=4910), % (95% CI) | Male (n=2265), % (95% CI) | Female (n=2645), % (95% CI) |
|---|---|---|---|
| Age group | |||
| 25-44 years | 12.1 (10.1-14.3) | 16.3 (13.7-19.2) | 8.1 (5.5-11.7) |
| 45-54 years | 35.8 (31.3-40.6) | 37.5 (31.1-44.5) | 34.3 (29.4-39.5) |
| 55-64 years | 58.4 (51.4-65.0) | 66.1 (56.8-74.2) | 51.5 (44.9-58.1) |
| 65-74 years | 71.3 (65.7-76.4) | 74.2 (68.5-79.3) | 68.9 (61.3-75.7) |
| Education | |||
| None or 1st cycle of basic education | 62.6 (59.4-65.8) | 65.6 (61.1-69.8) | 60.2 (56.0-64.3) |
| 2nd or 3rd cycle of basic education | 33.4 (29.4-37.6) | 34.9 (29.8-40.3) | 31.6 (26.4-37.3) |
| Secondary education | 24.0 (21.0-27.4) | 29.6 (25.0-34.7) | 18.7 (14.7-23.5) |
| Higher education | 15.5 (12.8-18.5) | 20.6 (14.4-28.6) | 12.3 (9.1-16.5) |
| Occupation | |||
| Employed | 24.7 (22.7-26.8) | 29.3 (26.3-32.6) | 20.0 (17.3-23.1) |
| Unemployed | 30.8 (25.8-36.2) | 36.9 (29.8-44.5) | 25.6 (19.3-33.1) |
| Othera | 64.5 (60.7-68.0) | 69.7 (64.9-74.2) | 60.7 (55.3-65.9) |
| Marital status | |||
| Unmarriedb | 26.9 (24.0-30.1) | 26.5 (21.1-32.7) | 27.3 (23.8-31.2) |
| Married | 40.2 (37.7-42.7) | 45.5 (40.9-50.1) | 35.3 (32.3-38.4) |
| Type of residential area | |||
| Rural | 38.6 (34.5-42.9) | 41.4 (36.6-46.4) | 35.9 (30.4-41.7) |
| Urban | 35.1 (33.3-36.9) | 38.9 (35.0-42.9) | 31.7 (28.7-34.8) |
An association was found between hypertension, male gender and being married or in a civil union, while an increase in prevalence was found with age, lower educational level and having an occupational status other than employed or unemployed.
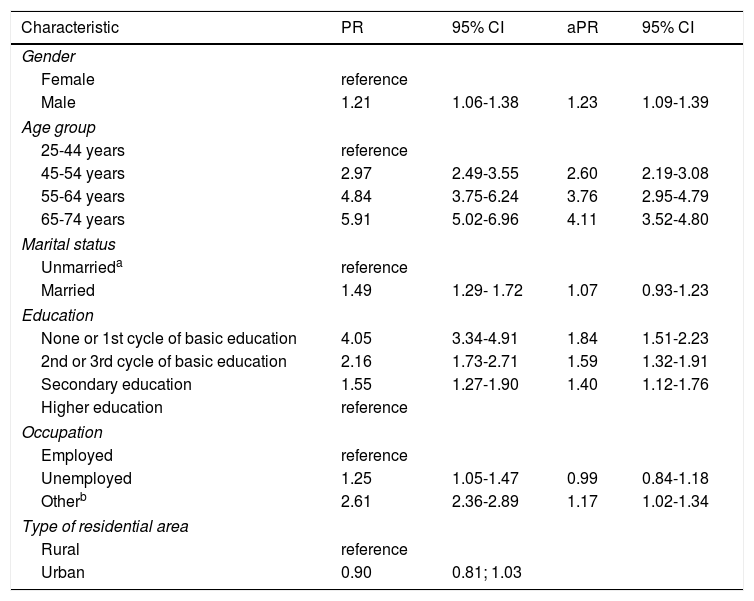
After adjustment, the association with age, education and occupation decreased and no statistical association was found with marital status (Table 2). Nevertheless, the highest aPR was observed among individuals aged between 65 and 74 years, who had no or only the first cycle of basic education, males, and those who had an occupational status other than employed or unemployed (Table 2). In this subgroup (n=214), the hypertension prevalence was 80.9% (95% CI: 74.5-85.9).
Crude and adjusted prevalence ratios of hypertension according to gender, age group, education, occupation, marital status and type of residential area.
| Characteristic | PR | 95% CI | aPR | 95% CI |
|---|---|---|---|---|
| Gender | ||||
| Female | reference | |||
| Male | 1.21 | 1.06-1.38 | 1.23 | 1.09-1.39 |
| Age group | ||||
| 25-44 years | reference | |||
| 45-54 years | 2.97 | 2.49-3.55 | 2.60 | 2.19-3.08 |
| 55-64 years | 4.84 | 3.75-6.24 | 3.76 | 2.95-4.79 |
| 65-74 years | 5.91 | 5.02-6.96 | 4.11 | 3.52-4.80 |
| Marital status | ||||
| Unmarrieda | reference | |||
| Married | 1.49 | 1.29- 1.72 | 1.07 | 0.93-1.23 |
| Education | ||||
| None or 1st cycle of basic education | 4.05 | 3.34-4.91 | 1.84 | 1.51-2.23 |
| 2nd or 3rd cycle of basic education | 2.16 | 1.73-2.71 | 1.59 | 1.32-1.91 |
| Secondary education | 1.55 | 1.27-1.90 | 1.40 | 1.12-1.76 |
| Higher education | reference | |||
| Occupation | ||||
| Employed | reference | |||
| Unemployed | 1.25 | 1.05-1.47 | 0.99 | 0.84-1.18 |
| Otherb | 2.61 | 2.36-2.89 | 1.17 | 1.02-1.34 |
| Type of residential area | ||||
| Rural | reference | |||
| Urban | 0.90 | 0.81; 1.03 | ||
Given that no effect modification was found related to gender, adjusted prevalence ratios were not stratified by gender.
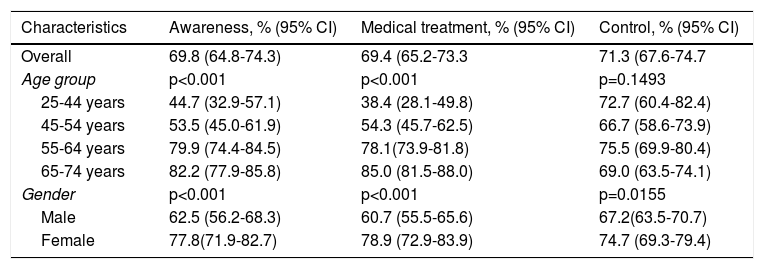
Among hypertensive individuals, 69.8% were aware of their condition and 69.4% were under medical treatment. The proportions of individuals who were aware of their condition and who were under medical treatment were higher among females (77.8% and 78.9%, respectively) than males (62.5% and 60.7%) and increased with age in both sexes (Table 3).
Proportion of awareness, treatment and control of hypertension according to age group and gender.
| Characteristics | Awareness, % (95% CI) | Medical treatment, % (95% CI) | Control, % (95% CI) |
|---|---|---|---|
| Overall | 69.8 (64.8-74.3) | 69.4 (65.2-73.3 | 71.3 (67.6-74.7 |
| Age group | p<0.001 | p<0.001 | p=0.1493 |
| 25-44 years | 44.7 (32.9-57.1) | 38.4 (28.1-49.8) | 72.7 (60.4-82.4) |
| 45-54 years | 53.5 (45.0-61.9) | 54.3 (45.7-62.5) | 66.7 (58.6-73.9) |
| 55-64 years | 79.9 (74.4-84.5) | 78.1(73.9-81.8) | 75.5 (69.9-80.4) |
| 65-74 years | 82.2 (77.9-85.8) | 85.0 (81.5-88.0) | 69.0 (63.5-74.1) |
| Gender | p<0.001 | p<0.001 | p=0.0155 |
| Male | 62.5 (56.2-68.3) | 60.7 (55.5-65.6) | 67.2(63.5-70.7) |
| Female | 77.8(71.9-82.7) | 78.9 (72.9-83.9) | 74.7 (69.3-79.4) |
CI: confidence interval.
Weighting estimates to account for different selection probabilities resulting from complex sample design.
Of those under medical treatment, 71.3% had optimal blood pressure levels, and no significant differences were found in gender or age group (Table 3).
At the population level 25.0% (95% CI: 23.3-26.7) of individuals aged 25-74 years were taking antihypertensive medication.
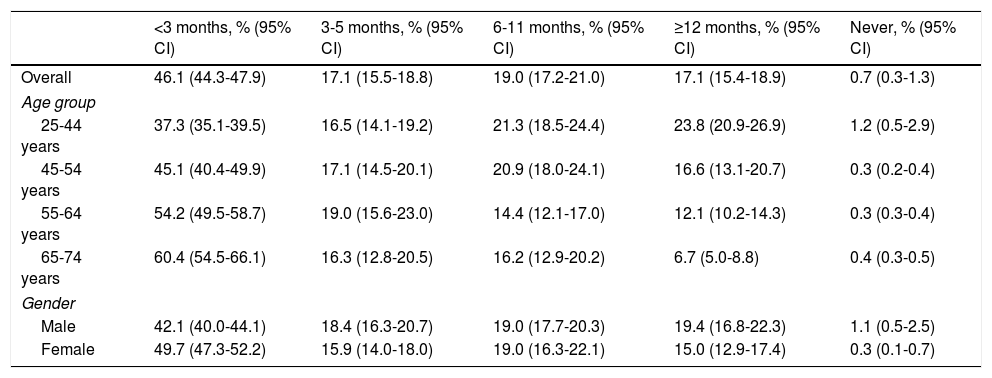
Overall, 82.2% of the population aged 25-74 years reported having had their blood pressure measured by a health professional in the 12 months prior to the interview and almost half (46.1%) reported having had it measured in the previous three months. The proportion of individuals whose blood pressure had been measured in the three months before the interview increased with age (60.4% in the oldest age group) and was higher among females (49.7%).
Only 0.7% of all participants reported never having had their blood pressure measured. Although the point estimate was higher among male participants (1.1%), no significant differences were found between the sexes (Table 4).
Distribution of the population according to the last blood pressure measurement by a health professional by age group and gender.
| <3 months, % (95% CI) | 3-5 months, % (95% CI) | 6-11 months, % (95% CI) | ≥12 months, % (95% CI) | Never, % (95% CI) | |
|---|---|---|---|---|---|
| Overall | 46.1 (44.3-47.9) | 17.1 (15.5-18.8) | 19.0 (17.2-21.0) | 17.1 (15.4-18.9) | 0.7 (0.3-1.3) |
| Age group | |||||
| 25-44 years | 37.3 (35.1-39.5) | 16.5 (14.1-19.2) | 21.3 (18.5-24.4) | 23.8 (20.9-26.9) | 1.2 (0.5-2.9) |
| 45-54 years | 45.1 (40.4-49.9) | 17.1 (14.5-20.1) | 20.9 (18.0-24.1) | 16.6 (13.1-20.7) | 0.3 (0.2-0.4) |
| 55-64 years | 54.2 (49.5-58.7) | 19.0 (15.6-23.0) | 14.4 (12.1-17.0) | 12.1 (10.2-14.3) | 0.3 (0.3-0.4) |
| 65-74 years | 60.4 (54.5-66.1) | 16.3 (12.8-20.5) | 16.2 (12.9-20.2) | 6.7 (5.0-8.8) | 0.4 (0.3-0.5) |
| Gender | |||||
| Male | 42.1 (40.0-44.1) | 18.4 (16.3-20.7) | 19.0 (17.7-20.3) | 19.4 (16.8-22.3) | 1.1 (0.5-2.5) |
| Female | 49.7 (47.3-52.2) | 15.9 (14.0-18.0) | 19.0 (16.3-22.1) | 15.0 (12.9-17.4) | 0.3 (0.1-0.7) |
CI: confidence interval.
Weighting estimates to account for different selection probabilities resulting from complex sample design.
Hypertension is a major risk factor for cardiovascular disease in the Portuguese population, and its prevalence increases with age, reaching more than 70% of the population aged 65-74 years in 2015. In our overall study population, 36.0% of those aged between 25 and 74 years had hypertension. Higher prevalences were observed in males, older individuals (65-74 years), those who had no or only the first cycle of basic education, and those with occupational status other than employed or unemployed. Regarding those classified as having hypertension, 69.8% were aware of their condition, 69.4% were under medical treatment and 71.3% of treated individuals reached optimal blood pressure levels.
There is evidence that those who do not participate in health surveys are less interested in their own health, have less healthy behaviors and are less healthy than those who agree to participate.20–23 As our participation rate was 43.9%, potential differences between participants and non-participants could have biased our results, most likely toward underestimation of the prevalence of hypertension. However, self-reported use of antihypertensive drugs was similar between participants (25.0%) and non-participants (26.0%) (Supplementary Table 2), suggesting that this selection bias had at most a minor effect on our estimates. The fact that we followed the procedures recommended for the EHES,13,14 performing a prior pilot study, training staff in study procedures, using comparable target populations and monitoring data quality during the survey, may have helped to minimize misclassification bias.
Compared to previous studies performed in representative samples of the Portuguese population that used direct blood pressure measurements, a slightly lower hypertension prevalence was found (42.1% in the PAP study in 20039 and 42.2% in the PHYSA study, 2011-1210). Nevertheless, when comparing hypertension prevalence by age group and gender between the three studies, significant differences were only observed with the PAP study.9,10 It cannot therefore be excluded that the observed differences may derive to some extent from studying a younger population than that used in previous studies.
The higher prevalence observed in males6,9,10 and in older individuals6,8–10 was in line with previous studies and showed hypertension to be a major cardiovascular risk factor in the adult Portuguese population. Although biological factors also potentially play a part, the differences found highlight disparities in the distribution of risk factors for hypertension between the sexes and between socioeconomic groups. For instance, a higher prevalence of smoking24 and higher salt consumption10 have been observed in Portuguese males.
Regarding self-awareness of hypertension, there was a higher proportion of individuals aware of their condition in 2015 than in 2003 (69.8% vs. 45.7%). However, compared to figures for 2011-12, awareness was lower in 2015 (69.8% vs. 76.6%). The same was found regarding the proportion of individuals under medical treatment (INSEF, 2015: 69.4%; PAP, 2003: 38.9% and PHYSA, 2011-12: 74.9%). It is important to highlight the increase in the number of treated individuals who reached optimal blood pressure levels over the years in all age groups compared to previous studies (PAP, 2003: 11.2%; PHYSA, 2011-12: 42.5%; INSEF, 2015: 71.3%).9,10 However, the target populations in 2003 and 2011-12 (age 18-90 years, mainland population only) were not fully comparable to the target population studied in 2015 (age 25-74 years, including Madeira and the Azores), which may explain the differences observed. Moreover, the observed differences may still be due to different procedures being used for blood pressure measurement in each study.
Although 82.2% of the adult Portuguese population (age 25-74 years) reported having had their blood pressure measured in the 12 months preceding the interview, only 69.8% of hypertensive individuals were aware of their condition. This may be explained by the high hypertension incidence observed in Portugal,25 but may also indicate a low level of understanding of their condition, particularly if no pharmacological treatment was prescribed.
Males had their blood pressure measured less frequently and were less likely to be aware of their condition and consequently to be under medical treatment. Considering that the highest hypertension prevalence was observed in males, this may indicate a misunderstanding of the risk of having high blood pressure.
In addition, the lowest level of hypertension awareness was found in those aged 25-44 years, which suggests that they had a low perception of their risk. Although this age group has a lower incidence of hypertension than the other age groups, studies show that hypertension is no longer an uncommon condition at younger ages, which is in agreement with the increasing hypertension incidence observed in young Portuguese adults in recent years.25
Our results appear to be in line with the decrease in mortality from cardiovascular and cerebrovascular disease observed in Portugal in the last decade,26 although this remains above the average for European Union countries. These findings coincide with preventive measures implemented by the National Programs for Cerebro- and Cardiovascular Diseases, Prevention and Control of Tobacco Use, and Promotion of Healthy Nutrition. These measures include approval and implementation of a national law reducing levels of salt in bread, and entering into contracts with primary healthcare units to achieve specific levels of control in hypertensive patients. Although the value of some of these preventive actions is well known,27 it would be useful to estimate their effect in Portugal, particularly of those related to delivery of care and organization of local services. Using national surveys to monitor hypertension indicators (mortality, incidence, prevalence and control) will help to assess different preventive measures implemented over time.
ConclusionsThis study indicates that a large majority of the adult Portuguese population are likely to reach blood pressure levels defined as hypertension during adulthood. Differences in hypertension prevalence by age, gender and socioeconomic status highlight the need to implement wide-population strategies that do not increase heath inequalities. Primordial and primary prevention strategies targeting hypertension risk factors such as smoking, alcohol consumption, salt intake and lack of exercise throughout life may reduce hypertension incidence in the future while avoiding health inequalities. In addition, secondary and tertiary prevention strategies are still needed, given the high prevalence observed, and should be directed at the most affected population groups (males, those aged 65-74 years and those with little or no formal education).
Funding sourcesThe Portuguese National Health Examination Survey was developed as part of the project “Improvement of epidemiological health information to support public health decision and management in Portugal. Towards reduced inequalities, improved health, and bilateral cooperation”, which received a €1,500,000 grant from Iceland, Liechtenstein and Norway through the EEA and Norway Grants.
Conflicts of interestThe authors have no conflicts of interest to declare.
The authors are grateful to all the professionals who were involved in the INSEF fieldwork and to all the INSEF participants, as well as to the EHES reference center hosted by the National Institute for Health and Welfare, Finland.
L. Antunes, M. Barreto, A. Gil, V. Gaio, I. Kislaya, S. Namorado, A. Santos, AP. Rodrigues, B. Nunes, C. Matias Dias (Departamento de Epidemiologia, Instituto Nacional de Saúde Doutor Ricardo Jorge, Lisboa, Portugal), C. Alves Alves (Departamento de Saúde Pública, Administração Regional de Saúde do Norte), E. Castilho (Departamento de Saúde Pública e Planeamento, Administração Regional de Saúde do Algarve), E. Cordeiro (Departamento de Saúde Pública, Administração Regional de Saúde do Centro), A. Dinis (Departamento de Planeamento e Contratualização - Núcleo de Estudos e Planeamento, Administração Regional de Saúde de Lisboa e Vale do Tejo), T. Prokopenko (Departamento de Saúde Pública, Administração Regional de Saúde do Alentejo), AC. Silva (Instituto de Administração da Saúde e Assuntos Sociais, Secretaria Regional de Saúde da Região Autónoma da Madeira), P. Vargas (Divisão de Planeamento e Qualidade, Direção de Serviços de Cuidados de Saúde, Direção Regional da Saúde, Secretaria Regional da Saúde da Região Autónoma dos Açores).
