


Cardiac resynchronization therapy (CRT) is an established therapeutic option for heart failure, but despite careful selection around 30% of the patients still do not respond to this therapy. The standard electrocardiogram (ECG) is a practical and inexpensive tool to assess potential responders to CRT but with conflicting evidence regarding the value of different ECG parameters. As such, we conducted a systematic review of real-world studies to assess the value of pre-implantation standard ECG parameters in predicting response to CRT.
MethodsWe searched on PubMed, Scopus, and Web of Knowledge online databases to identify analytic studies and synthesized results through evidence tables.
ResultsSixty-two eligible articles were included in this review. Traditional predictors of response were QRS duration ≥150 ms and the presence of left bundle branch block morphology. Contemporary ECG parameters, such as the presence of QRS notching or fragmentation, the S wave assessment, the time to intrinsicoid deflection (ID) in lateral leads, and a lead one ratio ≥12 also showed great potential in assessing response to CRT.
ConclusionsThis review highlights the promising capability of the standard ECG in predicting response to CRT, particularly when using more contemporary predictors, while emphasizing the necessity for further research to validate the prognostic value of these predictors.
A terapêutica de ressincronização cardíaca (TRC) é uma opção terapêutica consolidada para a insuficiência cardíaca; no entanto, apesar da seleção criteriosa, cerca de 30% dos doentes não respondem a esta terapêutica. O eletrocardiograma (ECG) padrão é uma ferramenta prática e económica para avaliar potenciais respondedores à TRC, mas existem evidências contraditórias sobre o valor de diferentes parâmetros do ECG. Assim, realizámos uma revisão sistemática de estudos em contexto clínico real para avaliar o valor dos parâmetros de ECG padrão antes da implantação na predição de resposta à TRC.
MétodosRealizámos uma pesquisa nas bases de dados PubMed, Scopus e Web of Knowledge para identificar estudos analíticos e sintetizámos os resultados em tabelas de evidências.
ResultadosForam incluídos 62 artigos elegíveis nesta revisão. Os preditores tradicionais de resposta foram a duração do QRS ≥ 150ms e a presença de bloqueio do ramo esquerdo (BRE) com morfologia típica. Parâmetros de ECG contemporâneos, como a presença de entalhes ou fragmentação do QRS, a análise da onda S, o tempo de deflexão intrinsicóide (ID) nas derivações laterais e uma razão na derivação DI (LOR) ≥ 12, mostraram também grande potencial na avaliação da resposta à TRC.
ConclusõesEsta revisão destaca a capacidade promissora do ECG padrão em prever a resposta à TRC, particularmente ao utilizar preditores mais contemporâneos, sublinhando a necessidade de mais investigação para validar o valor prognóstico destes preditores.
Heart failure (HF) is a major public health problem, with an incidence in Europe of about 5/1000 person-years1,2 and a prevalence of 1–2% in adults,3 although there is evidence that these figures might be underestimated.4 The increasing prevalence of chronic HF, compounded by improved patient survival and higher elderly patient proportion, puts additional economic strain on healthcare systems.5 Cardiac resynchronization therapy (CRT) is currently an established therapeutic option for patients with symptomatic HF and electromechanical dyssynchrony,6 improving cardiac function and functional capacity while reducing morbidity, mortality, and hospitalizations.7 Nevertheless, and despite careful patient selection, improvement in implantation techniques and optimal device programming, the response to CRT is variable and up to 30% of patients demonstrate sub-optimal response8 notwithstanding the use of several approaches to improve CRT response.9 Standard electrocardiogram (ECG) is recommended in all patients with suspected chronic HF not only for diagnosis but also for CRT candidate selection, and remains an accessible and practical tool to identify patients with a higher potential for CRT response, at a significantly lower cost than other methods.10 Parameters such as QRS duration (QRSd) and morphology have been traditionally used but with conflicting results in predicting CRT response, particularly in patients with borderline QRSd and atypical left bundle branch block (LBBB) pattern.10 Recently, other ECG parameters have shown promising results in predicting response to CRT, but the evidence is limited, dispersed and in need of additional validation.11 As such, we aimed to assess the ability of standard ECG to predict response to CRT by systematically reviewing the available literature. Specifically, our objective was to identify pre-implantation ECG parameters/criteria that independently predict outcomes after CRT.
MethodsSearch strategyA preliminary search was conducted on Medical Literature Analysis and Retrieval System Online (MEDLINE) using the MEDLINE (PubMed)i and the International Prospective Register of Systematic Reviews (PROSPERO)ii. No current or in progress similar systematic review or meta-analysis protocols were identified. This study was carried out according to a protocol, registered in PROSPERO (CRD42022374879), and followed the Preferred Reporting Items for Systematic Reviews and Meta-Analyses (PRISMA).12,13
We systematically searched all available literature on PubMed, Scopusiii, and Web of Knowledgeiv databases using search queries adapted for each database (described in detail in Supplemental Methods SM1. The search was restricted to articles published from 1 January 1995 (the date of the first CRT publication) through 10 November 2022. No other restrictions were applied. Manual scanning of the reference list of all selected articles was performed to identify additional pertinent articles. Specialists in the field were contacted to confirm if all pertinent information had been retrieved.
Eligibility criteriaStudies that met all the following criteria were considered for inclusion: (a.) included patients with HF and implanted CRT devices; (b.) evaluated response to CRT (symptomatic and/or volumetric); (c.) defined response and stated the criteria used; (d.) predicted response based (isolated or in association) in at least one independently assessable electrocardiographic parameter; (e.) had an analytic study design; (f.) reported objective effect measures (association and/or accuracy tests). Studies that did not meet all the criteria defined above or had any of the following criteria were excluded: (a.) non-medical related research area; (b.) ECG parameter determined only post-implant (i.e. predictor not assessable pre-CRT implantation at baseline conditions; (c.) involving non-standard ECG methods/techniques (e.g. ECG mapping or ECG imaging techniques); (d.) involving animals; (e.) including humans below 18 years of age; (f.) full-text information not available, even after contacting the corresponding author; (g.) articles in languages not fully understood by the review team.
Selection processAfter duplicate removal, each study was screened for inclusion by two out of five reviewers (PDC, DFS, MCP, FMS and JPB). The screening was made blindly and independently, initially by reading the title/abstract and later by reviewing the full text, using Rayyan (Rayyan web application [Computer program]. Rayyan Systems Inc., 2022).14 Results were blinded to reviewers, and any discrepancies were resolved by an independent reviewer (PPR). The level of agreement between the reviewers was measured using overall agreement proportions.
Data extractionData from the selected studies was extracted to an Excel spreadsheet (Microsoft 365 Apps for Enterprise [Computer program]. Version 2210, Microsoft Corporation, 2022) by two reviewers (PDC and JPB) using standardized forms. Data extraction forms (Supplemental Methods SM2) included: (a.) study information: such as first author, date and country of publication, number of centers involved, device type(s), study design and period; (b.) population: sample size, age, gender, indication, selection method, and participants lost to follow-up; (c.) exposure: statistical method(s) used, and predictor(s) assessed; and (d.) outcomes: response cut-off, assessment timing, responder proportion, co-variables used, and effect measures.
If appropriate, authors were contacted to request unpublished, missing, or additional data. Any missing study information was reported as ‘Not reported’ (NR) and any information that was not clear or is ill-defined, leading to uncertainty in interpretation, was reported as ‘Unclear’ (U); if an item was not applicable in context, it was labeled as ‘Not applicable’ (NA).
Any disagreements between the reviewers were resolved through discussion.
Risk of bias assessmentTo assess the risk of bias (RoB), data from the selected studies was extracted to an Excel spreadsheet (Microsoft 365 Apps for Enterprise [Computer program]. Version 2210, Microsoft Corporation, 2022) using a customized form (Supplemental Methods SM3) of the Quality in Prognostic Studies (QUIPS) tool.15 Three of the authors (PDC, DFS and MCP) independently classified all studies for the rating of reporting (‘Yes’ if all relevant signaling items were present, ‘No’ if none of the key items was present, ‘Partial’ if some key items to assess were present, ‘Unsure’ if some key items were ill-defined, unclear, or ambiguous, and ‘Not applicable’ if the key item did not apply to the study), and assigned a rating for RoB (‘High’, ‘Moderate’ and ‘Low’) to each of the six domains assessed (study participation, study attrition, prognostic factor measurement, outcome measurement, study confounding, and statistical analysis and reporting). The overall RoB was categorized into low (if all domains were classified as having low RoB, or up to one moderate RoB), high (if one or more domains were classified as having high RoB, or more than three moderate RoB), or moderate RoB (all other situations).16 The level of agreement (agreement proportions) between the reviewers was measured by overall agreement and determined for each domain/overall RoB. RoB plots were created using the Risk-of-bias VISualization (robvis) tool.17
Synthesis methodsTo analyze and compare findings, categorical data were represented as proportions. Continuous variables were presented as mean (standard deviation) or median [along with interquartile range] when appropriate. Dichotomous data was analyzed by odds ratios (OR) or hazard ratios (HR) and presented as the respective test result [95% confidence interval]; receiver operating characteristic and diagnostic accuracy measures (DAM) – which included sensitivity, specificity, positive predictive value, and negative predictive value – are presented as accuracy or percentages. Data was synthesized and presented through evidence tables and included a descriptive report of eligible studies’ general characteristics, methods, and summarized results (refer to Supplemental Tables ST1–ST4). Since there were not two or more eligible studies assessing the same ECG predictor using similar methods, meta-analysis was not possible.
ResultsStudy selectionA total of 13503 records (13375 from databases plus 128 from citation cross-referencing) were identified and uploaded into the Rayyan platform. After duplicate removal (5742), 7633 records were screened using the title and abstract, and, of those, 182 were assessed for eligibility through full-text review. Following full-text examination for compliance, 120 articles were excluded, resulting in 62 eligible articles included in this review.18–79Figure 1 illustrates in detail the study selection process. The overall agreement between reviewers in the screening and eligibility stages was 98% and 86%, respectively.

Preferred reporting items for systematic reviews and meta-analyses study selection flowchart.
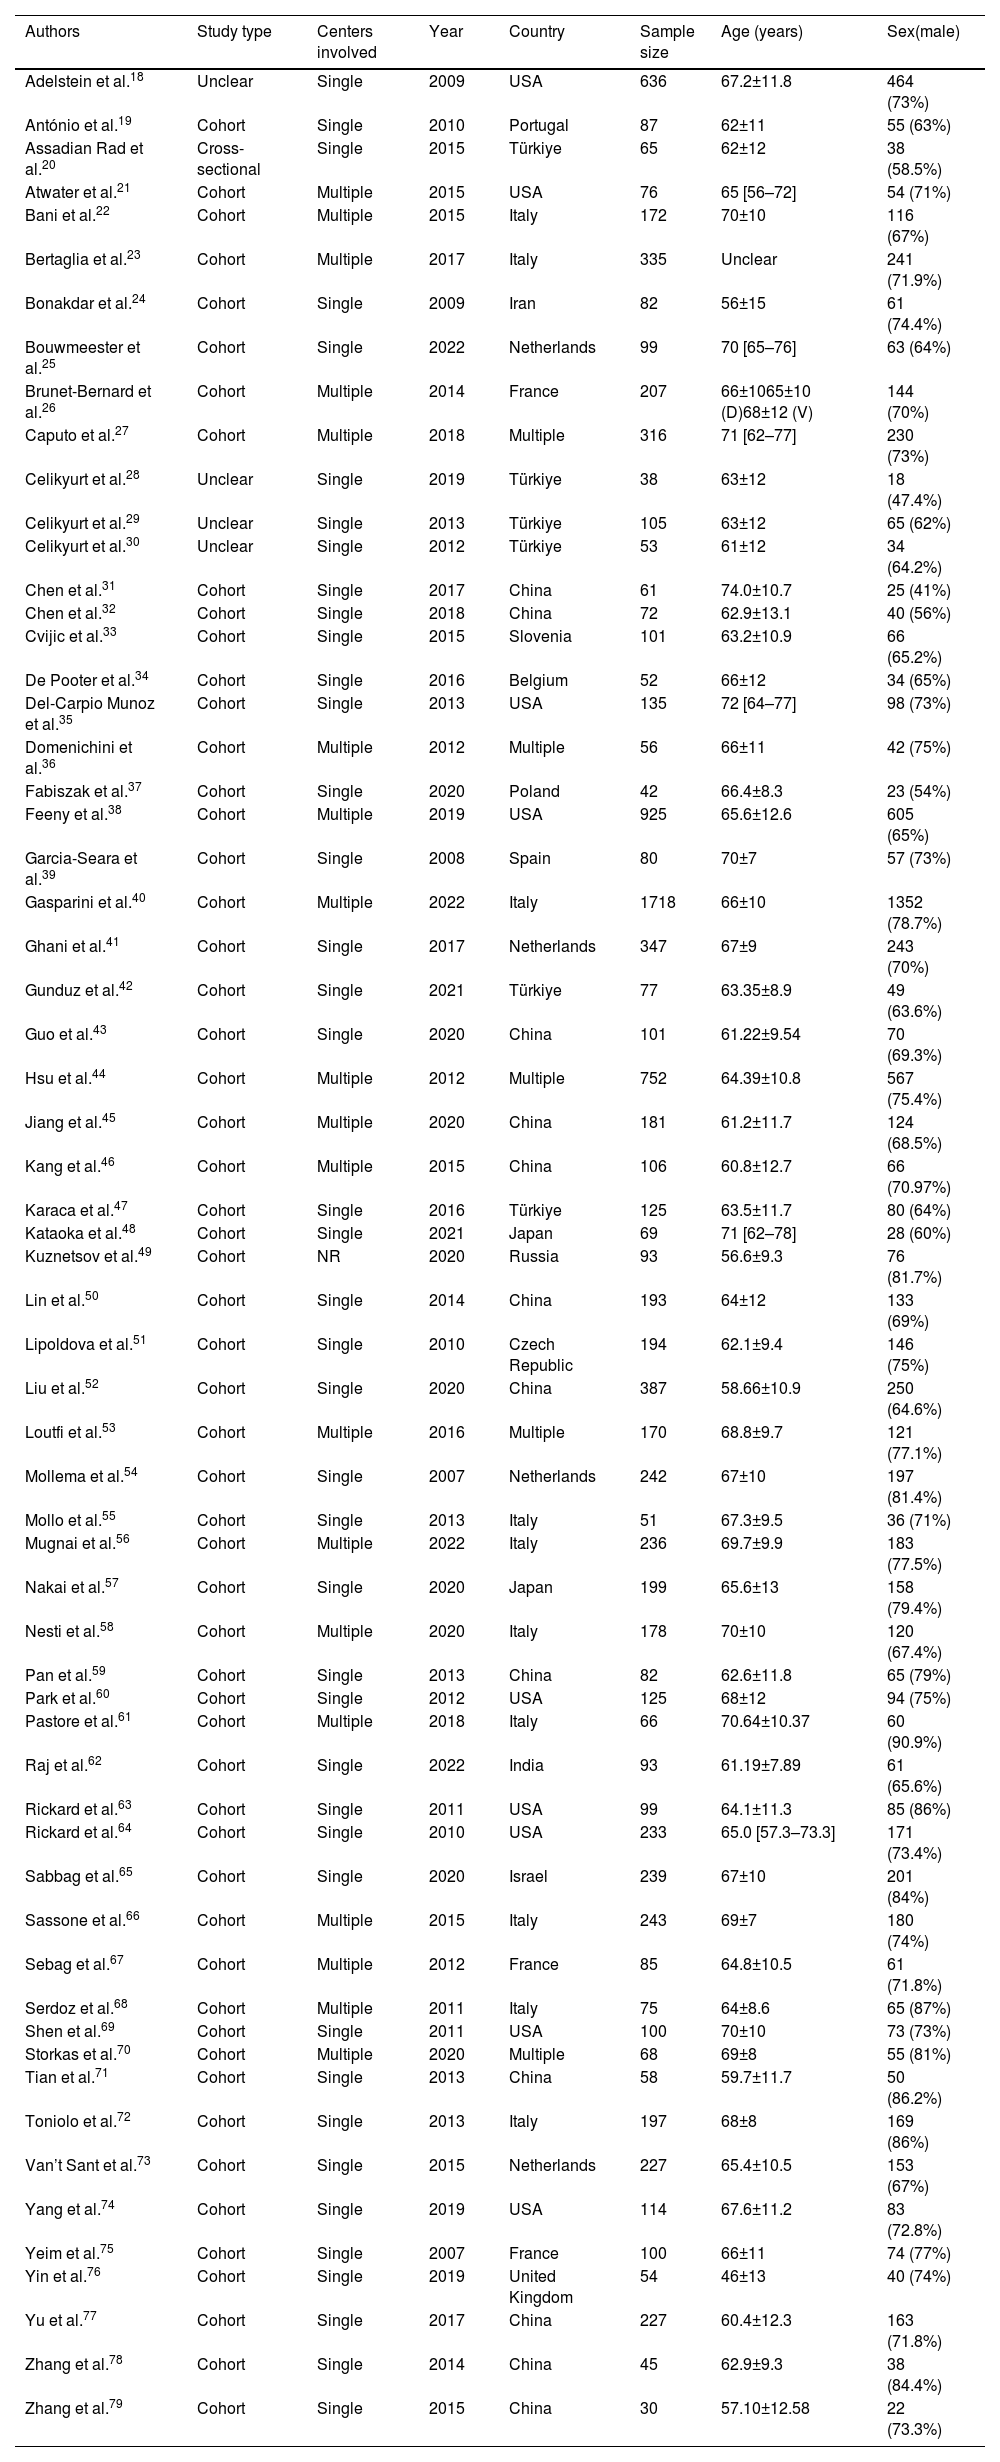
The most frequent inclusion criteria comprised patients in New York Heart Association (NYHA) class II–IV, with left ventricular ejection fraction (LVEF) ≤35% and QRSd ≥120 ms, analyzing a total of 11774 patients (median of 100 patients, ranging from 30 (79) to 1718 (40)), of which 8535 (71%) were male. All studies were observational, comprising mostly cohort studies (57; 92%) from single centers (42; 68%). Studies were published between 2007 and 2022, 22 of which (35%) within the last five years. Most studies were set in European (27; 44%) and Asian countries (24; 39%). Left ventricle (LV) lead delivery was described to be via the coronary sinus in 49 (79%) studies; the remaining 13 studies (21%) did not report where the LV lead was positioned.
These results are summarized in Table 1. A detailed description of the general characteristics of all included studies is available in Supplemental Table ST1.
Summary of the general characteristics of all included studies.
| Authors | Study type | Centers involved | Year | Country | Sample size | Age (years) | Sex(male) |
|---|---|---|---|---|---|---|---|
| Adelstein et al.18 | Unclear | Single | 2009 | USA | 636 | 67.2±11.8 | 464 (73%) |
| António et al.19 | Cohort | Single | 2010 | Portugal | 87 | 62±11 | 55 (63%) |
| Assadian Rad et al.20 | Cross-sectional | Single | 2015 | Türkiye | 65 | 62±12 | 38 (58.5%) |
| Atwater et al.21 | Cohort | Multiple | 2015 | USA | 76 | 65 [56–72] | 54 (71%) |
| Bani et al.22 | Cohort | Multiple | 2015 | Italy | 172 | 70±10 | 116 (67%) |
| Bertaglia et al.23 | Cohort | Multiple | 2017 | Italy | 335 | Unclear | 241 (71.9%) |
| Bonakdar et al.24 | Cohort | Single | 2009 | Iran | 82 | 56±15 | 61 (74.4%) |
| Bouwmeester et al.25 | Cohort | Single | 2022 | Netherlands | 99 | 70 [65–76] | 63 (64%) |
| Brunet-Bernard et al.26 | Cohort | Multiple | 2014 | France | 207 | 66±1065±10 (D)68±12 (V) | 144 (70%) |
| Caputo et al.27 | Cohort | Multiple | 2018 | Multiple | 316 | 71 [62–77] | 230 (73%) |
| Celikyurt et al.28 | Unclear | Single | 2019 | Türkiye | 38 | 63±12 | 18 (47.4%) |
| Celikyurt et al.29 | Unclear | Single | 2013 | Türkiye | 105 | 63±12 | 65 (62%) |
| Celikyurt et al.30 | Unclear | Single | 2012 | Türkiye | 53 | 61±12 | 34 (64.2%) |
| Chen et al.31 | Cohort | Single | 2017 | China | 61 | 74.0±10.7 | 25 (41%) |
| Chen et al.32 | Cohort | Single | 2018 | China | 72 | 62.9±13.1 | 40 (56%) |
| Cvijic et al.33 | Cohort | Single | 2015 | Slovenia | 101 | 63.2±10.9 | 66 (65.2%) |
| De Pooter et al.34 | Cohort | Single | 2016 | Belgium | 52 | 66±12 | 34 (65%) |
| Del-Carpio Munoz et al.35 | Cohort | Single | 2013 | USA | 135 | 72 [64–77] | 98 (73%) |
| Domenichini et al.36 | Cohort | Multiple | 2012 | Multiple | 56 | 66±11 | 42 (75%) |
| Fabiszak et al.37 | Cohort | Single | 2020 | Poland | 42 | 66.4±8.3 | 23 (54%) |
| Feeny et al.38 | Cohort | Multiple | 2019 | USA | 925 | 65.6±12.6 | 605 (65%) |
| Garcia-Seara et al.39 | Cohort | Single | 2008 | Spain | 80 | 70±7 | 57 (73%) |
| Gasparini et al.40 | Cohort | Multiple | 2022 | Italy | 1718 | 66±10 | 1352 (78.7%) |
| Ghani et al.41 | Cohort | Single | 2017 | Netherlands | 347 | 67±9 | 243 (70%) |
| Gunduz et al.42 | Cohort | Single | 2021 | Türkiye | 77 | 63.35±8.9 | 49 (63.6%) |
| Guo et al.43 | Cohort | Single | 2020 | China | 101 | 61.22±9.54 | 70 (69.3%) |
| Hsu et al.44 | Cohort | Multiple | 2012 | Multiple | 752 | 64.39±10.8 | 567 (75.4%) |
| Jiang et al.45 | Cohort | Multiple | 2020 | China | 181 | 61.2±11.7 | 124 (68.5%) |
| Kang et al.46 | Cohort | Multiple | 2015 | China | 106 | 60.8±12.7 | 66 (70.97%) |
| Karaca et al.47 | Cohort | Single | 2016 | Türkiye | 125 | 63.5±11.7 | 80 (64%) |
| Kataoka et al.48 | Cohort | Single | 2021 | Japan | 69 | 71 [62–78] | 28 (60%) |
| Kuznetsov et al.49 | Cohort | NR | 2020 | Russia | 93 | 56.6±9.3 | 76 (81.7%) |
| Lin et al.50 | Cohort | Single | 2014 | China | 193 | 64±12 | 133 (69%) |
| Lipoldova et al.51 | Cohort | Single | 2010 | Czech Republic | 194 | 62.1±9.4 | 146 (75%) |
| Liu et al.52 | Cohort | Single | 2020 | China | 387 | 58.66±10.9 | 250 (64.6%) |
| Loutfi et al.53 | Cohort | Multiple | 2016 | Multiple | 170 | 68.8±9.7 | 121 (77.1%) |
| Mollema et al.54 | Cohort | Single | 2007 | Netherlands | 242 | 67±10 | 197 (81.4%) |
| Mollo et al.55 | Cohort | Single | 2013 | Italy | 51 | 67.3±9.5 | 36 (71%) |
| Mugnai et al.56 | Cohort | Multiple | 2022 | Italy | 236 | 69.7±9.9 | 183 (77.5%) |
| Nakai et al.57 | Cohort | Single | 2020 | Japan | 199 | 65.6±13 | 158 (79.4%) |
| Nesti et al.58 | Cohort | Multiple | 2020 | Italy | 178 | 70±10 | 120 (67.4%) |
| Pan et al.59 | Cohort | Single | 2013 | China | 82 | 62.6±11.8 | 65 (79%) |
| Park et al.60 | Cohort | Single | 2012 | USA | 125 | 68±12 | 94 (75%) |
| Pastore et al.61 | Cohort | Multiple | 2018 | Italy | 66 | 70.64±10.37 | 60 (90.9%) |
| Raj et al.62 | Cohort | Single | 2022 | India | 93 | 61.19±7.89 | 61 (65.6%) |
| Rickard et al.63 | Cohort | Single | 2011 | USA | 99 | 64.1±11.3 | 85 (86%) |
| Rickard et al.64 | Cohort | Single | 2010 | USA | 233 | 65.0 [57.3–73.3] | 171 (73.4%) |
| Sabbag et al.65 | Cohort | Single | 2020 | Israel | 239 | 67±10 | 201 (84%) |
| Sassone et al.66 | Cohort | Multiple | 2015 | Italy | 243 | 69±7 | 180 (74%) |
| Sebag et al.67 | Cohort | Multiple | 2012 | France | 85 | 64.8±10.5 | 61 (71.8%) |
| Serdoz et al.68 | Cohort | Multiple | 2011 | Italy | 75 | 64±8.6 | 65 (87%) |
| Shen et al.69 | Cohort | Single | 2011 | USA | 100 | 70±10 | 73 (73%) |
| Storkas et al.70 | Cohort | Multiple | 2020 | Multiple | 68 | 69±8 | 55 (81%) |
| Tian et al.71 | Cohort | Single | 2013 | China | 58 | 59.7±11.7 | 50 (86.2%) |
| Toniolo et al.72 | Cohort | Single | 2013 | Italy | 197 | 68±8 | 169 (86%) |
| Van’t Sant et al.73 | Cohort | Single | 2015 | Netherlands | 227 | 65.4±10.5 | 153 (67%) |
| Yang et al.74 | Cohort | Single | 2019 | USA | 114 | 67.6±11.2 | 83 (72.8%) |
| Yeim et al.75 | Cohort | Single | 2007 | France | 100 | 66±11 | 74 (77%) |
| Yin et al.76 | Cohort | Single | 2019 | United Kingdom | 54 | 46±13 | 40 (74%) |
| Yu et al.77 | Cohort | Single | 2017 | China | 227 | 60.4±12.3 | 163 (71.8%) |
| Zhang et al.78 | Cohort | Single | 2014 | China | 45 | 62.9±9.3 | 38 (84.4%) |
| Zhang et al.79 | Cohort | Single | 2015 | China | 30 | 57.10±12.58 | 22 (73.3%) |
The most frequent ECG parameters used for outcome prediction were QRS duration (43 studies), morphology,39 and amplitude (two studies). QRS axis was used in seven studies, PR interval in four studies, QT interval in three studies and heart rhythm in two studies.
Traditional ECG predictorsSix studies24,43,60,63,75,76 have shown that QRS duration significantly predict response to CRT, albeit with modest effect sizes. The study by Chen et al.32 showed a greater magnitude of effect (adjusted OR: 2.68), although this was a single-center study, with a small sample size and a short follow-up period. The study by Ghani et al.41 also found QRS duration to be a good predictor when assessing super response. Two other studies also suggest that patients with shorter QRS durations are less likely to respond36 (adjusted OR: 13.8)19 although there was a considerable degree of uncertainty in this estimate. For patients with wide QRS, five studies25,44,47,53,73 have shown that a QRS duration ≥150 ms significantly increases the odds of response, with the studies by Loutfi et al.53 and Bouwmeester et al.25 showing the effect to be around four times higher. However, Sassone et al.66 suggested that the chances of non-response increase significantly in patients with very wide QRS (≥178 ms), possibly associated to the absence of mechanical dyssynchrony and therefore not correctable by biventricular pacing.
There is no evidence in four of the analyzed studies that non-LBBB or right ventricular bundle branch block patterns can predict response.40,50,61,74 On the other hand, three studies,18,36,78 using the ACC/AHA/HRS criteria,80 showed a high likelihood of response in patients with LBBB morphology (adjusted OR: ∼7). Even more, Rickard et. al64 and Yang et al.74 found that the presence of LBBB was able to predict super response (adjusted OR: ∼5 and ∼2, respectively). Caputo et. al,27 using the 200981 and 201382 ESC criteria found similar results (adjusted OR: ∼8). Using the same criteria, Liu et al.52 showed that it was able to predict super response (adjusted OR: 2.57). LBBB remained a good predictor of response in the study by Bouwmeester et al.25, using the more recent ESC criteria (2021).83 The ‘strict’ LBBB criteria proposed by Strauss84 was also found to be a good predictor of response in the studies by Brunet-Bernard et al.26 (adjusted OR: 3.18), Jiang et al. (adjusted HR: 3.01) and Van’t Sant et al.73 (adjusted OR: 2.45). The study by Tian et al.71 reported that patients with LBBB were 11 times more likely to be super responders, although with a high degree of associated uncertainty (adjusted OR: 11.680 [1.966–69.390]).
Contemporary electrocardiographic predictorsFragmented QRS and notched QRSThe presence of fragmented QRS (fQRS) is a sign of myocardial scar and was identified in the study by Assadian Rad et al.20 has a predictor of non-response to CRT (adjusted OR: 4.55). However, this study did not include an assessment of myocardial scar, and, therefore, it was not possible to determine the relationship between fQRS and scar in that population. Furthermore, the study by Nesti et al.58 failed to find such an association.
Pan et al.59 and Bertaglia et al.23 reported, respectively, that a notched QRS (nQRS) in lateral leads (adjusted OR: 4.04) or a notched QRS in at least one lead (adjusted OR: 2.1) are good predictors of response to CRT. Although novel, due to the presence of selection bias in one study and the limited size of the sample in another study, these results may not be generalizable and need to be interpreted with caution.
S wavesThe study by Kataoka et al.48 aimed at identifying the potential role of QRS amplitude in optimal patient selection by using the S-wave amplitude in right and left precordial leads. The averaged S-wave amplitude in V1–3 emerged as an independent predictor of CRT response (adjusted OR: 2.181). In contrast, the study by Jiang et al.45 showed that an S wave in V6 was significantly associated with non-response to CRT (adjusted HR: 0.33).
Lead one ratioLead one ratio (LOR) is derived by dividing the maximum positive and the maximum negative amplitudes of the QRS complex in lead I. In their study, Raj et al.62 found that a LOR ≥12 was associated with a better response to CRT (OR: 1.78 – for QRS duration ≥150 ms; OR: 2.58 – for LBBB morphology), although this resulted from univariate analysis.
Intrinsicoid deflectionDel-Carpio Munoz et al.35 identified the difference in the time to intrinsicoid deflection (ID) in leads I and aVL (adjusted OR: ∼3) and the difference of the time to ID between lead I-V1 (adjusted OR: 2.41) and lead I-QRS ratio (adjusted OR: 3.10) as a good predictor of response in patients with LBBB or a non-specific IVCD.
Other electrocardiogram predictorsQRS axis revealed a marginal ability to predict response to CRT in three of the studies,37,48,67 with an OR of around one in univariate analysis. The presence of left axis deviation (LAD) appears to be associated with higher odds of responding to CRT in the study by Garcia-Seara et al.39 (adjusted OR: 5.04), albeit with a very wide CI. Similarly, Storkas et al.70 suggested that the presence of LAD is associated with lower odds of non-response to CRT (adjusted OR: 0.21).
PR interval prolongation in the studies by Gasparini et al.40 and Sabbag et al.65 showed a decreased likelihood of response, however with several concerns regarding the degree of uncertainty and the true effect size of the estimates. In contrast, according to Gasparini et al.40, a ‘normal’ PR interval is associated with a higher likelihood of response (adjusted OR: 2.51).
Two studies addressed the value of the QT interval, either by assessing super response33 or non-response.77 The work by Yu et al.77 highlights the value of the ratio between the T wave from peak to end interval (TpTe) and QTc (TpTe/QTc) in predicting CRT non-response (adjusted OR=5.2). These results need to be interpreted with caution as this study had a small size sample from a single center and, since TpTe was not statistically significant, TpTe/QTc could have been largely determined by QTc. Moreover, it showed moderate discriminatory power for TpTe/QTc in predicting non-response to CRT (AUC: 0.616; Se: 57.3%; Sp: 63.8%).
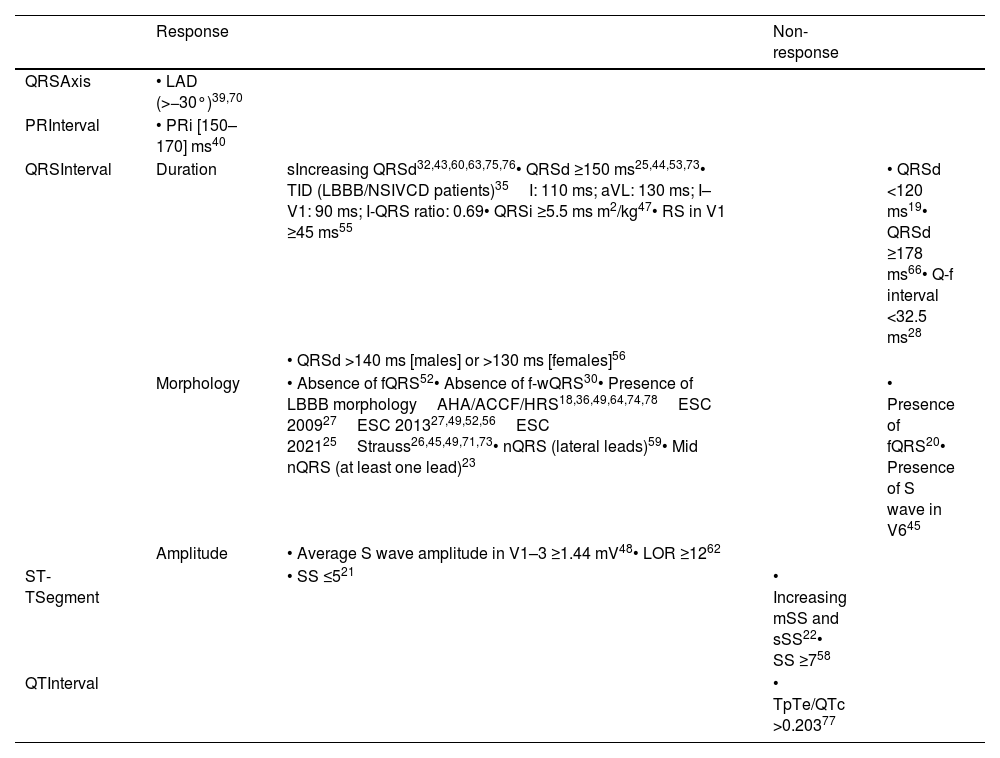
A summary of all relevant ECG predictors is presented in Table 2.
Standard electrocardiogram predictors of response and non-response to cardiac resynchronization therapy.
| Response | Non-response | |||
|---|---|---|---|---|
| QRSAxis | • LAD (>−30°)39,70 | |||
| PRInterval | • PRi [150–170] ms40 | |||
| QRSInterval | Duration | sIncreasing QRSd32,43,60,63,75,76• QRSd ≥150 ms25,44,53,73• TID (LBBB/NSIVCD patients)35I: 110 ms; aVL: 130 ms; I–V1: 90 ms; I-QRS ratio: 0.69• QRSi ≥5.5 ms m2/kg47• RS in V1 ≥45 ms55 | • QRSd <120 ms19• QRSd ≥178 ms66• Q-f interval <32.5 ms28 | |
| • QRSd >140 ms [males] or >130 ms [females]56 | ||||
| Morphology | • Absence of fQRS52• Absence of f-wQRS30• Presence of LBBB morphologyAHA/ACCF/HRS18,36,49,64,74,78ESC 200927ESC 201327,49,52,56ESC 202125Strauss26,45,49,71,73• nQRS (lateral leads)59• Mid nQRS (at least one lead)23 | • Presence of fQRS20• Presence of S wave in V645 | ||
| Amplitude | • Average S wave amplitude in V1–3 ≥1.44 mV48• LOR ≥1262 | |||
| ST-TSegment | • SS ≤521 | • Increasing mSS and sSS22• SS ≥758 | ||
| QTInterval | • TpTe/QTc >0.20377 |
AHA/ACCF/HRS: American Heart Association/American College of Cardiology Foundation/Heart Rhythm Society; BMI: body mass index; ESC: European Society of Cardiology; f-wQRS: fragmented wide QRS; LAD: left axis deviation; LBBB: left bundle branch block; LOR: lead one ratio; mSS: modified Selvester score; nQRS: notched QRS; NSIVCD: non-specific intraventricular conduction delay; PRi: PR interval: Q-f interval: time interval from Q wave to the onset of QRS fragmentation; QRSd: QRS duration; QRSi: QRS index; QTc: corrected QT interval; RS: R wave peak to S wave peak time; sSS: simplified Selvester score; SS: Selvester score; TID: time to intrinsicoid deflection; TpTe: T wave from peak to end interval.
Results of association and diagnostic accuracy measures are available, respectively, in the Supplemental Tables ST2 and ST3.
Other predictorsTo understand the interplay between electrocardiographic parameters and other factors regarding CRT response prediction, we identified other co-variates used in the reviewed studies. Consequently, 25 echocardiographic variables were identified in 49 studies while 17 clinical variables were used in 40 studies.
The most frequent variables used were gender (26 studies) and etiology of HF (20 studies). A complete description of all adjusted variables identified is available in Supplemental Table ST4.
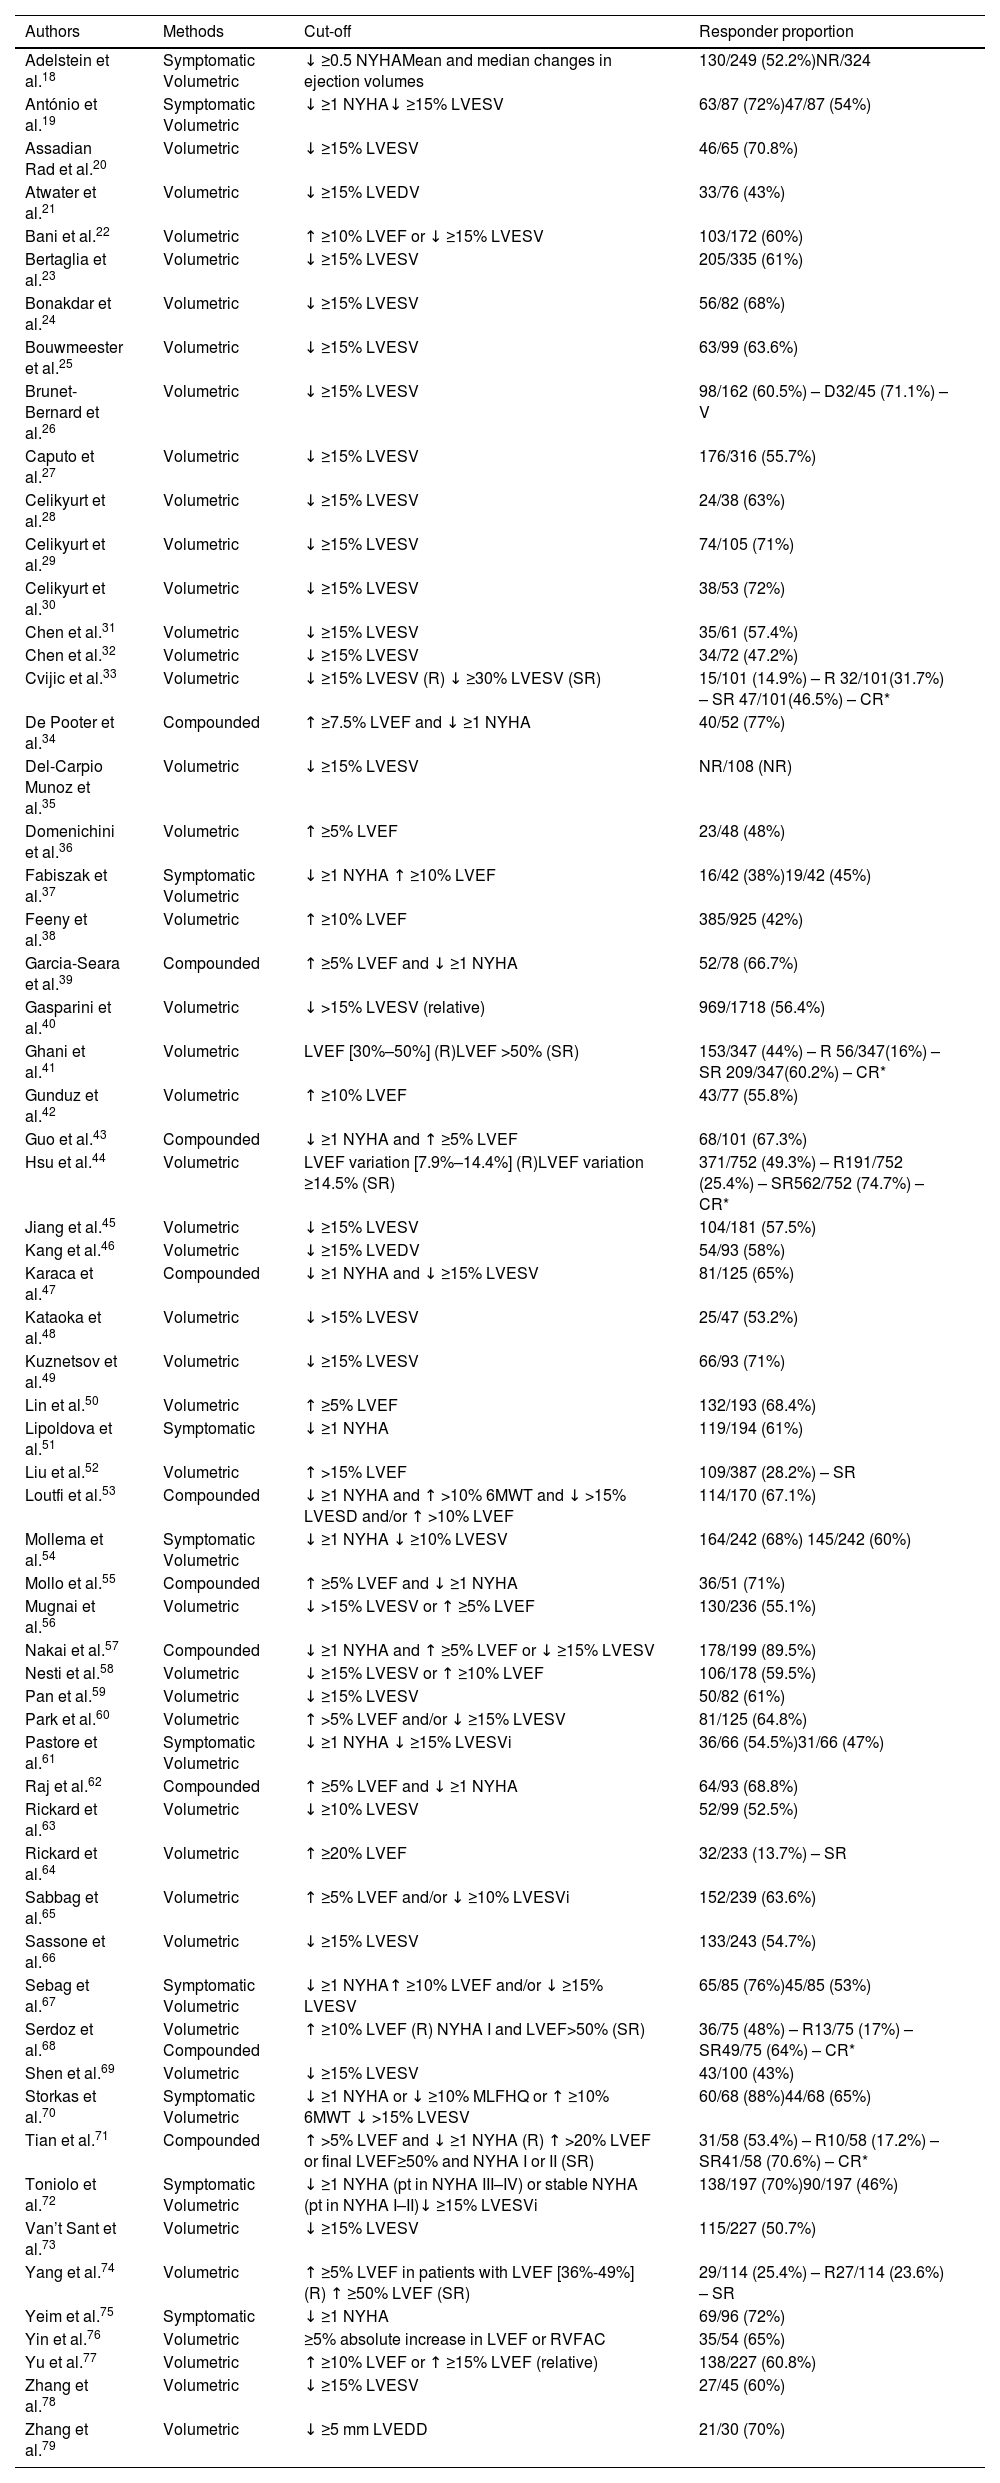
Response outcomesThe CRT response was assessed by using a single criterium – either symptomatic (2; 3%), volumetric (42; 68%) or compounded (9; 15%) – or by assessing differential response separately using symptomatic, volumetric, and/or compounded criteria independently (9; 15%). In addition, eight studies assessed super response, either comparing it with response or using it as a single criterium of response.33,41,44,52,64,68,71,74 Response thresholds varied, with the most frequent cut-off criteria for symptomatic and volumetric responses being a decrease of at least one point in the NYHA class and a decrease of at least 15% of the LV end-systolic volume, respectively. When using compounded thresholds, the most frequent cut-off was a decrease of at least one point in NYHA class and an increase of 5% in LVEF. Response assessment timing was mostly performed at 6 (37; 60%) and 12 months (11; 18%), with only three studies assessing a follow-up longer than 12 months. The median response proportion in studies using symptomatic criteria was 69%, ranging from 38% to 88%. For volumetric criteria, the median response rate was 58% varying from 42% to 75%. In studies using compounded criteria, the median responder proportion was 69%, with a minimum of 65% and a maximum of 90%. Super-response rates varied from 14% to 32%, with a median response rate of around 17%.
Table 3 summarizes the method, cut-offs and responder proportions of each study. A detailed description of the outcomes of all included studies is available in Supplemental Table ST1.
Outcome assessment of all included studies.
| Authors | Methods | Cut-off | Responder proportion |
|---|---|---|---|
| Adelstein et al.18 | Symptomatic Volumetric | ↓ ≥0.5 NYHAMean and median changes in ejection volumes | 130/249 (52.2%)NR/324 |
| António et al.19 | Symptomatic Volumetric | ↓ ≥1 NYHA↓ ≥15% LVESV | 63/87 (72%)47/87 (54%) |
| Assadian Rad et al.20 | Volumetric | ↓ ≥15% LVESV | 46/65 (70.8%) |
| Atwater et al.21 | Volumetric | ↓ ≥15% LVEDV | 33/76 (43%) |
| Bani et al.22 | Volumetric | ↑ ≥10% LVEF or ↓ ≥15% LVESV | 103/172 (60%) |
| Bertaglia et al.23 | Volumetric | ↓ ≥15% LVESV | 205/335 (61%) |
| Bonakdar et al.24 | Volumetric | ↓ ≥15% LVESV | 56/82 (68%) |
| Bouwmeester et al.25 | Volumetric | ↓ ≥15% LVESV | 63/99 (63.6%) |
| Brunet-Bernard et al.26 | Volumetric | ↓ ≥15% LVESV | 98/162 (60.5%) – D32/45 (71.1%) – V |
| Caputo et al.27 | Volumetric | ↓ ≥15% LVESV | 176/316 (55.7%) |
| Celikyurt et al.28 | Volumetric | ↓ ≥15% LVESV | 24/38 (63%) |
| Celikyurt et al.29 | Volumetric | ↓ ≥15% LVESV | 74/105 (71%) |
| Celikyurt et al.30 | Volumetric | ↓ ≥15% LVESV | 38/53 (72%) |
| Chen et al.31 | Volumetric | ↓ ≥15% LVESV | 35/61 (57.4%) |
| Chen et al.32 | Volumetric | ↓ ≥15% LVESV | 34/72 (47.2%) |
| Cvijic et al.33 | Volumetric | ↓ ≥15% LVESV (R) ↓ ≥30% LVESV (SR) | 15/101 (14.9%) – R 32/101(31.7%) – SR 47/101(46.5%) – CR* |
| De Pooter et al.34 | Compounded | ↑ ≥7.5% LVEF and ↓ ≥1 NYHA | 40/52 (77%) |
| Del-Carpio Munoz et al.35 | Volumetric | ↓ ≥15% LVESV | NR/108 (NR) |
| Domenichini et al.36 | Volumetric | ↑ ≥5% LVEF | 23/48 (48%) |
| Fabiszak et al.37 | Symptomatic Volumetric | ↓ ≥1 NYHA ↑ ≥10% LVEF | 16/42 (38%)19/42 (45%) |
| Feeny et al.38 | Volumetric | ↑ ≥10% LVEF | 385/925 (42%) |
| Garcia-Seara et al.39 | Compounded | ↑ ≥5% LVEF and ↓ ≥1 NYHA | 52/78 (66.7%) |
| Gasparini et al.40 | Volumetric | ↓ >15% LVESV (relative) | 969/1718 (56.4%) |
| Ghani et al.41 | Volumetric | LVEF [30%–50%] (R)LVEF >50% (SR) | 153/347 (44%) – R 56/347(16%) – SR 209/347(60.2%) – CR* |
| Gunduz et al.42 | Volumetric | ↑ ≥10% LVEF | 43/77 (55.8%) |
| Guo et al.43 | Compounded | ↓ ≥1 NYHA and ↑ ≥5% LVEF | 68/101 (67.3%) |
| Hsu et al.44 | Volumetric | LVEF variation [7.9%–14.4%] (R)LVEF variation ≥14.5% (SR) | 371/752 (49.3%) – R191/752 (25.4%) – SR562/752 (74.7%) – CR* |
| Jiang et al.45 | Volumetric | ↓ ≥15% LVESV | 104/181 (57.5%) |
| Kang et al.46 | Volumetric | ↓ ≥15% LVEDV | 54/93 (58%) |
| Karaca et al.47 | Compounded | ↓ ≥1 NYHA and ↓ ≥15% LVESV | 81/125 (65%) |
| Kataoka et al.48 | Volumetric | ↓ >15% LVESV | 25/47 (53.2%) |
| Kuznetsov et al.49 | Volumetric | ↓ ≥15% LVESV | 66/93 (71%) |
| Lin et al.50 | Volumetric | ↑ ≥5% LVEF | 132/193 (68.4%) |
| Lipoldova et al.51 | Symptomatic | ↓ ≥1 NYHA | 119/194 (61%) |
| Liu et al.52 | Volumetric | ↑ >15% LVEF | 109/387 (28.2%) – SR |
| Loutfi et al.53 | Compounded | ↓ ≥1 NYHA and ↑ >10% 6MWT and ↓ >15% LVESD and/or ↑ >10% LVEF | 114/170 (67.1%) |
| Mollema et al.54 | Symptomatic Volumetric | ↓ ≥1 NYHA ↓ ≥10% LVESV | 164/242 (68%) 145/242 (60%) |
| Mollo et al.55 | Compounded | ↑ ≥5% LVEF and ↓ ≥1 NYHA | 36/51 (71%) |
| Mugnai et al.56 | Volumetric | ↓ >15% LVESV or ↑ ≥5% LVEF | 130/236 (55.1%) |
| Nakai et al.57 | Compounded | ↓ ≥1 NYHA and ↑ ≥5% LVEF or ↓ ≥15% LVESV | 178/199 (89.5%) |
| Nesti et al.58 | Volumetric | ↓ ≥15% LVESV or ↑ ≥10% LVEF | 106/178 (59.5%) |
| Pan et al.59 | Volumetric | ↓ ≥15% LVESV | 50/82 (61%) |
| Park et al.60 | Volumetric | ↑ >5% LVEF and/or ↓ ≥15% LVESV | 81/125 (64.8%) |
| Pastore et al.61 | Symptomatic Volumetric | ↓ ≥1 NYHA ↓ ≥15% LVESVi | 36/66 (54.5%)31/66 (47%) |
| Raj et al.62 | Compounded | ↑ ≥5% LVEF and ↓ ≥1 NYHA | 64/93 (68.8%) |
| Rickard et al.63 | Volumetric | ↓ ≥10% LVESV | 52/99 (52.5%) |
| Rickard et al.64 | Volumetric | ↑ ≥20% LVEF | 32/233 (13.7%) – SR |
| Sabbag et al.65 | Volumetric | ↑ ≥5% LVEF and/or ↓ ≥10% LVESVi | 152/239 (63.6%) |
| Sassone et al.66 | Volumetric | ↓ ≥15% LVESV | 133/243 (54.7%) |
| Sebag et al.67 | Symptomatic Volumetric | ↓ ≥1 NYHA↑ ≥10% LVEF and/or ↓ ≥15% LVESV | 65/85 (76%)45/85 (53%) |
| Serdoz et al.68 | Volumetric Compounded | ↑ ≥10% LVEF (R) NYHA I and LVEF>50% (SR) | 36/75 (48%) – R13/75 (17%) – SR49/75 (64%) – CR* |
| Shen et al.69 | Volumetric | ↓ ≥15% LVESV | 43/100 (43%) |
| Storkas et al.70 | Symptomatic Volumetric | ↓ ≥1 NYHA or ↓ ≥10% MLFHQ or ↑ ≥10% 6MWT ↓ >15% LVESV | 60/68 (88%)44/68 (65%) |
| Tian et al.71 | Compounded | ↑ >5% LVEF and ↓ ≥1 NYHA (R) ↑ >20% LVEF or final LVEF≥50% and NYHA I or II (SR) | 31/58 (53.4%) – R10/58 (17.2%) – SR41/58 (70.6%) – CR* |
| Toniolo et al.72 | Symptomatic Volumetric | ↓ ≥1 NYHA (pt in NYHA III–IV) or stable NYHA (pt in NYHA I–II)↓ ≥15% LVESVi | 138/197 (70%)90/197 (46%) |
| Van’t Sant et al.73 | Volumetric | ↓ ≥15% LVESV | 115/227 (50.7%) |
| Yang et al.74 | Volumetric | ↑ ≥5% LVEF in patients with LVEF [36%-49%] (R) ↑ ≥50% LVEF (SR) | 29/114 (25.4%) – R27/114 (23.6%) – SR |
| Yeim et al.75 | Symptomatic | ↓ ≥1 NYHA | 69/96 (72%) |
| Yin et al.76 | Volumetric | ≥5% absolute increase in LVEF or RVFAC | 35/54 (65%) |
| Yu et al.77 | Volumetric | ↑ ≥10% LVEF or ↑ ≥15% LVEF (relative) | 138/227 (60.8%) |
| Zhang et al.78 | Volumetric | ↓ ≥15% LVESV | 27/45 (60%) |
| Zhang et al.79 | Volumetric | ↓ ≥5 mm LVEDD | 21/30 (70%) |
CR: combined response; D: derivation; LVEDD: left ventricular end-diastolic diameter; LVEDV: left ventricular end-diastolic volume; LVEF: left ventricular ejection fraction; LVESD: left ventricular end-systolic diameter; LVESVi: left ventricular end-systolic volume index; LVESV: left ventricular end-systolic volume; MLFHQ: Minnesota Living with Heart Failure Questionnaire; NR: not reported; NYHA: New York Heart Association class; pt: patients; R: response; RVFAC: right ventricular fractional area change; SR: super response; V: validation. 6MWT: six-minute walk test.
All studies were classified as having a high RoB (62; 100%). Regarding each domain, RoB was especially high in domains two (attrition) and five (confounding), respectively with 51 (82%) and 49 (79%) studies. Bias due to outcome measurement was low in 60 studies (97%), while 42 (68%) showed low bias in statistical analysis and reporting. Detailed results of the RoB assessment are depicted in Supplemental Figures SF1 and SF2. The agreement between reviewers within each independent domain was 67%, 80%, 53%, 93%, 33%, and 60%, respectively for domains one through six. The mean reviewer agreement across domains was 62%. The overall RoB agreement was 100%.
DiscussionOur review aimed to assess the value of pre-implantation standard ECG parameters in predicting response to CRT using primary studies, and, from our point of view, has the merit of systematizing literature on this specific topic for the first time.
This review highlights two major key points: (1) the difficulty in evaluating response to CRT, arising from the heterogeneity in patient selection and the variety of response criteria; and (2) the need to move beyond traditional ECG predictors.
Electrocardiographic predictorsOur review shows that classical predictors, such as baseline QRSd and LBBB morphology are good markers in predicting response to CRT. We found that the benefit of CRT appears to be restricted to patients with QRS >150 ms (but not longer than 178 ms), and that this benefit disappears for QRSd ≤120 ms, which is supported by guidelines changes that recognize the limited use of CRT in these patients.83 Equally, our findings suggest that LBBB is not only a good predictor of response but can also predict super response to CRT. Also, we have found that the ESC 2013 and Strauss criteria have the highest sensitivity while the AHA definition has the highest specificity in predicting response to CRT, suggesting that the highly stringent AHA definition might limit access to therapy.85 These different definitions, however, reflect not only how difficult it is to define LBBB but, more importantly, how it can impact patient selection as potential responders may be denied CRT, while others who may not benefit can receive this therapy; this was shown in the study by Van Stipdonk et al.86 who found that only 14% of patients could be classified as LBBB using the AHA and ESC definitions.
More importantly, our review shows that the role of standard ECG can go beyond the classical predictors described above and can provide additional predictive value. QRS notching and fragmentation results from the heterogeneous ventricular activation and dyssynchronous contraction,87 and was initially described as a predictor of cardiac events and HF hospitalizations in patients with cardiac disease.88 Our results show that notched/fragmented morphologies and fragmentation duration can be good predictors of non-response, in line with the findings of Balci et al.89 that found that a notched QRS duration >67.5 ms was an independent predictor of non-response to CRT; however, the study by Rickard et al.63 did not corroborate these findings. In contrast, our findings also suggest that the presence of nQRS in lateral leads or mid-QRS notching (in at least one lead) could predict response to CRT due to initial high septum activation resulting in conduction through the whole ventricular tissue and leading to more mechanical dyssynchrony, coinciding with a functional line of block toward the apex of the LV, and therefore the target of CRT.90,91
It is speculated that the presence of S-waves in right precordial leads might indicate conduction disturbance in the LV and that it is associated with smaller left atrium diameters, probably representing less left atrial remodeling and therefore within scope for CRT.92,93 Likewise, while the mechanism behind the presence of an S wave in V6 in patients with complete LBBB is not yet fully understood, Leonelli et al.94 speculate that an S wave in V6 may represent a more posterosuperior late LV vector due to biventricular enlargement while based on Upadhyay et al.95 it could be related to widespread diffuse LBBB lesion indicating intramyocardial disease, leading to poor outcome. Even though our results found a significant association of this parameter in predicting (non)response, Poposka et al.11 found no such significance in multivariate models.
Finally, literature suggests that LAD in the presence of LBBB is an independent predictor of poor prognosis96 and that patients without LAD seem to benefit more from CRT,97 with our review showing a marginal value of LAD in the prediction of response to CRT, despite one study showing higher odds of response.39 Similarly, we found that the PR interval had a limited role in response prediction, although it was suggested that patients with PR intervals between 150 and 170 ms were more likely to respond. Current literature seems to corroborate these findings, with patients with prolonged PR intervals showing worse outcomes when compared to those with a ‘normal’ PR interval,98,99 although Kutyifa et al.100 reported that a PR interval ≥230 ms was able to identify responders with non-LBBB patterns. Figure 2 summarizes the key electrocardiographic parameters, which are useful in assessing response to CRT.
Response outcomes
Our results are in line with those reported in the literature, showing similar response rates101 and a significant disagreement around the definition of response.102
Our study shows higher response rates in studies using symptomatic criteria when compared to those using volumetric criteria, although the agreement between these parameters is good.103 Volumetric criteria are considered not to be reliable predictors of outcome and symptomatic criteria are patient-dependent, therefore making it difficult to obtain a consistent measure.99 However, our study showed compounding symptomatic and volumetric criteria yields the highest response proportions, suggesting that this could be a more sensible approach when trying to assess response.
BiasIn this systematic review, we found a significant heterogeneity in inclusion criteria, with most studies including patients with mild to severe HF (NYHA II–IV) mostly with LVEF ≤35% and varying QRSd cut-offs. A potential explanation for this heterogeneity might be that most studies have an inclusion period that spans over several years (and, sometimes, using populations with devices implanted almost 10 years before the study was published), are based on retrospective cohorts, and use a convenience sampling often from single centers, possibly to make the study sample as large as possible.
Heterogeneity is reflected in the ill-defined inclusion criteria found in some studies.22,23,25,27,32,34,35,38,45,51,57,60,65,67,69,73,74,76 This, combined with the relatively small samples, could explain the overall high RoB of the studies included in our review. On that note, it is important to say that only a small number of studies had a low RoB regarding study participation and attrition, with some studies failing to describe the target population in detail, not giving information regarding exclusion criteria or not describing how missing data was handled, thus contributing to the high risk of selection and attrition bias. Interestingly, the moderate or high RoB shown in all the studies analyzed stresses the potential RoB for the relationship between predictors and outcome, ultimately impacting the generalization of results.
Clinical implicationsClinically, the possibility of using simple ECG criteria that can accurately predict response is of immense value in selecting patients who are more likely to benefit from CRT. The ubiquitous, inexpensive, and non-invasive nature of the test enhances its practicality and utility, and by basing shared decision-making on robust evidence healthcare providers can more effectively optimize patient outcomes. For patients and healthcare systems, expediting the selection process while reducing the potential for iatrogeny and costs offers substantial benefits. The ability to quickly and accurately determine which patients will benefit most from CRT helps avoid unnecessary procedures and associated complications, leading to a more efficient resource allocation. Nevertheless, ECG criteria have to be reproducible and easy to use in order to be useful in clinical practice. As such, it is expected that computer-aided automation and artificial intelligence will play a vital role in CRT response prediction,104 especially if based in simple, easily accessible tests.
LimitationsOur findings should be interpreted in the light of some limitations. Firstly, the lack of a unique definition of response and different response assessment cut-offs made impossible a quantitative synthesis of the results. Likewise, parameters such as LV lead position and medical therapy, which are known to affect response, were not evaluated in the current study. Secondly, the class of indication and level of evidence was not described in any of the studies and, as such, indication for CRT was assumed but it was not possible to ascertain if the guidelines followed impacted response. A third caveat resides in the fact that we wanted to assess only the predictive capability of the pre-implantation ECG as a tool for patient selection in a way that replicates a real clinical context; as a result, ECG criteria that involve post-implantation assessment were not considered. Additionally, none of the studies included alternative LV pacing sites, and therefore caution is warranted when replicating these findings in future studies. Finally, despite QUIPS being from our perspective the more appropriate tool for RoB assessment in studies of prognostic factors, some domains of this tool may be problematic to interpret, depending on the complexity of the research area, and can potentially contribute to agreement issues.105–107
ConclusionOur review aimed at assessing the value of pre-implantation standard ECG parameters in predicting response to CRT using primary studies, and, from our point of view, has the merit of systematizing literature in this specific topic for the first time.
This review highlights two major key points: (1) the difficulty in evaluating response to CRT, arising from the heterogeneity in patient selection and the variety of response criteria; and (2) the need to move beyond traditional ECG predictors.
Clinically, the possibility of using simple ECG criteria that can accurately predict response is of immense value in selecting patients who are more likely to benefit from CRT. The ubiquitous, inexpensive, and non-invasive nature of the test enhances its practicality and utility, and by basing shared decision-making on robust evidence healthcare providers can more effectively optimize patient outcomes. For patients and healthcare systems, expediting the selection process while reducing the potential for iatrogeny and costs offers substantial benefits. The ability to quickly and accurately determine which patients will benefit most from CRT helps avoid unnecessary procedures and associated complications, leading to a more efficient resource allocation.
Although traditional predictors, such a QRS duration and morphology are relevant in predicting response to CRT, contemporary predictors such as QRS notching or fragmentation show great potential in identifying responders but more research is warranted, particularly in large prospective studies, to confirm their prognostic value.
CRediT authorship contribution statementPDC and MMS were responsible for the conception and design of the study. PDC, DFS, MCP, FMS and JPB were responsible for the data collection and processing. PDC, MMS and PPR were responsible for the data analysis and interpretation of results. PDC and DFS were responsible for the literature review. PDC was responsible for the draft manuscript preparation. All authors were responsible for the critical review and editing of the manuscript.
Ethics approval and consent to participateNot applicable.
Consent for publicationAll authors reviewed the results, approved the final version of the manuscript, and consented for publication.
Declaration of competing interestsPDC has previously received consultancy fees from Medtronic and Ela Medical. FMS has previously received consultancy fees from Medtronic, Microport and Abbot. AHR and MMO have previously received consultancy and speaking fees from Medtronic, Boston Scientific, Microport and Abbot. The remaining authors declare that they have no known conflicts of interest.
FundingPDC was supported by the Fundação para a Ciência e a Tecnologia, I.P, through grant number UI/BD/151574/2021 (DOI: 10.54499/UI/BD/151574/2021). The content of the project is solely the responsibility of the authors and does not necessarily represent the official views of the funders. The funders and industry did not have any role in the data analysis or the article contents.
Data availabilityAll research data supporting the results of your manuscript is available as supplementary material and appended to this submission.
The authors wish to thank Joana Morgado (joana.morgado.matos@gmail.com) for her valuable assistance in designing the illustrations for this paper.


https://pubmed.ncbi.nlm.nih.gov.

- Início
- Todos os conteúdos
- Publique seu artigo
- Sobre a revista
- Métricas
- Open access
- Baixar PDF
- Bibliografia
- Material adicional