

Portugal is a country with a high prevalence of type 2 diabetes (T2D) and cardiovascular disease (CVD). The prevalence of CVD and cardiovascular (CV) risk factors among T2D patients followed in hospitals in Portugal is not known. The primary objective of this study was to assess the prevalence of CVD and CV risk factors among T2D patients in a hospital setting in Portugal. The clinical management of CVD in the hospital setting was also assessed.
MethodsWe performed a non-interventional, multicenter, cross-sectional study with a retrospective phase. T2D patients were consecutively invited to participate. Data were collected retrospectively.
ResultsA total of 715 patients were included in the study. Mean age and diabetes duration were 66.6 and 17.4 years, respectively. Of these, 286 patients (40.0%) had been diagnosed with CVD, mostly ischemic heart disease (50.4%). All patients had at least one CV risk factor. CVD was significantly associated with hypertension, hypercholesterolemia, low high-density lipoprotein cholesterol, hypertriglyceridemia and smoking. During the three years prior to study inclusion, the incidence of hyperglycemic episodes and T2D complications increased among patients with established CVD, but the numbers of hospitalization episodes and specialist appointments remained stable. An improvement was observed in key cardiometabolic risk factors.
ConclusionsOur study revealed a high prevalence of CVD and CV risk factors among a sample of T2D patients in a hospital setting. Patients with established CVD seem to be adequately managed but further efforts are needed at the prevention stage for better control of risk factors and morbidity.
Portugal é um país com elevada prevalência de diabetes tipo 2 (DT2) e doenças cardiovasculares (DCV). A prevalência das DCV e dos fatores de risco cardiovascular (CV) em doentes com DT2 seguidos nos hospitais em Portugal não é conhecida. O principal objetivo deste estudo foi avaliar a prevalência das DCV e dos fatores de risco CV em doentes com DT2 seguidos em ambiente hospitalar em Portugal. A gestão clínica das DCV no ambiente hospitalar também foi avaliada
MétodosPICT2RE foi um estudo não intervencional, multicêntrico e transversal com uma fase retrospetiva. Os doentes com DT2 foram consecutivamente convidados a participar. Os dados foram recolhidos retrospetivamente.
ResultadosForam incluídos no estudo 715 doentes: a idade média e a duração do diabetes foram de 66,6 e 17,4 anos, respetivamente. Tinham diagnóstico de DCV, principalmente cardiopatia isquémica (50,4%), 286 doentes (40,0%). Todos os doentes tinham pelo menos um fator de risco CV. A DCV estava significativamente associada com hipertensão, hipercolesterolemia, baixos níveis de colesterol de lipoproteína de alta densidade, hipertrigliceridemia e hábitos tabágicos. Durante os três anos anteriores à inclusão no estudo, a incidência de episódios hiperglicémicos e complicações associadas à DT2 aumentou nos doentes com DCV estabelecida, mas o número de episódios de hospitalização e consultas especializadas permaneceu estável. Observou-se uma melhoria nos principais fatores de risco cardiometabólico.
ConclusõesO estudo PICT2RE revelou uma alta prevalência de DCV e fatores de risco CV numa amostra de doentes com DT2 seguidos em ambiente hospitalar. Os doentes com DCV estabelecida parecem ser tratados de forma adequada, mas são necessários esforços adicionais ao nível da prevenção para um melhor controle dos fatores de risco e morbilidade.
Diabetes is a growing worldwide pandemic: 415 million people were living with this disease in 2015, of whom 193 million were estimated to be undiagnosed.1 Type 2 diabetes (T2D) accounts for approximately 90% of all diabetes cases and is known to impose a heavy burden on healthcare services. As a multifactorial disease, T2D arises in a favorable genetic and epigenetic background in the presence of the appropriate environmental drivers, many of which are characteristic of the lifestyle of modern societies: physical inactivity, excessive sugar and fat consumption, obesity and aging.1,2
Importantly, the main cause of morbidity and mortality among people with T2D is cardiovascular disease (CVD).1,3 The relative risk for macrovascular disorders in people with diabetes is two to four times higher than that of the general population, while the relative risk for microvascular disorders is 10–20 times higher.2,4,5 Common T2D complications such as peripheral artery disease and heart failure are often underdiagnosed and undertreated,6,7 although vascular damage begins even before diagnosis in the early stages of dysglycemia.8 Moreover, mortality and the outcomes of vascular events are worse in the diabetic population than in people without diabetes.2,9,10 The reason for these trends lies mainly in the endothelial dysfunction caused by hyperglycemia, which in turn induces atherosclerosis and leads to widespread vascular lesions.4,10 Of note, a substantial proportion of the medical expenditure associated with T2D is attributable to vascular complications.4,9 The total cost of treating a T2D patient with CV complications in the USA has been estimated to be 58% higher than that of treating a T2D patient without CV complications.9 For the above reasons, detection and control of cardiometabolic risk factors among people with T2D is of utmost importance to prevent disease progression, establishment of CVD and premature death, as well as to relieve the burden on healthcare systems.
In Portugal, a study published in 2015 including 1528 T2D patients outlined the prevalence of CVD and CV risk factors among patients treated in a primary care setting: almost 15% of patients had CVD, the most prevalent of which were myocardial infarction (4.4%), angina pectoris (4.3%) and stroke (4.0%).11 Additionally, 80.3% of all patients had hypertension, while 61.6% had hypercholesterolemia.11 The present study aimed to extend and update existing knowledge by addressing the prevalence of CVD and CV risk factors among T2D patients being treated in a hospital setting. Additionally, a retrospective overview of the three years prior to inclusion was undertaken in order to assess the clinical management and resulting outcomes among patients with established CVD.
MethodsStudy design and endpointsThis was a non-interventional, multicenter, cross-sectional study with a retrospective phase. Data from all patients who agreed to participate and gave their written informed consent were retrospectively collected from medical records and recorded in an electronic database specifically designed for the study.
The primary endpoint was the prevalence of CVD and CV risk factors among all T2D patients enrolled in the study. CVD was defined as a history of one or more of the following: stroke, transient ischemic attack, ischemic heart disease (including myocardial infarction), congestive heart failure, atrial fibrillation, aortic aneurysm, and peripheral or carotid artery disease. CV risk factors were defined as a history of one or more of the following: body mass index (BMI) ≥25 kg/m2, family history of CVD (in first-degree relatives), hypertension, hypercholesterolemia, low high-density lipoprotein cholesterol (HDL-C) levels, hypertriglyceridemia, smoking and sedentary lifestyle (as per investigator discretion).
The secondary endpoint was assessment of the clinical management of T2D patients with established CVD. For this purpose, patients’ medical records for the three years prior to study enrollment were surveyed, and the occurrence of the following events was recorded at six-month (±3 months) intervals: hypoglycemic episodes; hyperglycemic episodes; presence and type of diabetes complications; hospital appointments (including cardiology, ophthalmology, nephrology and vascular surgery consultations); hospitalization episodes; changes in anthropometric parameters and vital signs (waist circumference, BMI and blood pressure [BP]); changes in biochemical test results (glycated hemoglobin [HbA1c] levels, estimated glomerular filtration rate [eGFR], albuminuria and levels of cholesterol/triglycerides [TG]); and type of pharmacological treatment (antidiabetic, antihypertensive, lipid-lowering and antiplatelet/anticoagulant therapy).
PatientsConsecutive adult patients with a diagnosis of T2D presenting for scheduled visits at the participating hospital centers were invited to enroll in this study. Exclusion criteria were a diagnosis of type 1 diabetes, previous participation in this study or in any clinical trial within the previous three years, and pregnancy or breast-feeding. Patients who agreed to participate and who signed an informed consent form constituted the full analysis set (FAS). For the secondary endpoint, all patients who had been diagnosed with CVD at least three years prior to study enrollment and who were being followed in the hospital setting by an endocrinologist or an internal medicine specialist were analyzed (CVD subgroup). Additionally, within the latter group, patients for whom the previous three years’ medical records were available constituted the follow-up subgroup.
Statistical analysisContinuous variables were described as mean, standard deviation (SD), maximum and minimum values, while categorical variables were described as absolute and relative (%) frequencies. Differences between patients with or without CVD were assessed using the Student's t test (for continuous variables), contingency tables and the chi-square test (for categorical variables). Pairwise comparisons (between the oldest and most recent data points) in the same patient were performed using the t test for paired samples. In all cases, p values <0.05 were considered to be statistically significant.
Ethics declarationThis study was conducted in accordance with the Good Pharmacoepidemiology Practices of the International Society for Pharmacoepidemiology (2015) and with the ethical principles stated in the Declaration of Helsinki.12,13
ResultsParticipantsA total of 731 participants, recruited from 14 centers between January and October 2019, were enrolled in the study, of whom 16 were excluded as they did not fulfill inclusion and/or exclusion criteria. The FAS population therefore included 715 individuals with T2D, whose main clinical and demographic characteristics are depicted in Table 1. Approximately half of the patients were male (50.4%) and their overall mean age (±SD) was 66.6 years (±10.1), ranging between 29 and 93 years. Mean BMI was 30.0 kg/m2 (±5.7), indicating that a considerable number of patients were overweight/obese, and mean waist circumference was 104.3 cm (±12.7). Mean systolic and diastolic BP were 137.7 mmHg (±18.7) and 74.1 mmHg (±11.3), respectively, while mean HbA1c was 7.7% (±1.3). On average, T2D duration was 17.4 years (±10.5) at the time of study inclusion. As for education level, nearly half (48.8%) of the patients had primary education only, and only a minority (8.8%) had attended university.
Characterization of the study population.
| FAS (n=715) | CVD group (n=286) | Follow-up group (n=191) | |
|---|---|---|---|
| Age, years, mean ± SD | 66.6±10.1 | 69.2±8.9 | 69.8±8.4 |
| Male gender, n (%) | 359 (50.4%) | 167 (58.4%) | 116 (60.7%) |
| FAS (n=705) | CVD group (n=279) | Follow-up group (n=184) | |
|---|---|---|---|
| Education level, n (%) | |||
| None | 25 (3.5) | 11 (3.9) | 4 (2.2) |
| Primary | 344 (48.8) | 151 (54.1) | 103 (56.0) |
| Lower secondary | 150 (21.3) | 49 (17.6) | 30 (16.3) |
| Upper secondary | 72 (10.2) | 29 (10.4) | 21 (11.4) |
| Higher | 62 (8.8) | 20 (7.2) | 15 (8.2) |
| No answer | 52 (7.4) | 19 (6.8) | 11 (6.0) |
| Height, cm, mean ± SD | 163.2±9.2 | 163.0±9.3 | 164.4±8.7 |
| Weight, kg, mean ± SD | 80.1±16.4 | 79.9±16.1 | 79.2±14.2 |
| BMI, kg/m2, mean ± SD | 30.0±5.7 | 29.4±4.8 | 29.3±5.0 |
| Waist circumference, cm, mean ± SD | 104.3±12.7 | 104.2±12.6 | 104.2±12.7 |
| SBP, mmHg, mean ± SD | 137.7±18.7 (n=688) | 135.4±18.5 (n=268) | 134.6±18.2 (n=178) |
| DBP, mmHg, mean ± SD | 74.1±11.3 (n=688) | 71.2±11.7 (n=268) | 70.6±12.3 (n=178) |
| HbA1c, %, mean ± SD | 7.7±1.3 (n=707) | 7.8±1.3 (n=281) | 7.7±1.3 (n=185) |
| Time since diabetes diagnosis, years, mean ± SD | 17.4±10.5 (n=706) | 19.5±10.5 (n=278) | |
| Total cholesterol, mg/dl, mean ± SD | 152.6±40.1 (n=132) | ||
| LDL-C, mg/dl, mean ± SD | 54.1±44.9 (n=208) | ||
| HDL-C, mg/dl, mean ± SD | 43.1±11.4 (n=148) | ||
| TG, mg/dl, mean ± SD | 176.1±143.8 (n=136) | ||
BMI: body mass index; CVD: cardiovascular disease; DBP: diastolic blood pressure; FAS: full analysis set; HbA1c: glycated hemoglobin; HDL-C: high-density lipoprotein cholesterol; LDL-C: low-density lipoprotein cholesterol; SBP: systolic blood pressure; SD: standard deviation; TG: triglycerides.
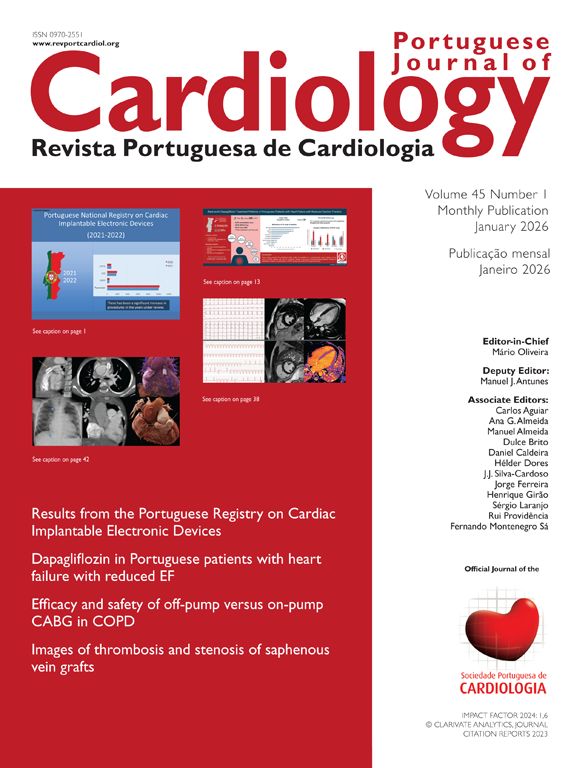
Overall, 286 patients (40.0% of the FAS population) had a previous diagnosis of CVD (CVD subgroup). Of these, 139 (50.4%) had ischemic heart disease (including myocardial infarction), 82 (29.5%) had peripheral or carotid artery disease, 63 (22.7%) congestive heart failure, 59 (21.5%) stroke, 38 (13.7%) atrial fibrillation, 21 (7.6%) transient ischemic attack, and none had aortic aneurysm (Figure 1). The main clinical and demographic characteristics of the CVD subgroup are depicted in Table 1 and comparisons between patients with CVD and without CVD are detailed in Table 2. Patients with CVD were significantly older (69.2 vs. 64.8 years, p<0.001), and had a lower BMI (29.4 vs. 30.4 kg/m2, p=0.019), systolic BP (135.4 vs. 139.2 mmHg, p=0.010) and diastolic BP (71.2 vs. 75.9 mmHg, p<0.001). Furthermore, the CVD subgroup had a higher proportion of male patients than the non-CVD subgroup (58.4% vs. 45.0%, p<0.001), as well as a significantly longer diabetes duration (19.5 vs. 16.0 years, p<0.001). No significant differences were found between these two subgroups regarding education level (p=0.187) or HbA1c (p=0.301).
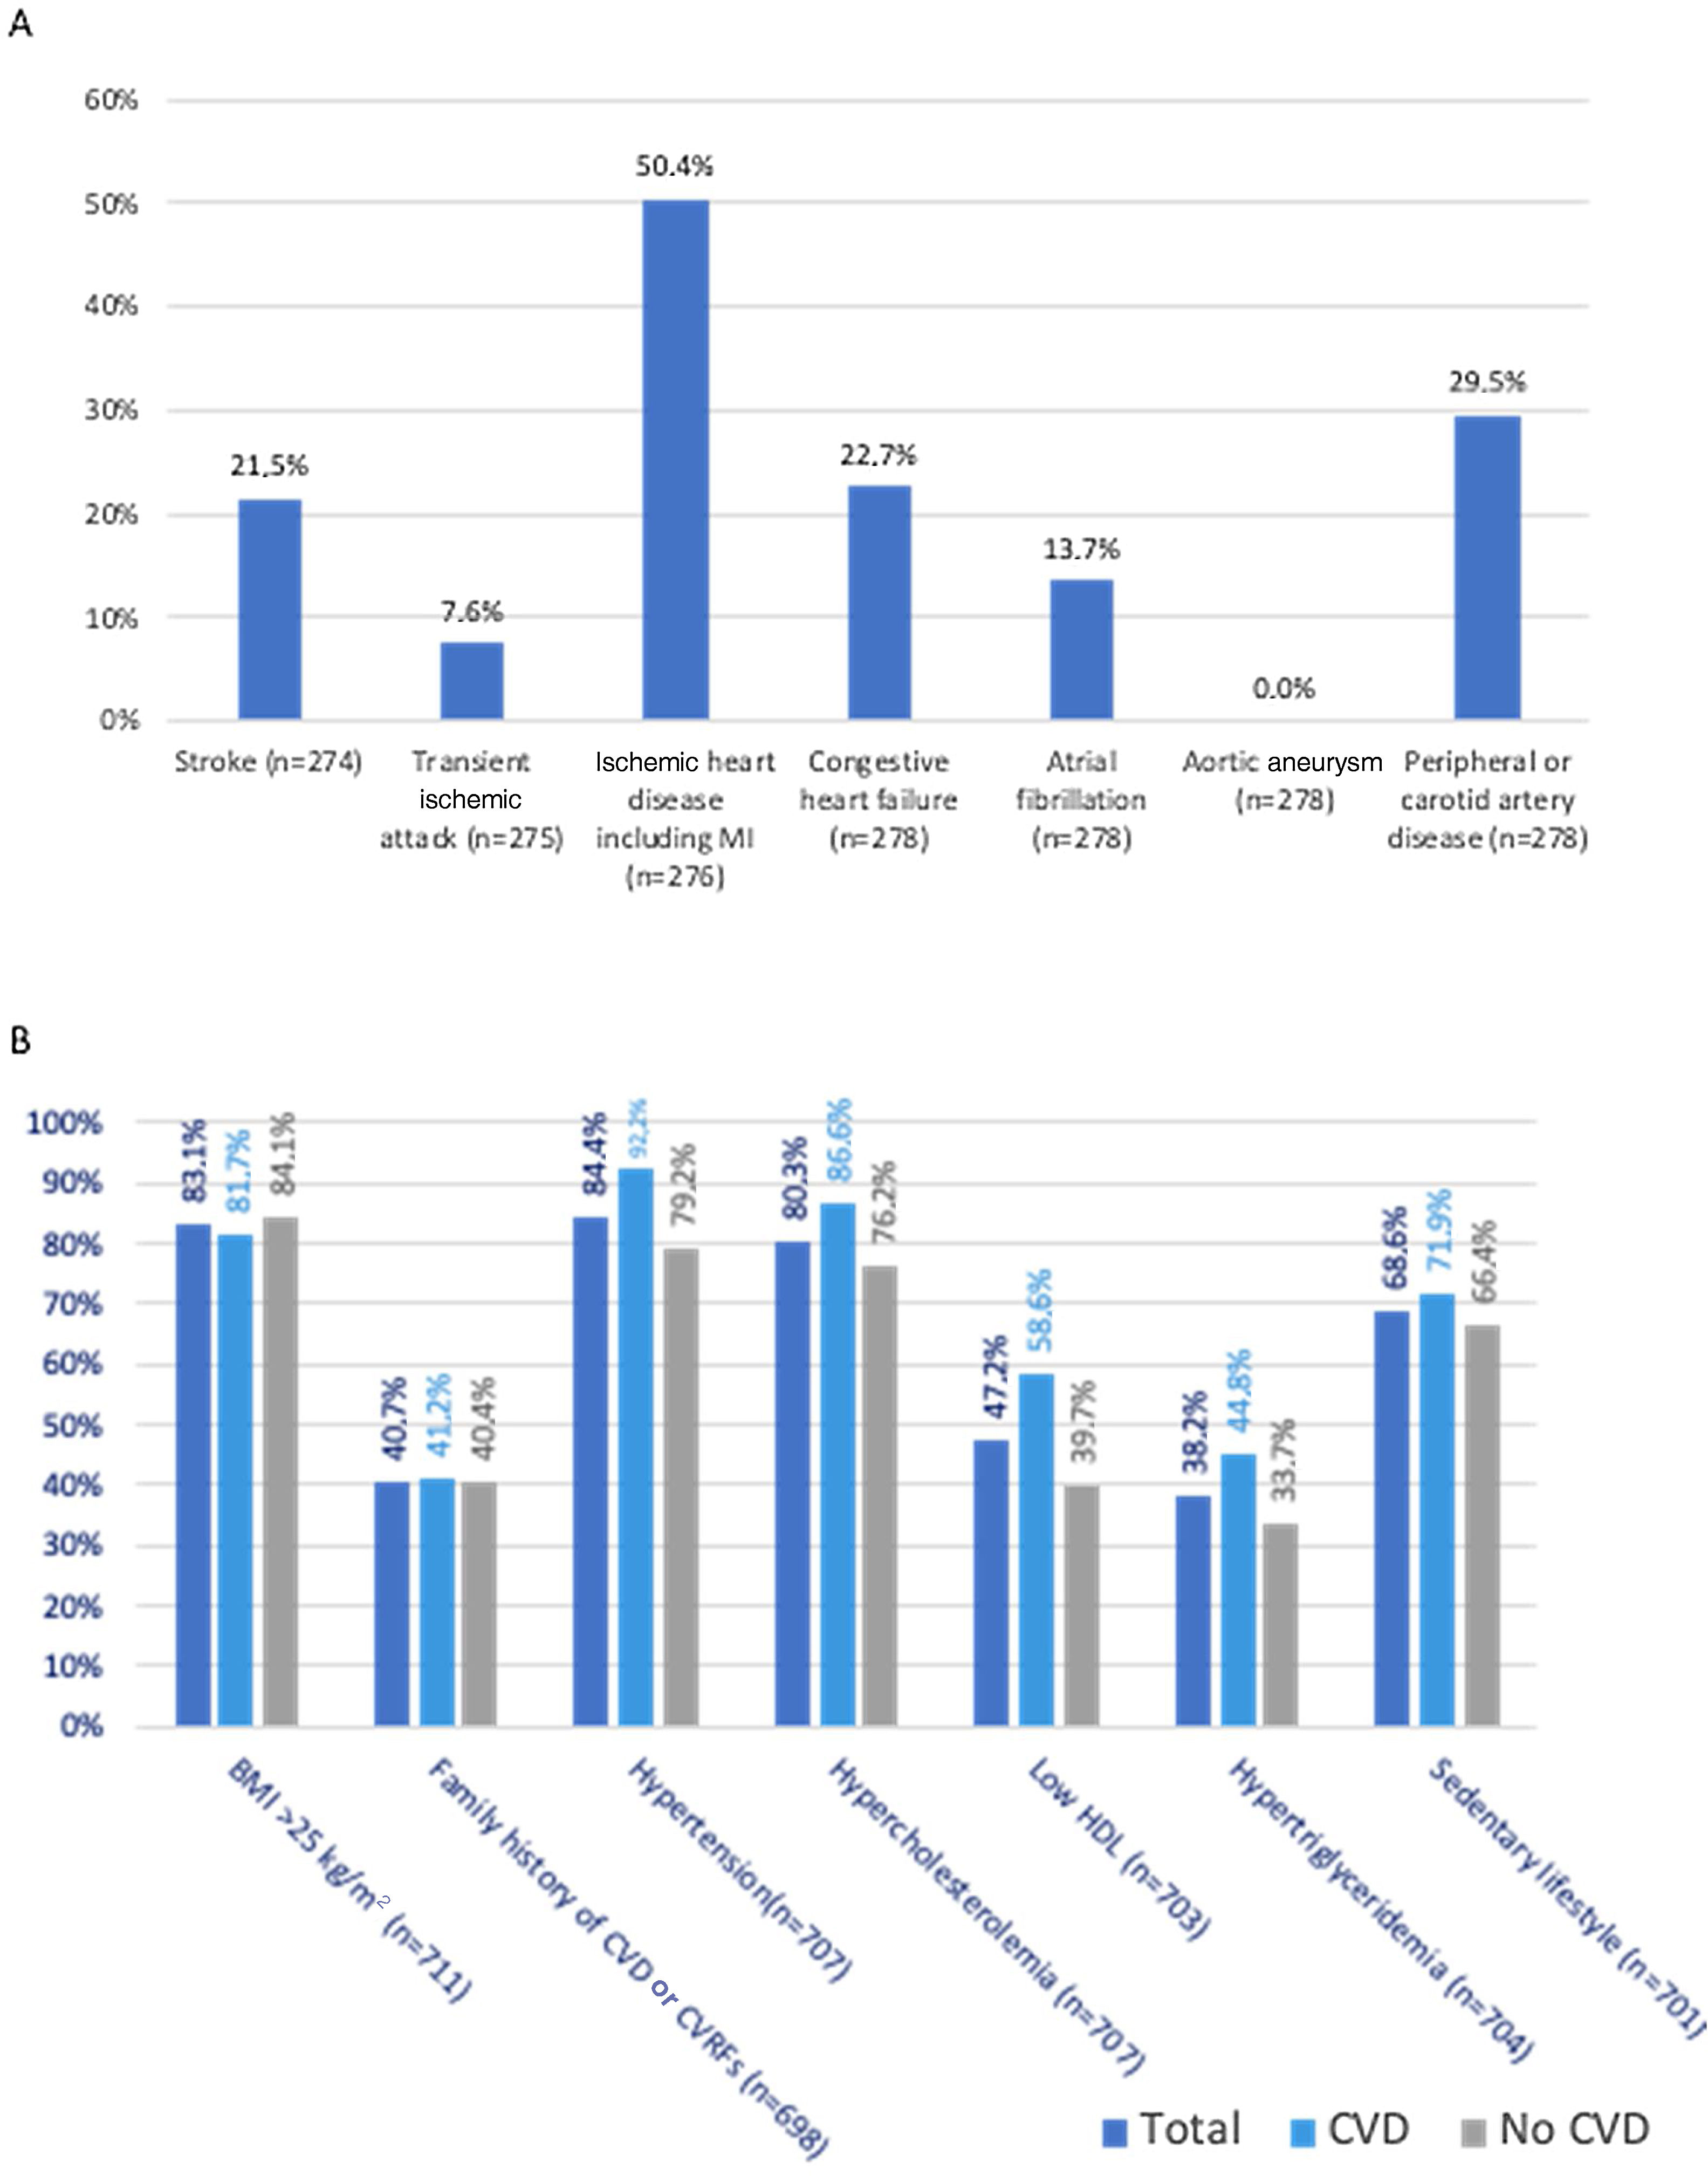
(A) Prevalence of different types of cardiovascular disease (CVD) among patients with type 2 diabetes and CVD (n based on total answers provided); (B) prevalence of cardiovascular risk factors among the total, CVD, and no CVD populations (n based on total answers provided). BMI: body mass index; CVD: cardiovascular disease; CVRFs: cardiovascular risk factors; LDL: low-density lipoprotein.
Comparison between patients with and without cardiovascular disease.
| With CVDa (n=286) | Without CVDa (n=427) | p | |
|---|---|---|---|
| Age, years, mean ± SD | 69.2±8.9 | 64.8±10.5 | <0.001 |
| Gender (male n, %) | 167 (58.4) | 192 (45.0) | <0.001 |
| With CVDa (n=279) | Without CVDa (n=426) | ||
|---|---|---|---|
| Education level (n, %) | 0.187 | ||
| None | 11 (3.9) | 14 (3.3) | |
| Primary | 151 (54.1) | 193 (45.3) | |
| Lower secondary | 49 (17.6) | 101 (23.7) | |
| Upper secondary | 29 (10.4) | 43 (10.1) | |
| Higher | 20 (7.2) | 42 (9.9) | |
| No data | 19 (6.8) | 33 (7.7) | |
| BMI, kg/m2, mean ± SD | 29.4±4.8 | 30.4±6.1 | 0.019 |
| SBP, mmHg, mean ± SD | 135.4±18.5 | 139.2±18.8 | 0.010 |
| DBP, mmHg, mean ± SD | 71.2±11.7 | 75.9±10.8 | <0.001 |
| HbA1c, %, mean ± SD | 7.8±1.3 | 7.7±1.3 | 0.301 |
| Time since diabetes diagnosis, years, mean ± SD | 19.5±10.5 | 16.0±10.3 | <0.001 |
BMI: body mass index; CVD: cardiovascular disease; DBP: diastolic blood pressure; FAS: full analysis set; HbA1c: glycated hemoglobin; SBP: systolic blood pressure.
All patients included in the FAS had at least one of the CV risk factors assessed in this study (Figure 1). The most common CV risk factor was hypertension, present in 597 (84.4%) patients, followed by overweight (BMI 25–29.9 kg/m2, n=279, 39.2%) or obesity (BMI >30 kg/m2, n=312, 43.9%), hypercholesterolemia (n=568, 80.3%), sedentary lifestyle (n=481, 68.6%), low HDL-C (n=332, 47.2%), family history of CVD (n=284, 40.7%), hypertriglyceridemia (n=269, 38.2%), and smoking (44 [6.3%] were active smokers, and 191 [27.6%] were former smokers). Patients with CVD differed from those without CVD regarding the prevalence of hypertension (92.2% vs. 79.2%, p<0.001), hypercholesterolemia (86.6% vs. 76.2%, p=0.001), low HDL-C (58.6% vs. 39.7%, p<0.001), hypertriglyceridemia (44.8% vs. 33.7%, p=0.003), and smoking (current smokers: 6.7% vs. 5.9%; former smokers: 35.9% vs. 22.1%, p<0.001). No significant differences were found between the two groups regarding overweight/obesity (p=0.406), family history of CVD (p=0.264), or sedentary lifestyle (p=0.124).
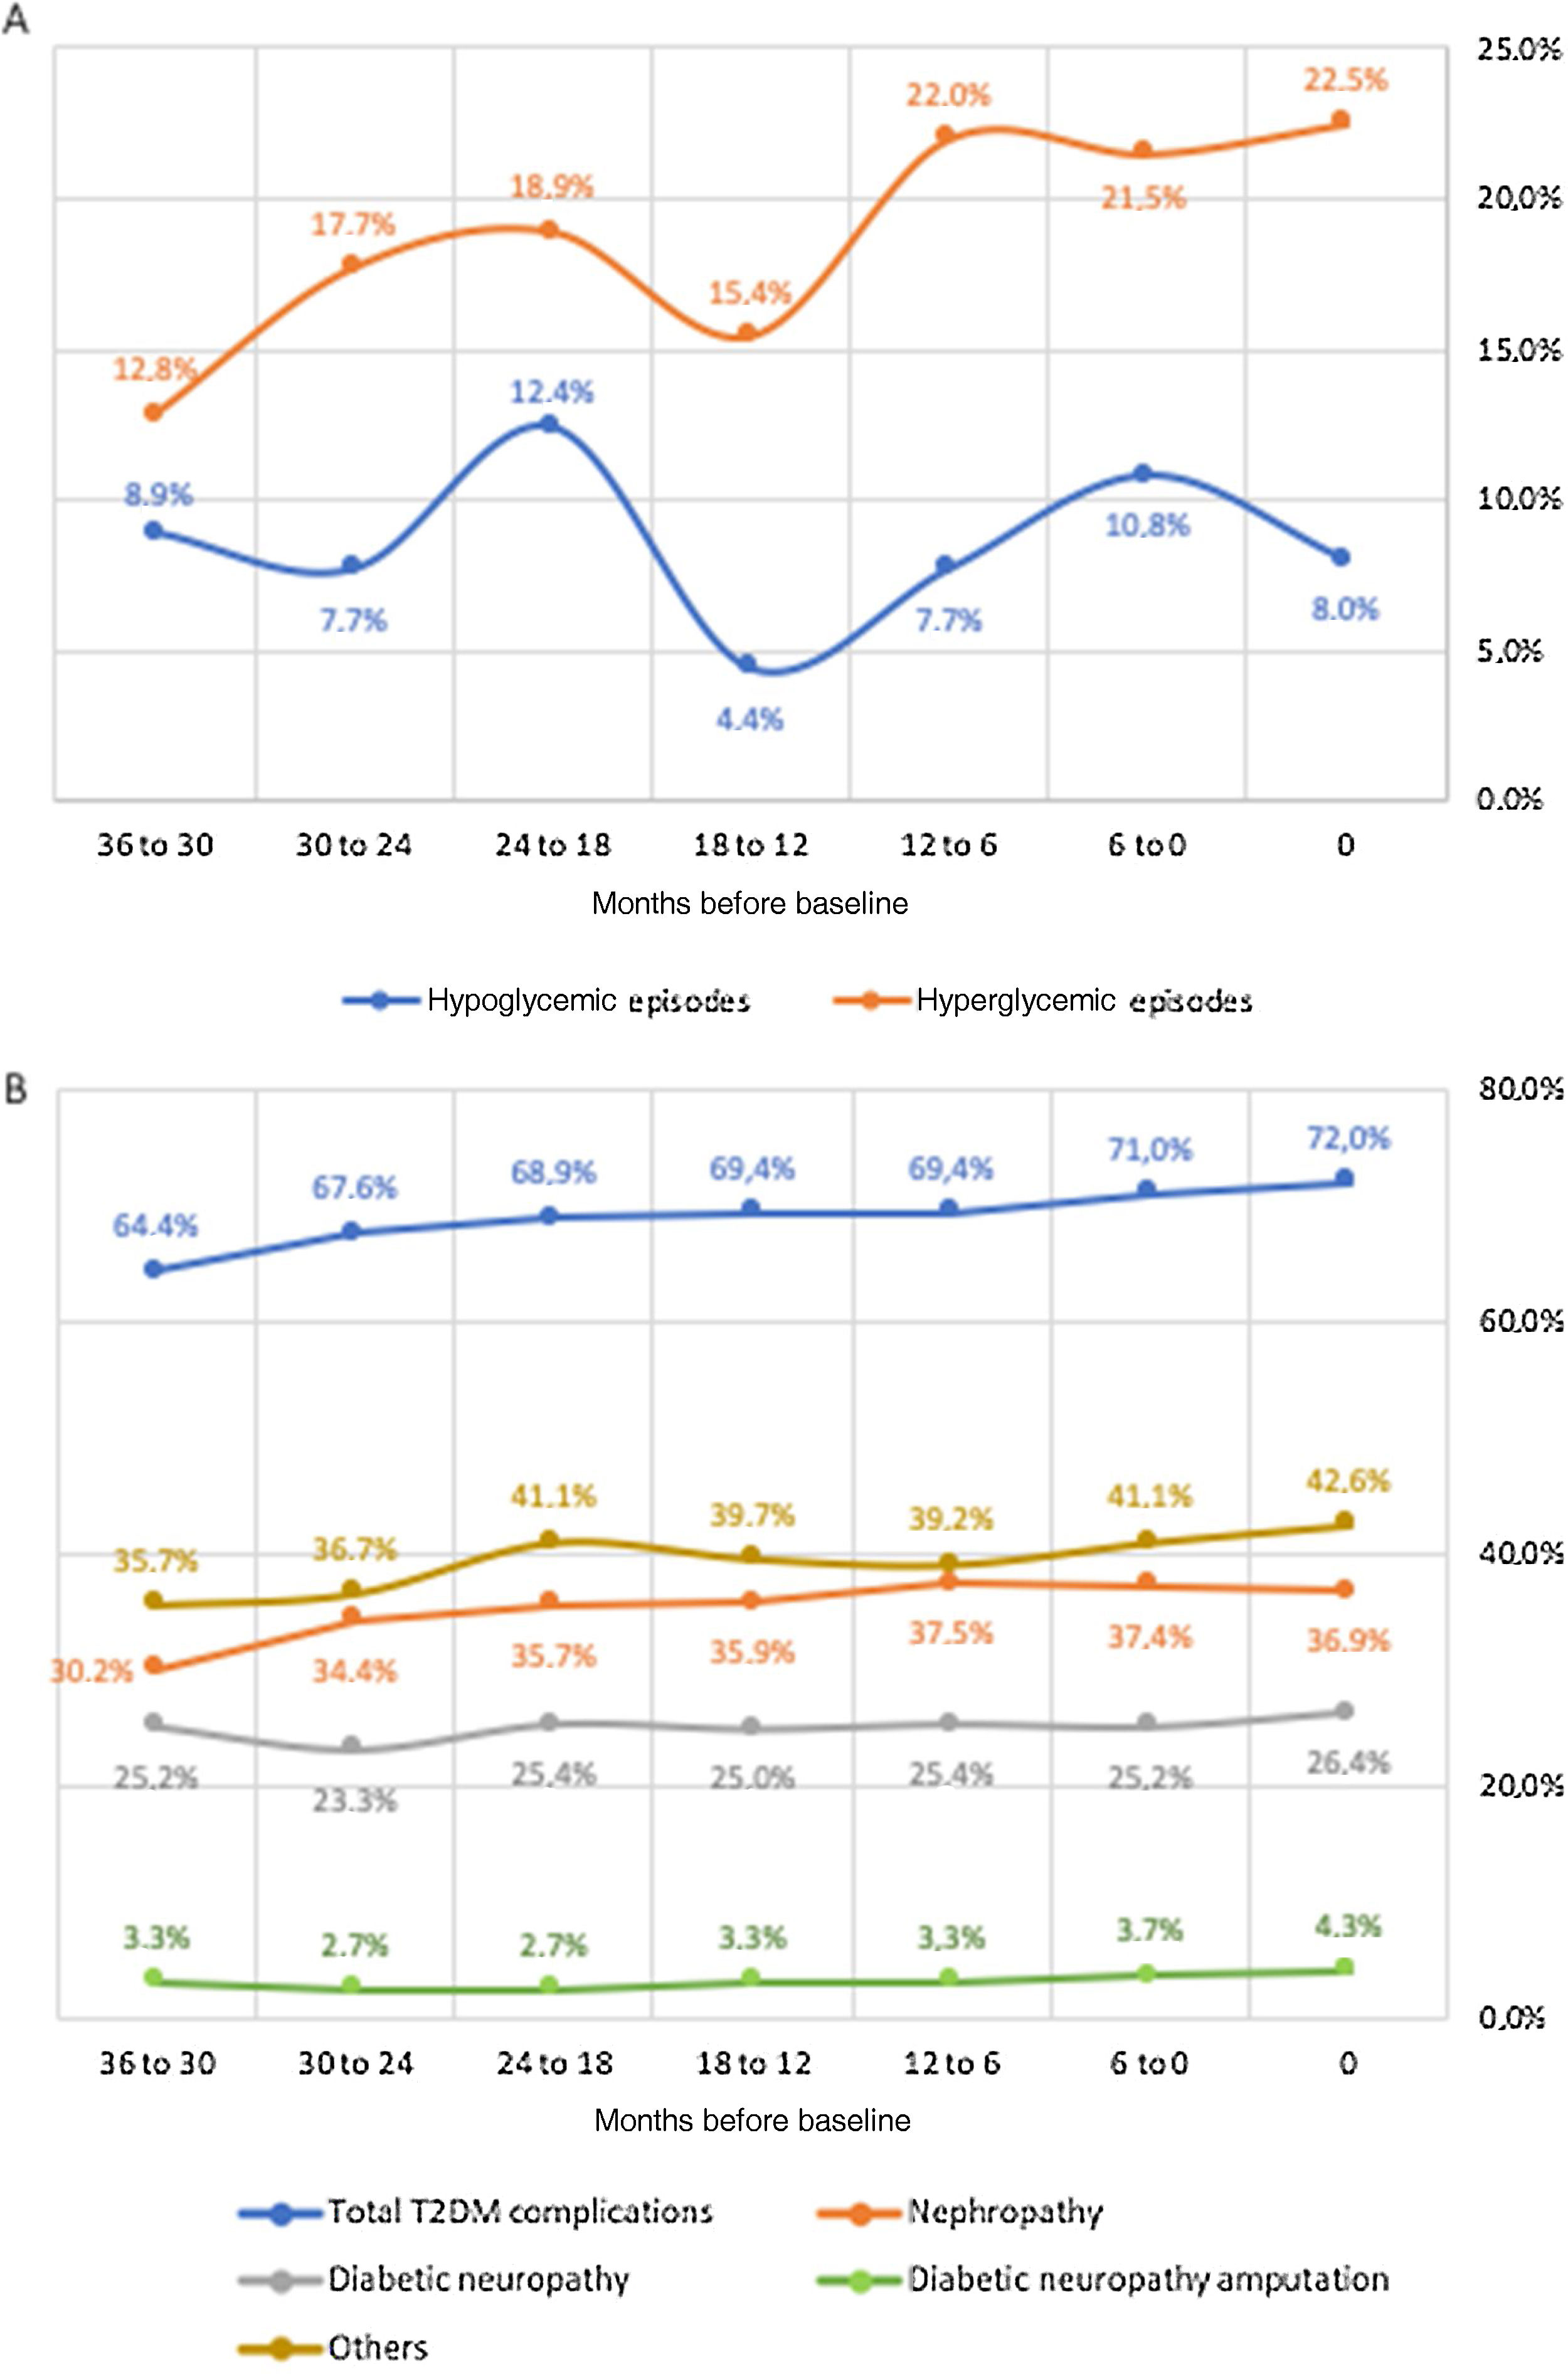
Secondary endpointsAmong the CVD subgroup, medical records for the previous 36 months were available for 191 patients (follow-up subgroup), whose main clinical and demographic characteristics are depicted in Table 1. Figure 2 details disease control, specifically regarding the incidence of hypoglycemic and hyperglycemic episodes and diabetes complications. Overall, the percentage of patients who experienced at least one hypoglycemic episode ranged between 12.4% (at 24 to 18 months before baseline) and 4.4% (at 18 to 12 months before baseline), but the values closest to and farthest from the start of the study were similar, indicating some stability. By contrast, the percentage of patients who experienced at least one hyperglycemic episode increased fairly steadily from 12.8% (at 36 to 30 months before baseline) to 22.5% (at baseline). The percentage of patients who experienced T2D complications showed a similar trend, increasing from 64.4% to 72.0%. Among the assessed complications, nephropathy was the most common and also the one with the highest increase (from 30.2% to 36.9%). Diabetic neuropathy was the second most common complication, affecting 26.4% of patients at baseline, followed by diabetic amputation, which affected 4.3% patients at baseline. The number of hospitalization episodes ranged between four and 12, peaking (15) six months before the beginning of the study (Table 3). Moreover, the number of scheduled hospital appointments for each specialty remained relatively stable throughout the 36 months before the beginning of the study (Table 3), with no clear trend: ophthalmology was the specialty with the highest number of appointments (ranging between 76 and 65), followed by cardiology (65-38), nephrology (33-23), and vascular surgery (32-19).
Number of hospitalization episodes and hospital appointments per six-month period, from 36 months before baseline to baseline (n based on total number of answers provided).
| Months before baseline | 36 to 30 | 30 to 24 | 24 to 18 | 18 to 12 | 12 to 6 | 6 to 0 |
| Hospitalization episodes | 4 (n=143) | 7 (n=154) | 7 (n=154) | 8 (n=149) | 12 (n=152) | 15 (n=157) |
| Cardiology appointments | 41 (n=136) | 38 (n=141) | 47 (n=148) | 40 (n=144) | 42 (n=147) | 65 (n=151) |
| Ophthalmology appointments | 68 (n=132) | 65 (n=138) | 76 (n=143) | 73 (n=142) | 67 (n=142) | 76 (n=146) |
| Nephrology appointments | 30 (n=139) | 30 (n=142) | 33 (n=150) | 23 (n=146) | 23 (n=149) | 28 (n=148) |
| Vascular surgery appointments | 25 (n=132) | 32 (n=136) | 23 (n=142) | 27 (n=139) | 19 (n=141) | 26 (n=143) |
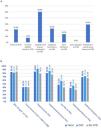
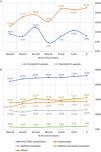
Changes in cardiometabolic risk factors among the follow-up population are detailed in Figure 3. HbA1c decreased from 8.0 to 7.7% (pairwise comparison p=0.003), total cholesterol from 162.9 to 152.6 mg/dl (pairwise comparison p=0.037), waist circumference from 107.8 to 103.7 cm (pairwise comparison p=0.032), BMI from 31.1 to 29.2kg/m2 (pairwise comparison p=0.005), systolic BP from 138.2 to 134.9mmHg (pairwise comparison p=0.146), and diastolic BP from 72.7 to 70.4mmHg (pairwise comparison p=0.093). Overall, significant differences were found concerning changes in total cholesterol (p=0.024), waist circumference (p=0.006), BMI (p=0.002), and diastolic BP (p=0.044). Additionally, Figure 4 depicts changes in eGFR (which varied from 40.7 to 47.9 ml/min/1.73 m2, pairwise comparison p=0.061), LDL-C (48.1 to 54.1 mg/dl, pairwise comparison p=0.205), HDL-C (43.9 to 43.1 mg/dl, pairwise comparison p=0.604) and TG (170.3 to 176.1 mg/dl, pairwise comparison p=0.727); all of these changes were non-significant. Non-HDL (data not shown), which varied from 112.5 to 116.7, also presented non-significant changes (pairwise comparison p=0.167). No pairwise comparison was conducted for albuminuria as different laboratory units were used across centers, with median values varying from 35.0 to 27.0. Most patients had several cardiometabolic risk factors. The distribution of number of risk factors per patient was as follows (n=618): one risk factor, 19 patients (2.8%); two, 39 (5.7%); three, 91 (13.4%); four, 127 (18.6%); five, 177 (26.0%); six, 139 (20.4%); seven, 75 (11.0%); eight, 14 (2.1%).
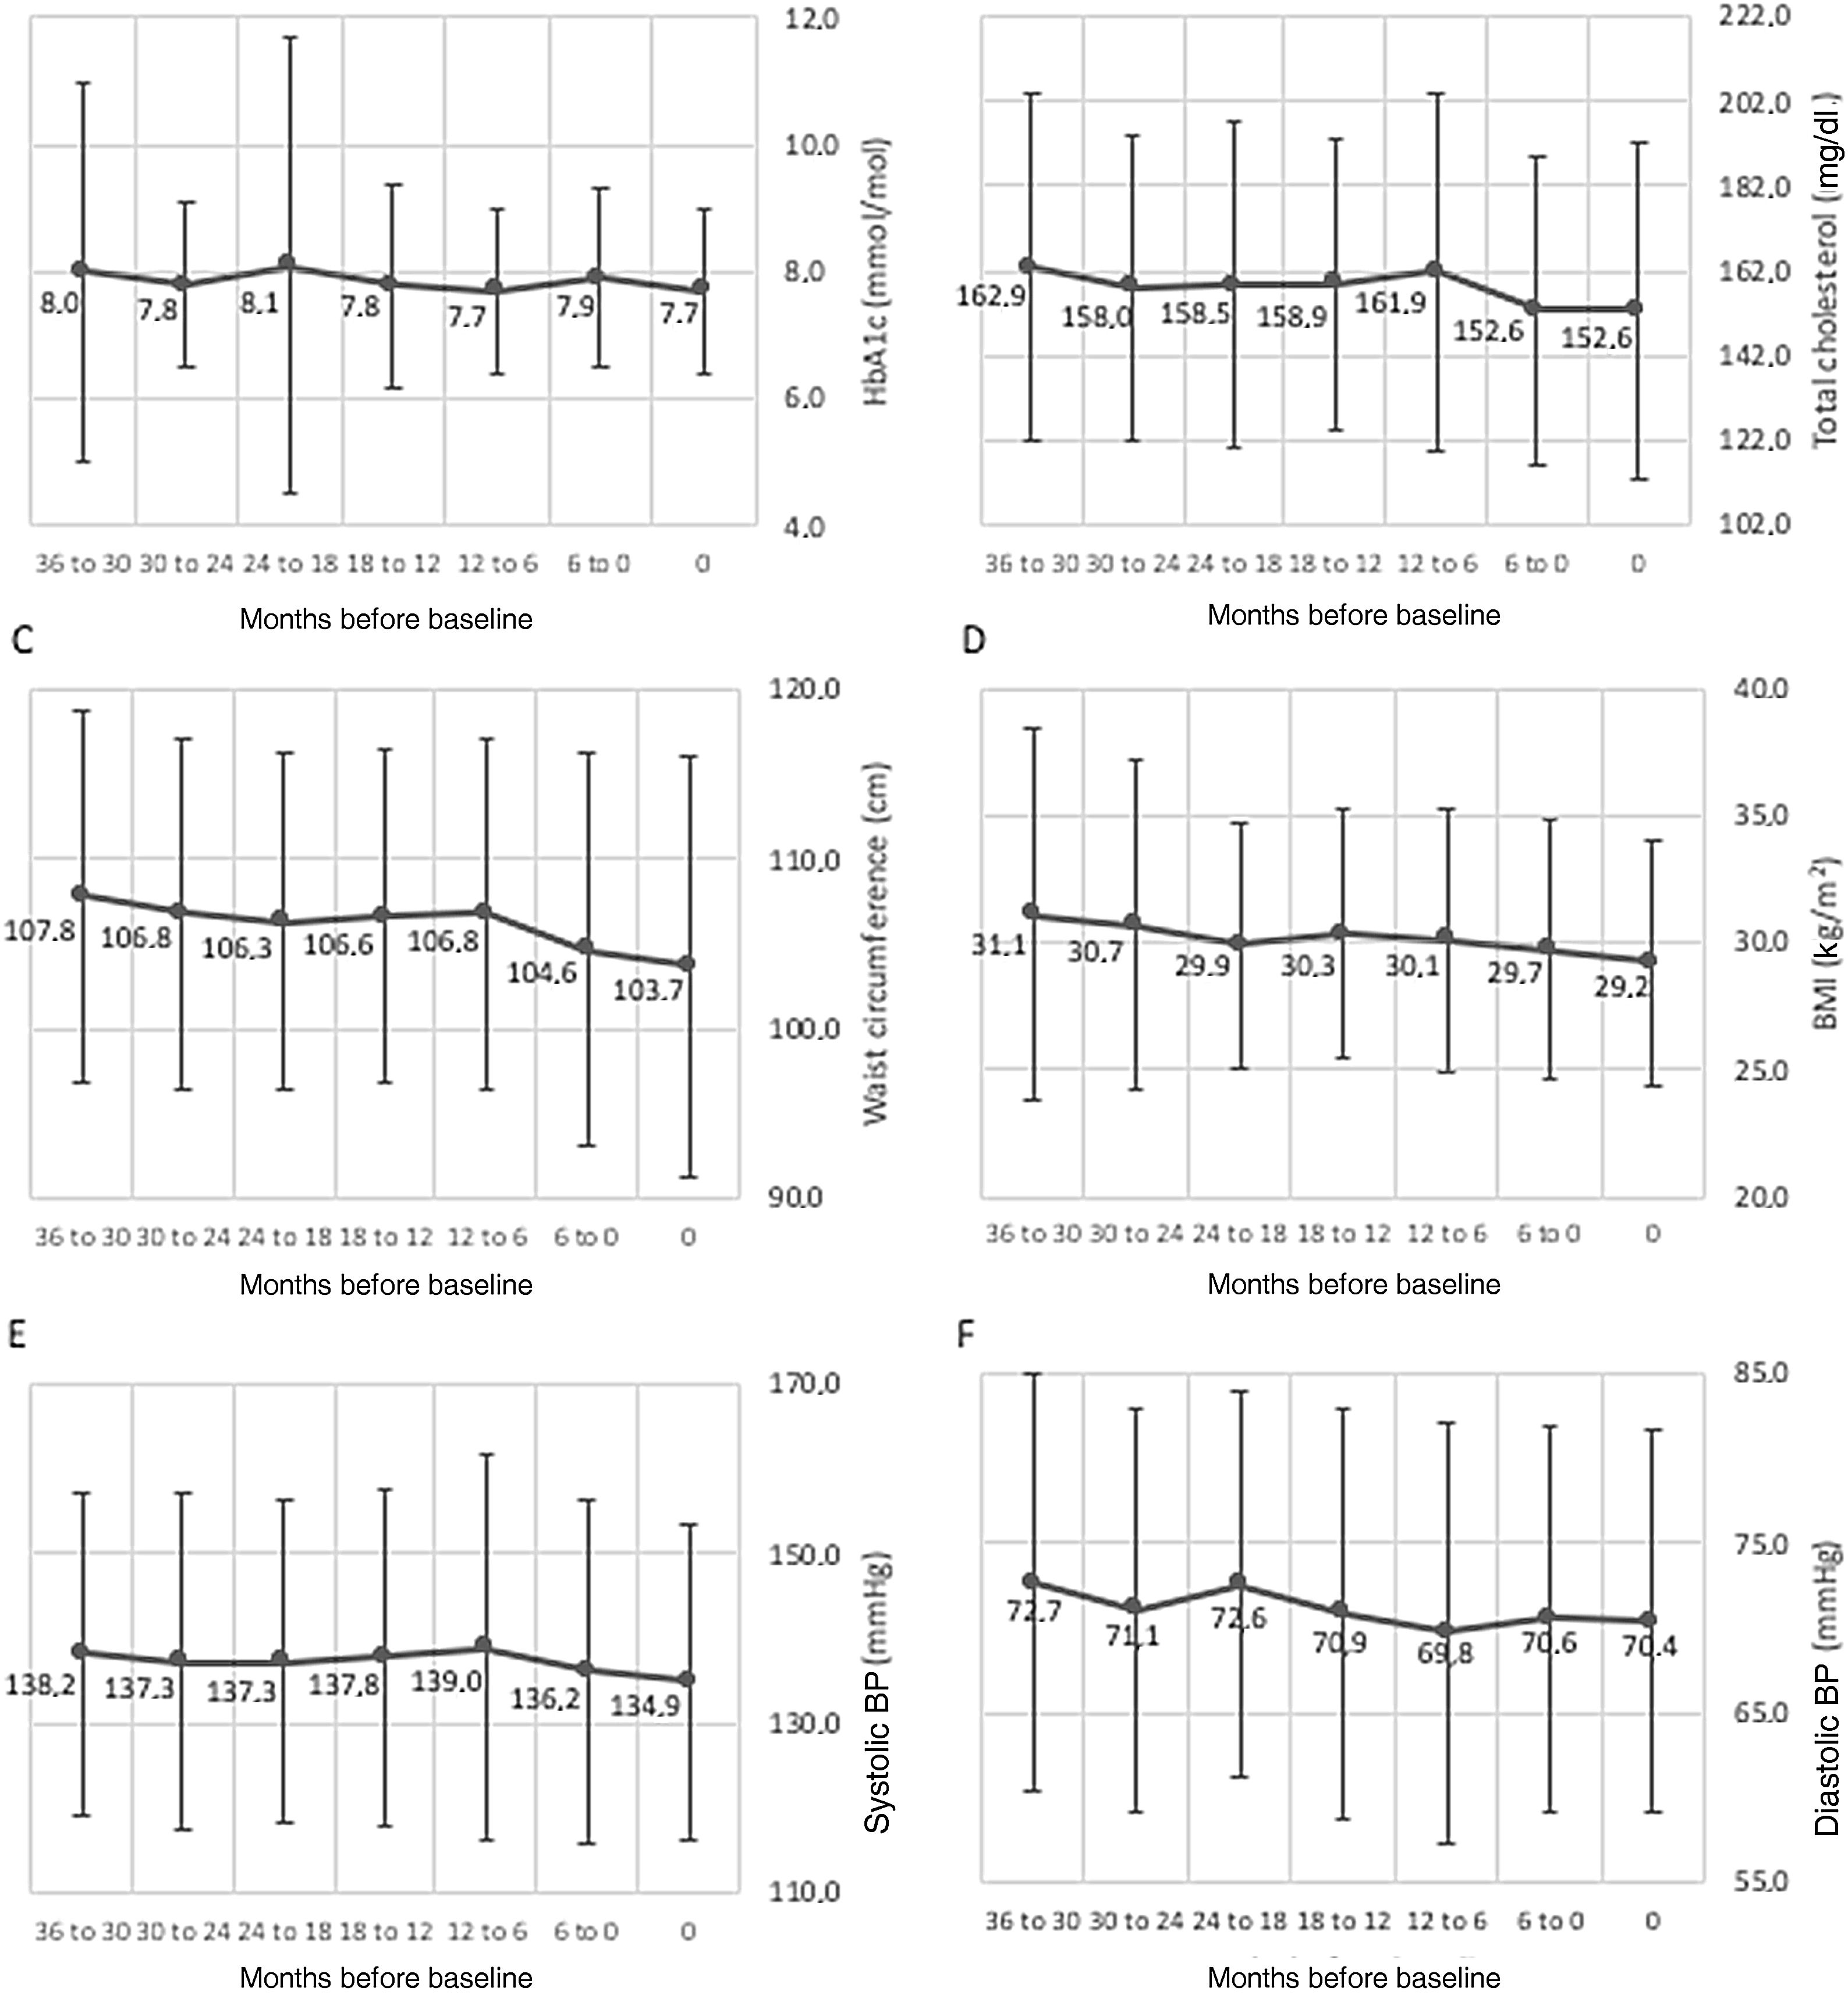
Variation (mean ± standard deviation) of cardiometabolic variables in the three years prior to study inclusion. (A) HbA1c (%), p=0.140; (B) total cholesterol (mg/dl), p=0.024; (C) waist circumference (cm), p=0.006; (D) BMI (kg/m2), p=0.002; (E) systolic BP (mmHg), p=0.226; (F) diastolic BP (mmHg), p=0.044. For each variable, data were obtained at baseline or up to three months before, and then every six months for 36 months (seven data points). BMI: body mass index; BP: blood pressure.
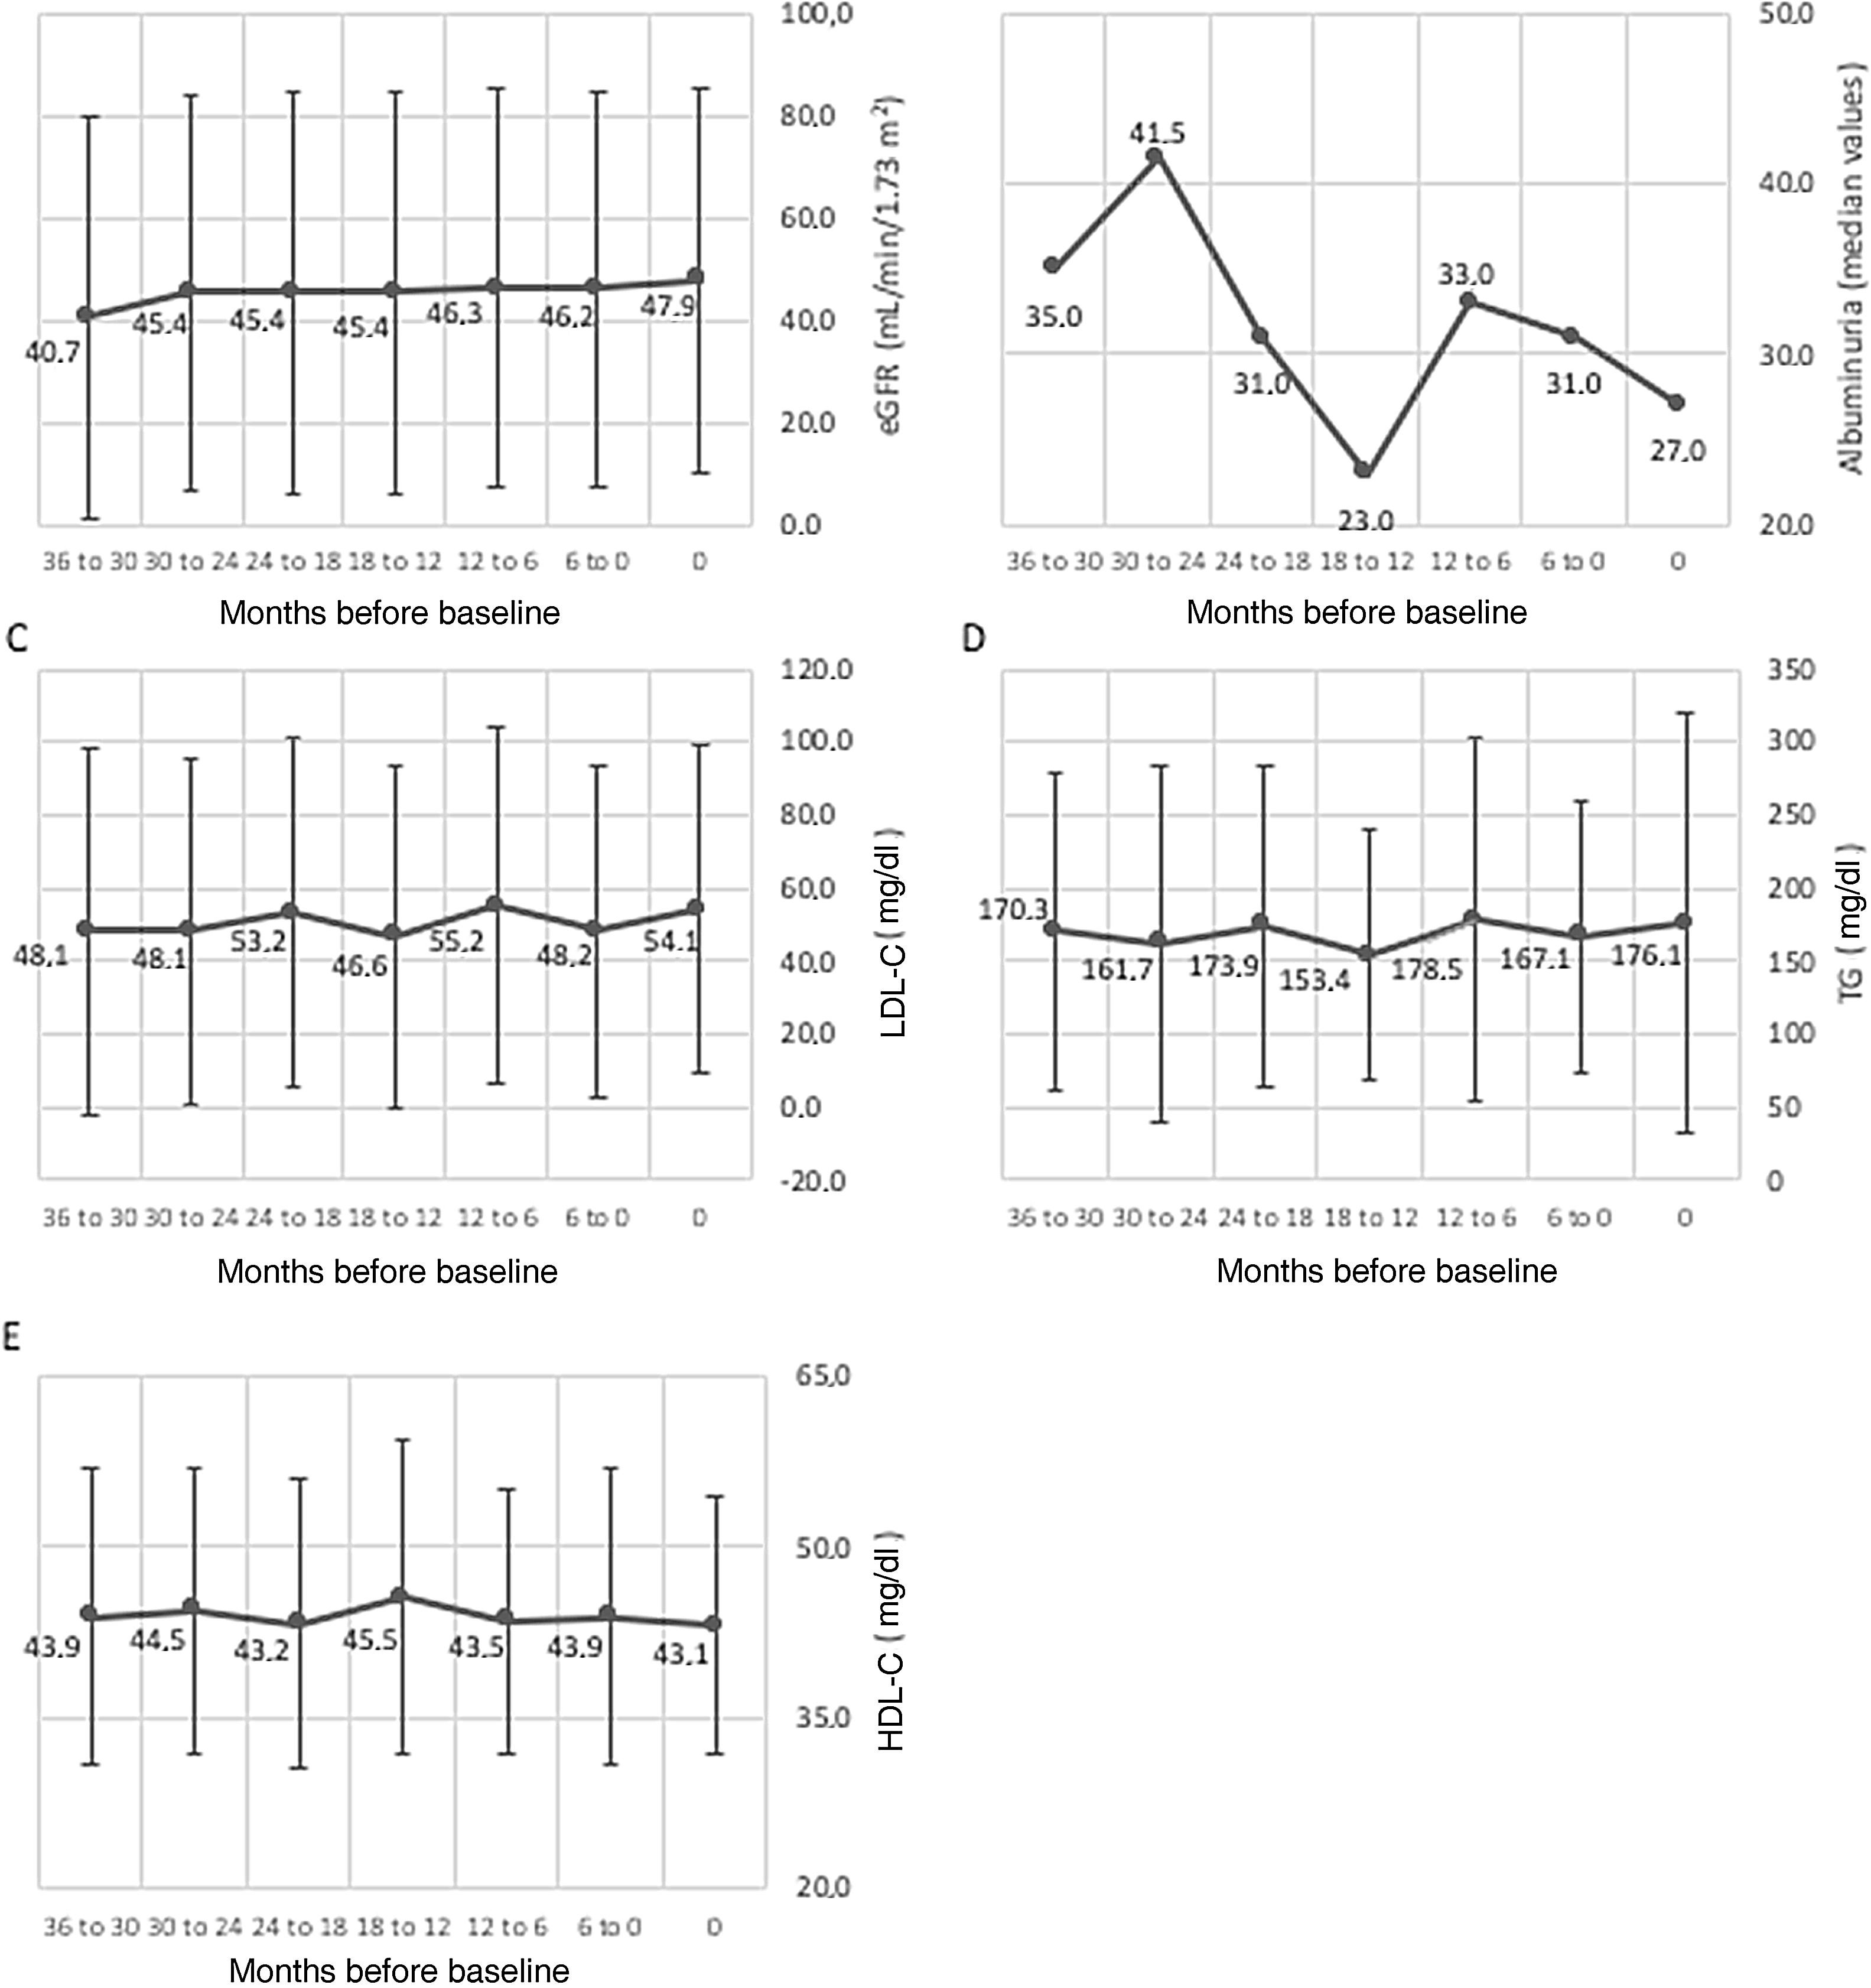
Variation (mean ± standard deviation) of cardiometabolic variables in the three years prior to study inclusion. (A) eGFR (ml/min/1.73 m2), p=0.098; (B) albuminuria (median values); (C) LDL-C (mg/dl), p=0.251; (D) TG (mg/dl), p=0.516; (E) HDL-C (mg/dl), p=0.552. For each variable, data were obtained at baseline or up to three months before, and then every six months for 36 months (seven data points). eGFR: estimated glomerular filtration rate; HDL-C: high-density lipoproteins cholesterol; LDL-C: low-density lipoproteins cholesterol; TG: triglycerides.
Nearly all patients (n=186, 97.4%) in the follow-up population were being treated with at least one drug class at the time of the study, similarly to their treatment 36 months previously (n=181, 94.8%). Overall, at study baseline, 156 patients (83.9%) were taking antidiabetic agents (Table 4), of which insulin was the most commonly prescribed (n=115, 73.7%), followed by biguanides (111, 71.2%), sodium-glucose co-transporter-2 (SGLT2) inhibitors (n=55, 35.3%), glucagon-like peptide-1 (GLP-1) receptor agonists (n=50, 32.1%), sulphonylureas (n=20, 12.8%), dipeptidyl-peptidase 4 inhibitors (n=14, 9.0%), and alpha-glucosidase inhibitors (n=2, 1.3%). Of note, 21 patients (13.4%) were concomitantly treated with SGLT2 inhibitors and GLP-1 receptor agonists. Moreover, 164 (88.2%) patients were taking antihypertensive drugs, 147 (79.0%) were taking lipid-lowering agents, and 135 (72.6%) were taking antiplatelet/anticoagulant agents.
Medication prescribed to the follow-up population at baseline or in the previous 36 months (n=186).
| n (%) | |
|---|---|
| Antihypertensive therapy | 164 (88.2) |
| Beta-blocker | 93 (56.7) |
| Angiotensin-converting enzyme inhibitor | 90 (54.9) |
| Diuretic | 84 (51.2) |
| Calcium channel blocker | 61 (37.2) |
| Angiotensin receptor blocker | 51 (31.1) |
| Antihypertensive combination | 19 (11.6) |
| Aldosterone receptor antagonist | 4 (2.4) |
| Other/unspecified | 7 (4.3) |
| Lipid-lowering therapy | 147 (79) |
| Statin | 144 (98.0) |
| Fibric acid derivative | 25 (17.0) |
| Cholesterol absorption inhibitor | 22 (15.0) |
| Antihyperlipidemic combination | 9 (6.1) |
| PCSK9 inhibitor (evolocumab) | 1 (0.7) |
| Other/unspecified | 1 (0.7) |
| Antiplatelet/anticoagulant therapy | 135 (72.6) |
| Antiplatelet agent | 118 (87.4) |
| Anticoagulant | 28 (20.7) |
| Antidiabetic agents | 156 (83.9) |
| Insulin | 115 (73.7) |
| Biguanides | 111 (71.2) |
| SGLT2 inhibitors | 55 (35.3) |
| GLP-1 receptor agonists | 50 (32.1) |
| Sulphonylureas | 20 (12.8) |
| DPP4 inhibitors | 14 (9.0) |
| Alpha-glucosidase inhibitors | 2 (1.3) |
DPP4: dipeptidyl-peptidase 4; GLP-1: glucagon-like peptide-1; SGLT2: sodium-glucose co-transporter-2.
Cardiovascular disease has a major impact on T2D patients’ morbidity and mortality, and accounts for a substantial part of the healthcare costs associated with the management of these patients. Control of CV risk factors among T2D patients is thus of utmost importance. In this study we assessed the prevalence of CVD morbidity and CV risk factors among a population of T2D patients being followed in a Portuguese hospital setting. We also reviewed the clinical management of those with CVD three years prior to study inclusion, whenever data were available. Of the 715 patients enrolled in this study, 40.0% had been diagnosed with CVD, a clearly higher prevalence than the previously published figure of 15% of Portuguese T2D patients being followed in a primary care setting.11 While this result is to some extent to be expected, as patients followed in a hospital setting tend to have more comorbidities and to be at a more advanced stage of the disease, other authors have also reported lower CVD prevalence rates. For instance, macrovascular complications were present in 12.7% of the 15992 patients from 38 countries enrolled in the DISCOVER study (which included patients initiating second-line therapy and being treated in primary and specialist healthcare settings), 32% of the 248400 patients enrolled in a study based on a national registry in Scotland (Scottish Care Information-Diabetes), 25% of the 91320 patients enrolled in the CVD-REAL Nordic study (who were new users either of SGLT-2 inhibitors or of other glucose-lowering drugs), 28% of the 51286 patients from eight national cohorts enrolled in the IMPROVE study (all of whom required insulin), and 27.2% of the 66726 patients from 28 countries enrolled in the A1chieve study (also insulin users).14–18 Of note, differences in the definitions of CVD used in the different studies cannot be excluded and could partially explain the high CVD prevalence found in our sample. In fact, McGurnaghan et al. stated that the prevalence of CVD in their sample varied from 28% to 44% according to the definition used.15
Another important factor that could have a crucial impact on CVD prevalence is disease duration, which is associated with a higher incidence of complications. A study involving 3130 T2D patients being followed in primary care centers showed that, after 20 years of diabetes duration, 46% of patients presented at least one macrovascular complication.19 Importantly, the mean disease duration of the patients included in this study was longer than that reported in the above-mentioned cohorts: 17.4 years vs. a median of 4.1 years in the DISCOVER study, a median of 7.8 years in the Scottish national registry study, an average of 6.9 years in the IMPROVE study, and an average of 8.0 years in the A1chieve study.14,15,17,18 The time elapsed since diagnosis also explains the high percentage of patients treated with insulin (73.7%), as this drug is usually prescribed in later and more severe stages of T2D. Still, the CVD rate found in our sample exceeds those of many international studies – some of which included solely insulin-treated patients – which highlights a worrisome scenario.
All patients in the FAS had at least one CV risk factor, and three of these risk factors were present in over 80% of patients: hypertension (84.4%), obesity and overweight (83.1%), and hypercholesterolemia (80.3%). Unsurprisingly, the prevalence of these risk factors was somewhat lower among Portuguese people with T2D being treated at primary care centers, typically at earlier stages of disease: the study by Cardoso et al. revealed that 80.3% patients had hypertension and 61.6% had hypercholesterolemia.11 However, the percentage of patients with CV risk factors in our sample was also higher than that seen among a population of 735 T2D patients from two Madrid districts being treated by an endocrinologist at the hospital (45% of whom were obese and 40% of whom had high levels of LDL-C and total cholesterol), as well as in 3130 patients attending primary care centers in the Catalonia region (42.9%, 42.3% and 56.2% of whom were hypertensive, obese and had high LDL-C, respectively) and also compared to patients in the Scottish Care Information-Diabetes registry (among whom the rates of hypertension, obesity and hypercholesterolemia were 57.9%, 46.5% and 22.7%, respectively).15,19,20 Nevertheless, the mean HbA1c, BMI, waist circumference, and systolic and diastolic BP found in our sample were within the range of those reported in other studies.14,15,17–22
Interestingly, patients with established CVD had slightly but significantly better mean values of key cardiometabolic risk factors (BMI [p=0.019], systolic BP [p=0.01] and diastolic BP [p<0.001]) than those without CVD. This improvement is likely the result of appropriate medical management once CVD is diagnosed. However, the scenario is different regarding dyslipidemia: in the population with established CVD there is a higher prevalence of low HDL and/or high TG, a phenotype sometimes referred to as atherogenic dyslipidemia.23 These CV risk factors, namely hypertension, hypercholesterolemia, low HDL and high TG, were also significantly associated with CVD in other studies.18,24 In light of this, there is a need to improve the lipid profile of T2D patients with CVD.
The lack of standardized reporting of CVD manifestations by investigators in this study could have resulted in underestimation of CVD, due to potential lack of clinical suspicion. Nevertheless, underdiagnosed conditions such as peripheral or carotid artery disease (29.5%) and heart failure (22.7%) often appear as the second and third most common manifestations of CVD in T2D patients in Portugal, according to our findings. The current paradigm shift with disease-modifying drugs available for both conditions highlights the need to lower the threshold to look for these diseases and optimize their medical treatment.25,26
In our study, data from the previous three years were only available for 191 of the 286 T2D patients with established CVD. This number is below the projected population size (430) that would allow precise estimates with 95% confidence intervals concerning the secondary objective, even when this number is subsequently adjusted taking into account the prevalence of CVD. As such, the trends identified in the follow-up subgroup may lack statistical precision and should be interpreted with caution.
The incidence of hypoglycemic episodes remained approximately stable throughout the three-year period analyzed; however, while mean HbA1c levels saw no significant changes, the incidence of hyperglycemic episodes rose from 12.8% to 22.5%. The percentage of patients experiencing diabetes complications presented a similar trend, increasing from 64.4% to 72.0%. While this could be related to the natural progression of T2D, following the expected progressive loss of beta-cell function, the possibility cannot be excluded that lack of therapeutic optimization or low adherence to medication may have played a role in this dynamic, at least for some patients. Moreover, and unlike the increase in the frequency of complications, the number of hospitalization episodes and hospital appointments remained relatively stable throughout the 36 months before the beginning of the study, suggesting suboptimal utilization of healthcare resources. By contrast, with regard to cardiometabolic risk factors, small but significant improvements were seen in total cholesterol levels, waist circumference, BMI and diastolic BP. Together with the absence of deterioration in other parameters – especially eGFR – this suggests appropriate clinical management of CVD patients, particularly for preservation of renal function and promotion of a healthy lifestyle.
It is worth mentioning that the mean HbA1c level in our cohort (7.7±1.3%) indicates inadequate glycemic control in at least some patients. Although the latest clinical guidelines recommend that the glycemic goal should be individualized taking into account various patient and disease features, a target of <7% is considered the gold standard.27 Despite the large proportion of patients in our sample already treated with insulin, the high HbA1c values suggest that there is room for improvement regarding therapeutic optimization and intensification.
According to the most recent American Diabetes Association (ADA) and European Association for the Study of Diabetes (EASD) consensus, treatment with GLP-1 receptor agonists or SGLT2 inhibitors is recommended in T2D patients with established CVD, regardless of HbA1c levels, due to the CV benefits some drugs of these classes have demonstrated.22 Importantly, 84 (53.8%) of the follow-up group treated with antidiabetic drugs in our study were using GLP-1 receptor agonists and/or SGLT2 inhibitors. Although this demonstrates rapid adoption of these recommendations within the hospital setting, almost half of these CVD patients could still benefit from an antidiabetic therapy with proven CV benefits.
Our study has several potential limitations that should be considered when interpreting its findings. One is the lack of information concerning patients’ lifestyle habits (especially alcohol consumption and regular exercise) and socioeconomic data (such as income and occupational status), which may amount to residual confounding factors. Moreover, we did not define thresholds for CV risk factors, and so their reporting was based on physicians’ clinical judgment, and some degree of heterogeneity is likely to be present.
ConclusionsOverall, our study detected a high prevalence of CVD and CV risk factors among a cohort of Portuguese T2D patients being followed in a hospital setting. While the retrospective analysis of a small subset of patients with established CVD showed small but significant improvements in key cardiometabolic indicators, the overall scenario suggests the need to detect and manage CV risk factors in T2D patients who are not yet diagnosed with CVD, in order to prevent these complications. Optimized use of antidiabetic drugs with proven CV benefits could also help to improve outcomes in patients with established CVD and to prevent a primary event in patients with CV risk factors. Better diabetes control (including individualized therapeutic optimization and routine reassessment), as well as more rational use of healthcare resources, should also lead to better HbA1c control and thereby prevent CVD and improve the clinical outcomes of T2D patients.
Conflicts of interestsH.C. reports consultancy work for Lilly. C.T.B. reports speaker fees from Merck Sharp & Dohme, Bial and consultancy work for Medinfar. L.A. reports membership of the advisory board and consultancy/speaker fees from AstraZeneca, Lilly, Boehringer-Ingelheim, Novo Nordisk and Bial.
F.S.R. reports consultancy work for Medinfar. J.L. reports speaker fees from Merck Sharp & Dohme, AstraZeneca, Novo Nordisk, Lilly, Medinfar and Boehringer-Ingelheim. C.N. reports speaker fees from Ascensia and Novartis. E.R. reports speaker fees from Merck Sharp & Dohme. N.B.V. reports speaker fees from AstraZeneca, Lilly, Bial, Servier, Merck and Merck Sharp & Dohme. T.C. is an employee of Novo Nordisk.
Authors’ contributionsAll the authors participated in the drafting, critical revision, and approval of the final version of the manuscript. T.C. was involved in study design. H.C., C.T.B., L.A., F.S.R., J.L., C.N., E.R. and N.B.V. were investigators in the study. All the authors were involved in the interpretation of study results.
The PICT2RE study was funded by Novo Nordisk. The authors acknowledge all the investigators who participated in the PICT2RE study. A complete list of all the investigators and contributors to the PICT2RE study is provided in the Supplementary appendix. Statistical analysis (Adriana Belo) and writing support (Catarina Santos and Duarte Oliveira) were provided by W4Research during the preparation of this paper, funded by Novo Nordisk.
The following are the supplementary data to this article:

