


Ischemic heart disease is the single most common cause of death in Europe. Mortality in patients presenting with ST-elevation myocardial infarction (STEMI) is associated with many factors, one of which is the time delay to treatment. The purpose of this work is to analyze the coronary pathway in our region in terms of timing, taking into consideration the place of first medical contact (FMC).
MethodsConsecutive patients admitted to our center with STEMI to undergo percutaneous coronary intervention (PCI) between 2013 and 2022 were analyzed. Age, gender, and time delays were collected. Analysis was performed with IBM SPSS version 28 for a significance level of 0.05.
ResultsWe found that non-PCI centers had a significantly greater FMC to diagnosis delay and diagnosis to wire delay compared to other places of origin. Only 2.2% of patients met the 10-min FMC to diagnosis target; 44.8% met the target of 90 min from diagnosis to wire in transferred patients, while 40.6% met the 60-min target for patients admitted to a PCI center. Median patient, electrocardiogram (ECG) and logistic delays are 92.0±146.0 min, 19.0±146.0 min and 15.5±46.3 min, respectively.
ConclusionA significant difference between state-of-the-art targets and reality was found, depending on the place of FMC, with the worst delays in non-PCI centers. Patient delay, ECG delay, FMC to diagnosis and logistic delay are identified as key areas in which to intervene.
A doença isquémica cardíaca é a causa mais comum de mortalidade na Europa. Na população de doentes que se apresenta com síndrome coronária aguda com elevação do segmento ST (STEMI), esta mortalidade está associada a diversos fatores, sendo um deles o tempo até ao tratamento. O objetivo deste trabalho é avaliar a via verde coronária na nossa região em termos dos tempos de demora, tendo em consideração o local de primeiro contacto.
MétodosForam avaliados doentes consecutivos entre 2013 e 2022 admitidos no nosso centro com STEMI para a realização de angioplastia primária (PCI). Variáveis de idade, sexo e atrasos foram recolhidas. Os dados foram analisados com o SPSS Versão 28 para um nível de significado estatístico de 0,05.
ResultadosOs centros sem PCI tiveram um atraso entre o primeiro contacto médico (FMC) e o diagnóstico significativamente maior, bem como desde o diagnóstico até a passagem do fio pela lesão, quando comparado com os restantes grupos. Apenas 2,2% dos doentes cumpriram o critério de diagnóstico de STEMI nos primeiros 10 minutos desde o FMC. Nos pacientes transferidos 44,8% cumpriram o critério de 90 minutos desde o diagnóstico até a passagem do fio guia. Por seu turno, nos doentes admitidos no centro com PCI, 40,6% dos pacientes cumpriram o critério de 60 minutos desde o diagnóstico até a passagem do fio guia. Tempos medianos globais de atraso do paciente, até realização da eletrocardiograma (ECG) e logístico são de 92,0±146,0 minutos, 19,0±146,0 minutos e 15,5±46,3 minutos, respetivamente.
ConclusãoEncontrou-se uma diferença significativa entre aqueles que são os alvos de tempo definidos internacionalmente e a realidade, com os piores atrasos nos centros sem PCI. Identificaram-se deste modo áreas essenciais de intervenção em termos do atraso dos pacientes, ECG, do tempo até diagnóstico e atraso logístico.
Ischemic heart disease is the single most common cause of death in most of Europe, and its frequency is increasing.1 Mortality in patients presenting with ST-elevation myocardial infarction (STEMI) is associated with many factors, one of which is the time delay to treatment. Revascularization options are percutaneous coronary intervention (PCI) and fibrinolysis, and the decision should be based on predicted delays and the timing of presentation.1,2
Treatment delays should therefore be recorded systematically and audited, in order to detect avoidable systemic delays and to enable measures to be implemented at community, hospital, and emergency service levels, with a view to improving the effectiveness of the healthcare pathway and quality of care. The European Society of Cardiology guidelines on STEMI define target times for PCI as follows1:
- –
Maximum time from first medical contact (FMC) to electrocardiogram (ECG) and diagnosis: 10 min.
- –
Maximum expected delay from STEMI diagnosis to primary PCI (wire crossing): 120 min.
- –
Maximum time from STEMI diagnosis to wire crossing in PCI center: 60 min.
- –
Maximum time from STEMI diagnosis to wire crossing in transferred patients: 90 min.
The purpose of this work is to analyze the evolution of the coronary pathway in our region in terms of response time and delays, taking into consideration the place of FMC. This analysis will be the foundation of a critical appraisal that will enable informed decisions to be made at clinical, organizational, and policy levels, to improve cardiovascular care in our region.
MethodsStudy populationPrimary data for this study were obtained by analyzing consecutive patients admitted to our center with STEMI to undergo PCI between 2013 and 2022. The data were originally collected using a written form, and subsequently time differences were coded into a database. All data were anonymized for the purpose of the present analysis.
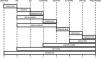
Data collectionDemographic data (age and gender) were collected for each patient. To characterize the timeline of the STEMI pathway, data were collected regarding the year that the procedure was performed, time before patients sought medical attention (patient delay), time from FMC to ECG acquisition (ECG delay), time from ECG acquisition to activation of the intervention team (diagnostic delay), time from FMC to diagnosis, time from intervention team activation to departure from the secondary location (logistic delay), time from FMC to departure from the secondary location (door-in door-out [DIDO] time), transport time, time from arrival at the PCI center to arrival in the catheterization laboratory (center delay), procedure time, time from arrival at the PCI center to wire crossing (door-to-wire time), time from diagnosis to wire crossing, time from FMC to wire crossing, and total ischemia time. Figure 1 illustrates the timeline analyzed. Regarding the place of presentation, patients were divided into four groups: coming from primary care physicians (PCPs), emergency first responders (EFRs), our PCI center, or other, non-PCI, centers. The variables of logistic delay and transport time are not applicable to the PCI center population. The variable DIDO is not applicable to the EFR or PCI center groups.
Statistical analysis
Normality was verified by the Kolmogorov–Smirnov test. All continuous variables are described using median±interquartile range. Categorical variables are summarized as absolute and relative frequencies for each data category. The Mann–Whitney U test was used to compare numerical variables for the DIDO variable, and the Kruskal–Wallis test and pairwise comparisons using the Bonferroni correction were performed to investigate the specific differences between groups for the other numerical variables. Categorical variables were compared with the chi-square test, and post-hoc analysis using residual analysis was conducted to explore specific group differences. A significance level of 0.05 was assumed for all analyses. The statistical analysis was performed using IBM SPSS version 28.
ResultsOur cohort included a total of 1962 patients from between 2013 and 2022, median age 64.0±21.0 years and 1460 male (74.5%). In this cohort, most patients came from outside our PCI center, as demonstrated in Table 1. PCPs and non-PCI centers accounted for most referrals, with 525 (26.9%) and 519 (26.6%) patients, respectively, followed by the EFR group (500 patients, 25.6%).
Baseline characteristics of the study cohort.
| PCI (n=1962) | |
|---|---|
| Year, n (%) | |
| 2013 | 138 (7.0) |
| 2014 | 148 (7.5) |
| 2015 | 171 (8.7) |
| 2016 | 189 (9.6) |
| 2017 | 205 (10.4) |
| 2018 | 224 (11.4) |
| 2019 | 227 (11.6) |
| 2020 | 241 (12.3) |
| 2021 | 195 (9.9) |
| 2022 | 224 (11.4) |
| Age, years, median (IQR) | 64 (21.0) |
| Male gender, n (%) | 1460 (74.5) |
| Patient delay, min, median (IQR) | 92 (146.0) |
| ECG delay, min, median (IQR) | 19 (47.0) |
| Diagnostic delay, min, median (IQR) | 54 (96.0) |
| FMC to diagnosis, min, median (IQR) | 92 (142.0) |
| Logistic delay, min, median (IQR) | 16 (46.3) |
| DIDO time, min, median (IQR) | 110 (155.0) |
| Transport time, min, median (IQR) | 58 (25.0) |
| Center delay, min, median (IQR) | 16 (59.0) |
| Procedure time, min, median (IQR) | 28 (13.5) |
| Door to wire, min, median (IQR) | 52 (58.0) |
| Diagnosis to wire, min, median (IQR) | 89 (58.0) |
| FMC to wire, min, median (IQR) | 193 (152.3) |
| Total ischemia time, min, median (IQR) | 311 (309.0) |
| Place of origin, n (%) | |
| PCPs | 525 (26.9) |
| EFRs | 500 (25.6) |
| Non-PCI centers | 519 (26.6) |
| PCI center | 406 (20.8) |
DIDO: door-in door-out; ECG: electrocardiogram; EFRs: emergency first responders; FMC: first medical contact; IQR: interquartile range; PCI: percutaneous coronary intervention; PCPs: primary care physicians.
In the overall cohort, delay from FMC to diagnosis was 92.0±142.0 min There was a significant difference between the origin groups (chi-square=103.5, degrees of freedom [df]=3, p<0.001). EFRs demonstrated a significant difference compared to the PCI center, PCPs and non-PCI centers (z=99.9, p=0.028; z=234.3, p<0.001; and z=309.9, p<0.001), indicating that the PCI center, PCPs and non-PCI centers had significantly higher FMC to diagnosis time compared to EFRs. The PCI center also demonstrated a significant difference compared to PCPs and non-PCI centers (z=134.5, p=0.001; and z=210.0, p<0.001), indicating that PCPs and non-PCI centers had significantly longer FMC to diagnosis time than the PCI center. No significant differences were found between PCPs and non-PCI centers (z=75.5, p=0.123). Median times are represented in Table 2.
Times according to place of origin.
| PCPs (n=525) | Non-PCI centers (n=519) | EFRs (n=500) | PCI center (n=406) | p | |
|---|---|---|---|---|---|
| Year, n (%) | 0.014 | ||||
| 2013 | 47 (9.0) | 24 (4.6) | 32 (6.4) | 34 (8.4) | |
| 2014 | 37 (7.0) | 34 (6.6) | 38 (7.6) | 38 (9.4) | |
| 2015 | 52 (9.9) | 56 (10.8) | 33 (6.6) | 29 (7.1) | |
| 2016 | 58 (11.0) | 53 (10.2) | 47 (9.4) | 30 (7.4) | |
| 2017 | 55 (10.5) | 47 (9.1) | 55 (11.0 | 46 (11.3) | |
| 2018 | 63 (12.0) | 58 (11.2) | 62 (12.4) | 39 (9.6) | |
| 2019 | 69 (13.1) | 60 (11.6) | 56 (11.2) | 41 (10.1) | |
| 2020 | 63 (12.0) | 58 (11.2) | 57 (11.4) | 63 (15.5) | |
| 2021 | 37 (7.0) | 63 (12.1) | 59 (11.8) | 36 (8.9) | |
| 2022 | 44 (8.4) | 66 (12.7) | 61 (12.2) | 50 (12.3) | |
| Age, years, median (IQR) | 62 (21.0) | 64 (21.0) | 64 (21.0) | 65 (22.0) | 0.197 |
| Male gender, n (%) | 392 (74.8) | 384 (74.1) | 393 (78.8) | 283 (69.7) | 0.021 |
| Patient delay, min, median (IQR) | 90 (151.3) | 99 (142.0) | 90 (130.3) | 104 (192.5) | 0.274 |
| ECG delay, min, median (IQR) | 21 (51.3) | 28 (62.0) | 10 (25.0) | 21 (43.0) | <0.001 |
| Diagnostic delay, min, median (IQR) | 65 (97.0) | 73 (123.0) | 35 (73.0) | 39 (78.3) | <0.001 |
| FMC to diagnosis, min, median (IQR) | 115 (137.0) | 128 (169.0) | 60 (109.8) | 75 (133.0) | <0.001 |
| Logistic delay, min, median (IQR) | 12 (38.5) | 35 (50.5) | 5 (19.0) | <0.001 | |
| DIDO time, min, median (IQR) | 100 (135.3) | 159 (186.8) | <0.001 | ||
| Transport time, min, median (IQR) | 57 (29.0) | 60 (19.0) | 57 (27.0) | 0.117 | |
| Center delay, min, median (IQR) | 15 (54.5) | 12 (20.0) | 14 (45.8) | <0.001 | |
| Procedure time, min, median (IQR) | 28 (14.0) | 28 (14.0) | 29 (14.0) | 29 (15.0) | 0.942 |
| Door to wire, min, median (IQR) | 50 (55.0) | 43 (30.5) | 48 (45.0) | 101 (108.0) | <0.001 |
| Diagnosis to wire, min, median (IQR) | 90 (52.0) | 112 (69.0) | 88 (46.0) | 67 (39.0) | <0.001 |
| FMC to wire, min, median (IQR) | 208 (127.8) | 251 (184.0) | 155 (108.0) | 147 (158.0) | <0.001 |
| Total ischemia time, min, median (IQR) | 318 (280.3) | 381.0 (335.0) | 262.0 (229.0) | 286.0 (375.0) | <0.001 |
DIDO: door-in door-out; ECG: electrocardiogram; EFRs: emergency first responders; FMC: first medical contact; IQR: interquartile range; PCI: percutaneous coronary intervention; PCPs: primary care physicians.
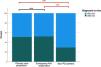
The observed median time from STEMI diagnosis to wire crossing was 89.0±58.0 min. There was a significant difference between the origin groups (chi-square=167.8, df=3, p<0.001). The PCI center demonstrated a significant difference compared to EFRs, PCPs and non-PCI centers (z=177.7, p<0.001; z=219.0, p<0.001; and z=399.9, p<0.001), indicating that EFRs, PCPs and non-PCI centers had significantly shorter STEMI diagnosis to wire-crossing time compared to the PCI center. These differences are clearly represented in Figure 2. Non-PCI centers also demonstrated a significant difference compared to PCPs and EFRs (z=222.2, p<0.001; and z=181.0, p<0.001), indicating that PCPs and EFRs had significantly shorter STEMI diagnosis to wire-crossing time than non-PCI centers. No significant differences were found between PCPs and EFRs (z=41.3, p=0.848). Median times are represented in Table 2.

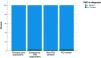
Only 37 patients (2.2%) from our cohort met the target time from FMC to diagnosis of 10 min. Group analysis showed that there were no significant differences between groups according to origin (chi-square=6.2, df=3, p=0.103). EFRs and the PCI center had the highest proportion of patients who met this target, with 3.2% and 2.9% respectively (Figure 3).

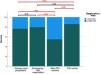
Around three quarters of the patients (967, 74.1%) met the target in the guidelines for the maximum expected delay from STEMI diagnosis to wire crossing (120 min). There was a significant difference between the origin groups (chi-square=86.5, df=3, p<0.001). Post-hoc analysis showed a significant difference in the distribution in the PCI center compared to non-PCI centers and PCPs (residual=6.2, p<0.050; residual=1.8, p<0.050), indicating that the PCI center had a significantly higher proportion who met the target compared to non-PCI centers and PCPs (86.0% compared to 55.0% and 76.5%, respectively). A significant difference between non-PCI centers and EFRs/PCPs was also found (residual=−5.1, p<0.05; residual=−4.4, p<0.050), indicating that a significantly higher proportion of patients originating from EFRs and PCPs met the target compared to non-PCI center patients. No significant differences were found between the PCI center and EFRs (residual=1.1, p>0.050) or between EFRs and PCPs (residual=0.7, p>0.050) (Figure 4).

A maximum of 90 min from STEMI diagnosis to wire crossing was achieved in 44.8% of patients not admitted to the PCI center. There was a significant difference between the origin groups (chi-square=43.5, df=2, p<0.001). Post-hoc analysis showed a significant difference in the distribution of non-PCI centers compared to EFRs and PCPs (residual=−2.1, p<0.050; residual=−2.3, p<0.050), indicating that a significantly lower proportion of patients who met the target came from non-PCI centers compared to EFR and PCP patients (29.4% vs. 52.2% and 51.1%, respectively). No significant difference was found between PCPs and EFRs (residual=−0.2, p>0.050) (Figure 5).

In the PCI center group, a maximum of 60 min from STEMI diagnosis to wire crossing was achieved in 40.6% of patients.
Looking beyond the guideline goalsMedian patient delay was 92.0±146.0 min and there was no significant difference between the origin groups (chi-square=3.9, df=3, p=0.274). The procedure duration median was 28.0±13.5 min, and no significant differences were found between origin groups (chi-square=0.391, df=3, p=0.942).
ECG delay was 19.0±146.0 min and there were significant differences between origin groups (chi-square=78.3, df=3, p<0.001). EFRs demonstrated a significant difference compared to the PCI center, PCPs and non-PCI centers (z=181.2, p<0.001; z=212.3, p<0.001; and z=290.0, p<0.001, respectively), indicating that there was significantly greater ECG delay in the PCI center, PCPs and non-PCI centers than in EFRs (21.0 min, 21.0 min and 28.0 min, respectively vs. 10.0 min). There was also a significant difference between the PCI center and non-PCI centers (z=105.8, p=0.020), indicating that non-PCI centers had significantly greater ECG delays than the PCI center. No significant differences were found between PCPs and non-PCI centers (z=77.7, p=0.122) or the PCI center and PCPs (z=28.1, p=1.000).
The median logistic delay associated with patient transfer was 15.5±46.3 min. There were significant differences between origin groups (chi-square=36.2, df=2, p<0.001), including EFRs compared to PCPs and non-PCI centers (z=42.5, p=0.028; z=89.2, p<0.001), indicating that logistic delays were significantly longer for PCPs and non-PCI centers compared to EFRs (11.5 and 35.0 min, respectively, vs. 5.0 min). There was also a significant difference between PCPs and non-PCI centers (z=46.7, p=0.003), indicating that PCPs were associated with a significantly shorter logistic delay than non-PCI centers.
Over the period between 2013 and 2022, there were no significant differences in STEMI diagnosis to wire-crossing time (chi-square=12.9, df=9, p=0.169). Regarding origin groups, no statistical difference over the years was found in the EFR group (chi-square=8.367, df=9, p=0.498), but there were significant differences over the years in all of the other groups (PCPs: chi-square=29.7, df=9, p<0.001; non-PCI centers: chi-square=32.9, df=9, p=<0.001; PCI center: chi-square=33.0, df=9, p<0.001). These results are represented schematically in Figure 2.
DiscussionOur study showed that there are differences in achieving target times defined by the current state-of-the-art, depending on the place of origin. We found that patients from non-PCI centers experience the worst delays in terms of FMC to diagnosis and diagnosis to wire. Looking beyond the guidelines, we report significant delays across all groups in ECG acquisition and STEMI diagnosis, which are more marked in non-PCI centers, in which logistic delay (in transferring the patient after diagnosis) is also significantly greater than in the other groups. These findings may illustrate some of the factors that play a role in non-PCI centers only meeting the diagnosis to wire target of 90 min in 29.4% of cases.
Considering data from the EURObservational Research program and quality indicators,3 we find that our results are in line with those reported previously. Unfortunately, we cannot conclude that there was a significant improvement in STEMI care from 2013 to 2022 (p=0.169), despite a clear trend being visible on analysis of Figure 2, especially regarding the PCI center.
There are, however, some limitations in our study that should be mentioned. Firstly, intervention team activation time was used as a surrogate for diagnosis. This would have had a negative impact on diagnostic delay and FMC to diagnosis time related to the chain of contacts until the intervention team is activated, which may have led to a slight overestimation of this delay. In addition, our study only portrays the response for our region of Portugal, which of course could constitute selection bias. However, this portrays the time and resource constraints of a PCI center that covers an area of approximately 22000 km2.4
ConclusionOur study highlights areas in which more work needs to be done, such as ECG acquisition, STEMI diagnosis and logistic pathways to minimize transfer delays, and awareness in the population needs to be raised in order to reduce delay in seeking medical help. We hope to implement measures based on our data working with local authorities to improve quality of care. Moreover, we intend to repeat this audit in the future to evaluate our performance, and hope to encourage other centers to work toward the same goal.
FundingNo funding was provided.
Conflicts of interestThe authors have no conflicts of interest to declare.
The authors would like to acknowledge all the essential help provided by the team in our center's interventional unit.
