


Aerobic exercise intensity prescription is critical for the efficacy and safety of heart failure (HF) patients’ rehabilitation programs. This study aims to compare some of the commonly used parameters for range-based exercise intensity prescription, with a ventilatory threshold-based approach.
MethodsWe retrospectively analyzed data from 163 HF patients across a left ventricle ejection fraction (LVEF) spectrum who underwent maximal cardiopulmonary exercise testing (CPET). We measured percentages of peak oxygen uptake (VO2), peak heart rate (HR) and heart rate reserve (HRR) at the first ventilatory threshold (VT1). We compared the classification within the different exercise intensity (EI) domains defined by the current guidelines.
ResultsVT1 was observed at 82±10% of peak HR, 54±25% of HRR and 54±17% of peak VO2, corresponding to the high intensity for % Peak HR, and moderate intensity domain for %HRR and % Peak VO2. Using % Peak VO2, 65% of the patients were accurately classified within the correct EI domain (moderate intensity) at VT1; however, this percentage dropped to 46% when employing %HRR and to 25% when using % Peak HR. The classification accuracy at VT1 was superior in patients with reduced LVEF and in those with higher exercise capacity.
ConclusionOur data show that EI will be misclassified in one out of three patients if guided by current guideline-recommended range-based parameters, which emphasizes the relevance of a ventilatory threshold-based approach to adequate exercise prescription in HF patients.
A adequada prescrição da intensidade do exercício aeróbico nos programas de reabilitação para doentes com insuficiência cardíaca (IC) é essencial para garantir a sua eficácia e segurança. O objetivo deste trabalho foi comparar alguns dos parâmetros frequentemente utilizados para a prescrição de exercício físico, baseados em intervalos de variáveis fisiológicas, com uma abordagem baseada nos limiares ventilatórios.
MétodosAnalisamos retrospetivamente os dados de 163 doentes com IC, incluindo todo o espectro da fração de ejeção (FE), submetidos a uma prova de esforço cardiopulmonar (PECP). As percentagens do consumo máximo de oxigénio (VO2), frequência cardíaca (FC) máxima e frequência cardíaca de reserva (FCR) foram obtidas no primeiro limiar ventilatório (VT1). Para cada parâmetro, comparamos a classificação nos diferentes graus de intensidade de exercício físico definidos pelas recomendações atuais.
ResultadosO VT1 foi observado a 82±10% da FC máxima, a 54±25% da FCR e a 54±17% do VO2 máximo, correspondendo a exercício de alta intensidade para %FC máxima, e moderada intensidade para %FCR e %VO2 máximo. Utilizando %VO2 máximo, 65% dos doentes seriam classificados no grau correto de intensidade (moderada) no VT1, mas este valor cai para 46% quando utilizada a %FCR e para 25% utilizando %FC máxima. Os doentes com FE reduzida e com melhor capacidade física, demonstraram classificações mais concordantes com a classificação baseada no limiar ventilatório.
ConclusãoOs nossos dados demonstram que a intensidade do exercício será inadequadamente classificada num terço dos doentes quando baseada nos intervalos das variáveis fisiológicas recomendadas. Estes resultados salientam a relevância de uma abordagem baseada nos limiares ventilatórios e na PECP para uma adequada prescrição de exercício nos doentes com IC.
Aerobic exercise training (ET) is a core component of cardiac rehabilitation and the treatment of patients with heart failure (HF) because it improves quality of life and reduces hospitalizations.1–4 Much like any drug dosage, the individualized prescription of ET intensity is essential to guarantee the safety of this nonpharmacological intervention and to ensure its efficacy.5,6 Although there is a wealth of data demonstrating the safety of exercise interventions in HF patients,7,8 strenuous exercise is associated with a higher risk of ventricular arrhythmias and sudden death.6,9–11 It is also linked to prothrombotic status mediated by platelet and thrombin activation.12 However, patients need to reach a certain intensity threshold to maximize their cardiovascular health benefits.13,14
The current definition of exercise intensity (EI) is quite variable, with several recommended variables and respective cut-off values used to demarcate different training zones: low, moderate, high, and very high.6,15,16 Usually, percentages of maximal physiological parameters are used to categorize these exercise intensity domains, such as % peak oxygen uptake (VO2) and % peak heart rate (HR). Another commonly used parameter is the heart rate reserve (HRR) and its corresponding percentages. The various cut-off values for these variables are presented as interchangeable in defining intensity domains.5,6,15,16 For instance, the patient is assumed to be exercising at a moderate intensity if they reach 40–69% of their HRR or peak VO2 or 55–74% of their peak HR. In addition, the correspondence between these indices and ventilatory thresholds (VT) assessed by cardiopulmonary exercise test (CPET) remains unclear in HF patients.13 The identification of VTs is based on a strong physiological understanding of the metabolic response to exercise and empirical data that show improved efficacy outcomes when this information guides ET prescription.14,17 This is particularly relevant in HF populations as they include high-risk patients for whom safety during ET is a sensible concern. In addition, HF patients are very heterogeneous in their exercise capacity and chronotropic response,5,15,18 which can potentially impact the accuracy of the currently recommended indices to prescribe EI.
ObjectiveWe aimed to study the consistency among the commonly used EI variables (% Peak VO2, % Peak HR and %HRR) in the classification of the different EI domains, and their correspondence to the first VT (VT1) in patients with HF.
MethodsPopulation and designThis retrospective observational study included patients with HF referred to the Cardiac Rehabilitation Unit of Unidade Local de Saúde de Santo António (Porto, Portugal) between January 2019 and June 2022. We included all patients with HF according to the criteria of the European Society of Cardiology (ESC) irrespective of left ventricle ejection fraction (LVEF).2 We excluded patients with paced rhythm at the time of exercise testing, except for the ones under cardiac-resynchronization therapy and in sinus rhythm; for these patients, atrial sensing and biventricular pacing had to be present during the exercise phase. Electronic health records were reviewed for clinical characteristics (including comorbidities, clinical presentation, medications, and echocardiographic data) and CPET report data. Our hospital Human Research Committee approved this retrospective chart review and waived the requirement for informed consent (Ref: 2021.187(154-DEFI/160-CE)).
Exercise assessmentsExercise capacity was evaluated through a maximal CPET testing on a treadmill (Medisoft, Model 870C). The testing protocol was chosen according to the patient's physical activity level (modified Naughton, Bruce, modified Bruce, or Gardner-Skinner). The CPET was conducted under medical supervision, with electrocardiography continually monitored throughout the protocol. Using a stationary metabolic cart system (Geratherm® Respiratory Ergostik, under BLUE CHERRY®), respiratory gas exchange measurements were obtained breath-by-breath and the average values were recorded every 30 seconds. Heart rate and blood pressure were recorded at regular intervals throughout the test. During CPET testing, patients were strongly encouraged to achieve maximum exercise capacity, and a respiratory exchange ratio >1.10. Maximum effort was considered when peak RER was equal or above 1.05. Peak VO2 was determined as the highest VO2 achieved during exercise. The VT1 was determined using the nadir of the VE/VO2 versus time. The second VT (VT2) was not systematically reported and therefore not considered for the analysis. The VTs were determined by a single observer. VO2 and HR were determined at VT1 as well as at 40%, 70% and 85% of peak VO2 (according to the training zones identified in the ESC guidelines).6 HRR was calculated as the difference between the peak and resting HR (obtained from the resting electrocardiogram) and expressed as %HRR at those exercise periods. We used the EI domains depicted in the ESC guidelines for comparison of the different EI indices. VT1 was considered to correspond to the moderate intensity domain.1,16,19
Statistical analysisStatistical analysis was performed using IBM SPSS Statistics, Version 27.0 (Armonk, NY: IBM Corp; 2020). In the descriptive analysis, normally distributed continuous variables were characterized using the mean and standard deviation (SD), whereas for non-normally distributed variables, median and interquartile range (IQR) were used. For group comparison, Chi-square test was used for categorical variables, and t-Student or Mann-Whitney U tests were used for continuous variables depending on distribution normality. For the whole study population, we compared the EI classification (ESC EI domains) according to the different physiological measures at VT1 and assessed the rate of correspondence to the moderate intensity domain. Consistency between % Peak HR and %HRR, and % Peak VO2 at 40%, 70% and 85% (i.e., the transition point to moderate, high and very high intensity according to the ESC guidelines6) was also assessed.
We conducted two subgroup analyses and stratified patients according to their LVEF in two groups: preserved (LVEF ≥50%) and reduced (LVEF <50%). The correspondence rates between the different EI measures at VT1 and the ESC exercise intensity domains were compared between these groups. A similar analysis was performed by dividing patients according to their physical fitness and overall exercise capacity in two groups defined by the median peak VO2. Four sensitivity analyses were performed excluding patients on atrial fibrillation at the time of CPET, patients who were not on beta-blockers, patients with peak RER <1.05 and <1.10; and including only the patients subject to the mostly used exercise protocol: modified Naughton. The significance level was set at 0.05 (two-tailed).
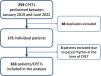
ResultsDemographic and clinical characteristicsOf a total of 259 CPETs performed during the study period on HF patients, 88 were excluded as they had been repeated on the same patients; eight other cases were excluded because the patients were on paced rhythm at the time of CPET. Therefore, 163 patients were included in the analysis (Figure 1). 105 (64%) were male and the mean age was 61±1 years. Regarding the HF phenotype, most of the patients, 107 (66%), had reduced LVEF, 28 (17%) had mildly reduced LVEF (41%≤LVEF≤49%) and 28 (17%) had preserved/recovered LVEF. Ischemic heart disease was the cause of HF in 62 (38%) patients. Mean LVEF was 36±12% and 71% of patients were in New York Heart Association (NYHA) Functional Class II. The main cardiovascular risk factors were dyslipidemia (66%) and hypertension (64%), and almost half of the population was diabetic (45%). A history of atrial fibrillation was present in 39 (24%) individuals, but only 10 (6%) had this rhythm at the time of CPET. Most patients were on beta-blockers (93%), 26 (16%) were on amiodarone and 9 (5.5%) on digoxin. Forty-one (25%) patients had implanted cardiac devices (pacemakers, cardiac-resynchronization therapy devices and implantable cardioverter-defibrillators). A detailed demographic and clinical characterization of the study population is displayed in Table 1.

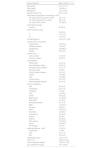
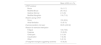
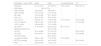
Clinical characteristics of the studied population (n=163).**
| General features | Mean (±SD) or n (%) |
|---|---|
| Age (years) | 61.1 (±11.0) |
| Sex (males) | 105 (64.4) |
| BMI (kg/m2) | 27.3 (±5.29) |
| Ejection fraction (%) | 36.2 (±12.4) |
| Heart failure classification according to LVEF | |
| HF preserved/recovered EF (≥50%) | 28 (17.2) |
| HF mildly reduced EF (41–49%) | 28 (17.2) |
| HF reduced EF (≤40%) | 107 (65.6) |
| Heart failure etiology | |
| Ischemic | 62 (38.0) |
| NYHA functional class | |
| I | 34 (20.9) |
| II | 116 (71.2) |
| III | 12 (7.40) |
| Pro-BNP (pg/mL)* | 415 [170–1163] |
| Cardiovascular risk factors | |
| Hypertension | 105 (64.4) |
| Diabetes mellitus | 73 (44.8) |
| Dyslipidemia | 108 (66.3) |
| Obesity | 46 (28.2) |
| Tobacco use | |
| Active smoker | 31 (19.0) |
| Previous smoker | 54 (33.1) |
| Comorbidities | |
| Previous MI | 44 (27.0) |
| Atrial fibrillation history | 39 (23.9) |
| Peripheral artery disease | 19 (11.7) |
| Previous stroke | 8 (4.90) |
| Chronic kidney disease | 24 (14.7) |
| COPD | 14 (8.60) |
| OSA | 14 (8.60) |
| Cancer history | 20 (12.3) |
| Musculoskeletal disease | 32 (19.6) |
| Chronic medication | |
| ASA | 66 (40.5) |
| Clopidogrel | 28 (17.2) |
| Ticagrelor | 7 (4.30) |
| VKA | 15 (9.20) |
| DOAC | 39 (23.9) |
| Beta-blocker | 151 (92.6) |
| ACEi/ARA | 76 (46.6) |
| Sacubitril/valsartan | 61 (37.4) |
| MRA | 118 (72.4) |
| Diuretics | 98 (60.1) |
| Statin | 125 (76.7) |
| Ezetimibe | 13 (8.00) |
| Amiodarone | 26 (16.0) |
| Digoxin | 9 (5.50) |
| SGLT2i | 96 (58.9) |
| OAD agents | 105 (64.4) |
| Insulin | 13 (8.00) |
| NIV therapy | 5 (3.10) |
| Implanted devices – total | 41 (25.2) |
| Pacemaker | 1 (0.60) |
| CRT | 18 (11.0) |
| ICD | 22 (13.5) |
| Hemoglobin (g/dL) | 14.2 (±1.67) |
| HbA1c (%)* | 5.90 [5.5–6.4] |
| Total cholesterol (mg/dL)* | 156 [131–195] |
| LDL cholesterol (mg/dL) | 87.7 (±33.9) |
ACEi: angiotensin converting enzyme inhibitor; ARA: angiotensin II receptor antagonist; ASA: acetylsalicylic acid; BMI: body mass index; COPD: chronic obstructive pulmonary disease; CRT: cardiac-resynchronization therapy; DOAC: direct oral anticoagulant; EF: ejection fraction; HbA1c: hemoglobin A1c; HF: heart failure; ICD: implantable cardioverter-defibrillator; LDL: low-density lipoprotein; LVEF: left ventricle ejection fraction; MI: myocardial infarction; MRA: mineralocorticoid receptor antagonist; NIV: non-invasive ventilation; NYHA: New York Heart Association; OAD: oral anti-diabetic; OSA: obstructive sleep apnea; Pro-BNP: pro-brain natriuretic peptide; SD: standard deviation; SGLT2i: sodium-glucose co-transporter 2 inhibitor; VKA: vitamin K antagonist.
In the 163 CPETs included in the analysis, the most common protocol was the modified Naughton in 116 (71%) patients, followed by modified Bruce in 25 (15%). Most of the patients were in sinus rhythm during the test (94%). Mean exercise duration was 09 min 25 s±03 min 32 s and mean RER was 1.06±0.12. The main reason to stop the test was fatigue, in 130 (79.8%) patients. Although perception of maximal exertion was documented for all patients, peak RER ≥1.05 was attained in 91 (56%) cases. Mean peak HR was 121±21 beats per minute (bpm) and mean peak VO2 was 18.3±5.4 mL/kg/min. Mean HRR was 47±18 bpm. At VT1, mean HR was 96±21 bpm and mean VO2 was 10.0±4.4 mL/kg/min (41.6±20.1% of predicted peak VO2). Detailed CPET data can be found in Tables 2 and 3.
Cardiopulmonary exercise testing protocols and characteristics (n=163).
| Mean (±SD) or n (%) | |
|---|---|
| CPET protocol | |
| Bruce | 19 (11.7) |
| Modified Bruce | 25 (15.3) |
| Gardner-Skinner | 2 (1.20) |
| Modified Naughton | 116 (71.2) |
| Rhythm during CPET | |
| Sinus | 153 (93.9) |
| Atrial fibrillation | 10 (6.10) |
| Exercise duration (min:sec) | 09:25 (±03:32) |
| Reason for exercise interruption | |
| Fatigue | 130 (79.8) |
| Dyspnea | 15 (9.20) |
| Chest pain | 2 (1.20) |
| Claudication | 7 (4.30) |
| Other | 5 (3.10) |
| ST-segment changes suggesting ischemia | 15 (9.20) |
CPET: cardiopulmonary exercise test; SD: standard deviation.
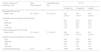
CPET data of the studied population (n=163).
| Parameter – mean (±SD) | Basal | Peak | % predicted peak | VT1 |
|---|---|---|---|---|
| HR (bpm) | 74.1 (±12.3) | 121 (±21.0) | 76.3 (±12.6) | 96.0 (±21.0) |
| HRR (bpm) | 46.9 (±17.9) | – | – | |
| SBP (mmHg) | 123 (±29.0) | 166 (±30.1) | – | – |
| DBP (mmHg) | 76.7 (±13.6) | 77.0 (±18.0) | – | – |
| BF (cpm) | 18.3 (±4.49) | 33.7 (±6.25) | – | – |
| SaO2 (%) | 96.0 (±2.00) | 95.0 (±3.00) | – | – |
| VO2 (L/min) | 0.29 (±0.11) | 1.38 (±0.48) | 74.1 (±19.5) | 0.76 (±0.36) |
| VO2 (mL/kg/min) | 3.80 (±1.20) | 18.3 (±5.38) | 10.0 (±4.39) | |
| VCO2 (L/min) | 0.24 (±0.06) | 1.47 (±0.58) | – | – |
| VE (L/min) | 11.0 (±3.00) | 55.4 (±18.2) | 68.1 (±17.0) | – |
| Breathing reserve (%) | – | 40.0 (±15.8) | – | – |
| VE/VO2 | 32.4 (±6.86) | 37.0 (±8.13) | – | 25.6 (±6.25) |
| VE/VCO2 | 38.9 (±6.61) | 35.0 (±6.82) | – | 32.0 (±6.55) |
| VE/VCO2 slope | – | 32.9 (±6.31) | – | – |
| O2 pulse (mL/beat) | 3.80 (±1.33) | 11.4 (±3.36) | 97.3 (±25.2) | – |
| PETCO2 (mmHg) | 30.0 (±5.00) | 34.0 (±6.00) | – | 30.0 (±6.00) |
| RER | 0.84 (±0.09) | 1.06 (±0.12) | – | – |
BF: breathing frequency; bpm: beats per minute; CPET: cardiopulmonary stress test; cpm: cycles per minute; DBP: diastolic blood pressure; FEV1: forced expiratory volume in 1 second; HR: heart rate; HRR: heart rate reserve; PETCO2: end-tidal CO2; RER: respiratory exchange ratio; SaO2: arterial blood oxygen saturation; SBP: systolic blood pressure; SD: standard deviation; VE: minute ventilation; VCO2: carbon dioxide production; VO2: oxygen uptake; VT1: first ventilatory threshold.
VT1 was observed at 82±10% of peak HR, corresponding to the ESC high intensity training zone. However, the same threshold was found at 54±25% of HRR and 54±17% of peak VO2, corresponding to the moderate intensity training zone (Table 4).
Correspondence of recommended indices of exercise intensity (%VO2max, %HRmax, %HRR) at VT1 with the ESC guidelines training zones (in gray).
| Patients’ response to exercise(n=163) | At VT1 | ||
|---|---|---|---|
| % Peak VO2 | % Peak HR | %HRR | |
| Mean (±SD) | 53.7 (±17.0) | 82.1 (±10.4) | 53.5 (±25.1) |
| Guidelines exercise intensity (% prevalence) | |||
| Low | 19.4 | 0.00 | 27.8 |
| Moderate | 65.0 | 25.2 | 46.2 |
| High | 12.5 | 49.0 | 12.7 |
| Very high | 3.10 | 25.8 | 13.3 |
ESC: European Society of Cardiology; HR: heart rate; HRR: heart rate reserve; SD: standard deviation; VO2: oxygen uptake; VT1: first ventilatory threshold.
Considering VT1 as the moderate intensity training zone, and using % Peak VO2, 65% of the patients were classified in the correct EI domain at VT1. % Peak HR was the parameter with the worst concordance (25%) because it tended to overestimate the EI by placing 75% of patients at a higher training zone at VT1. %HRR showed a better correspondence than % Peak HR but was worse than % Peak VO2, classifying 46% of patients appropriately (Table 4 and Figure 2).

Exercise intensity distribution at VT1 according to the different studied physiological parameters (% Peak VO2, % Peak HR, %HRR) and the ESC guidelines classification. ESC: European Society of Cardiology; HR: heart rate; HRR: heart rate reserve; VO2: oxygen uptake; VT1: first ventilatory threshold.
Considering the % Peak VO2 cut-offs listed in the ESC guidelines (40% as the transition point to moderate intensity, 70% to high intensity, and 85% to very high intensity) as the baseline measure of EI, its consistency with the other recommended indices is presented in Table 5. At 40% of peak VO2, consistency is high when using % Peak HR (74% of patients classified in moderate intensity exercise domain) but drops to 3.2% when using %HRR. Similar results are found at 70% of peak VO2, where 81% of patients are correctly classified in the high intensity domain according to % Peak HR but only 5.7% are assigned to this category according to the %HRR. In contrast, at 85% of peak VO2, consistency drops for % Peak HR (only 47% of patients adequately classified in the very high intensity domain), and %HRR consistency remains low (13%).
Internal consistency of recommended indices of exercise intensity according to the ESC guidelines training zones (in gray).
| Patients’ response to exercise(n=163) | At 40% peak VO2 | At 70% peak VO2 | At 85% peak VO2 | |||
|---|---|---|---|---|---|---|
| % Peak HR | %HRR | % Peak HR | %HRR | % Peak HR | %HRR | |
| Mean (±SD) | 68.5 (±10.0) | 18.8 (±17.0) | 81.3 (±6.40) | 50.4 (±12.8) | 89.8 (±5.49) | 73.9 (±14.0) |
| Guidelines exercise intensity (% prevalence) | ||||||
| Low | 3.20 | 96.8 | 0.00 | 16.4 | 0.00 | 1.30 |
| Moderate | 74.4 | 3.20 | 11.9 | 78.0 | 0.00 | 20.9 |
| High | 22.4 | 0.00 | 80.5 | 5.70 | 52.7 | 54.6 |
| Very high | 0.00 | 0.00 | 7.50 | 0.00 | 47.3 | 13.2 |
ESC: European Society of Cardiology; HR: heart rate; HRR: heart rate reserve; SD: standard deviation; VO2: oxygen uptake.
We divided our study population according to LVEF: 135 patients with reduced LVEF and 28 patients with preserved LVEF. Patients with preserved LVEF were older (65.0±13.3 vs. 60.3±10.4 years; p=0.043), had lower prevalence of males (43% vs. 69%; p=0.009) and had higher prevalence of atrial fibrillation history (50% vs. 19%; p<0.001) – Supplementary Table 1. There were no significant differences regarding maximal exercise capacity between HF subgroups (% predicted peak VO2; 73.5±19.4 vs. 77.3±19.9; p=0.351). Correspondence between the recommended indices of EI at VT1 with the moderate intensity domain was numerically superior for patients with reduced LVEF. Classification of patients according to % Peak VO2 had a 67% correspondence to the moderate intensity domain in reduced LVEF patients compared to 54% in preserved LVEF patients. There were also differences when other indices were used, such as % Peak HR: 26% correspondence in reduced LVEF group vs. 20% in the preserved LVEF group and according to %HRR: 49% in reduced LVEF group vs. 30% in the preserved LVEF group (Table 6).
Correspondence of recommended indices of exercise intensity (% Peak VO2, % Peak HR, %HRR) at VT1 with the ESC guidelines training zones (in gray) stratified by HF phenotype (reduced EF, LVEF <50%; preserved EF, LVEF ≥50%).
| Patients’ response to exercise(n=163) | Peak VO2(ml/kg/min) | % predicted peak VO2 | At VT1 | ||
|---|---|---|---|---|---|
| % Peak VO2 | % Peak HR | %HRR | |||
| Reduced LVEF (n=135) | |||||
| Mean (±SD) | 18.7 (±5.51) | 73.5 (±19.4) | 52.6 (±16.3) | 81.6 (±10.4) | 53.2 (±24.6) |
| Guidelines exercise intensity (% prevalence) | |||||
| Low | 19.4 | 0.00 | 25.8 | ||
| Moderate | 67.2 | 26.0 | 49.2 | ||
| High | 11.2 | 50.4 | 11.4 | ||
| Very high | 2.20 | 23.7 | 13.6 | ||
| Preserved/recovered LVEF (n=28) | |||||
| Mean (±SD) | 15.1 (±4.83) | 77.3 (±19.9) | 58.9 (±19.9) | 84.3 (±10.5) | 60.1 (±51.0) |
| Guidelines exercise intensity (% prevalence) | |||||
| Low | 19.2 | 0.00 | 38.5 | ||
| Moderate | 53.8 | 20.8 | 30.8 | ||
| High | 19.2 | 41.7 | 19.2 | ||
| Very high | 7.70 | 37.5 | 11.5 | ||
| p value between groups | 0.017 | 0.351 | 0.086 | 0.239 | 0.762 |
EF: ejection fraction; ESC: European Society of Cardiology; HF: heart failure; HR: heart rate; HRR: heart rate reserve; LVEF: left ventricle ejection fraction; SD: standard deviation; VO2: oxygen uptake; VT1: first ventilatory threshold.
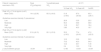
The other subgroup analysis performed considered overall physical fitness. HF patients were stratified into two groups according to median peak VO2 (17.4 mL/kg/min). In general, patients with higher exercise capacity (peak VO2 above the median) were younger (57.9±11.0 vs. 64.4±10.2 years; p<0.001), more likely to be male (73% vs. 56%; p=0.019), had higher prevalence of reduced LVEF (92% had LVEF <50% vs. 74% with LVEF ≥50%; p=0.019), had a lower baseline NT-pro-BNP (286±634 vs. 726±1721 pg/mL; p<0.001); history of atrial fibrillation (15% vs. 34%; p=0.004) and chronic kidney disease (6% vs. 24%; p=0.002) were less prevalent and hemoglobin concentration was higher (14.7±1.4 vs. 13.6±1.8 g/dL; p<0.001) – Supplementary Table 2. The correspondence of the recommended indices of EI at VT1 with the moderate intensity domain was superior for patients with higher exercise capacity. The classification of patients according to % Peak VO2 had 73% correspondence to the moderate intensity domain in patients with higher exercise capacity compared to 56% in the other group. The differences remained for the other indices, such as % Peak HR: 42% concordance in the higher exercise capacity group vs. 7% in the other group; and according to %HRR, 55% in the higher exercise capacity group vs. 37% in the other group (Table 7).
Correspondence of recommended indices of exercise intensity (% Peak VO2, % Peak HR, %HRR) at VT1 with the ESC guidelines training zones (in gray) stratified by exercise capacity (peak VO2 above median: ≥17.4 mL/kg/min vs. peak VO2 below median: <17.4 mL).
| Patients’ response to exercise(n=163) | Peak VO2(ml/kg/min) | % predicted peak VO2 | At VT1 | ||
|---|---|---|---|---|---|
| % Peak VO2 | % Peak HR | %HRR | |||
| Peak VO2<17.4 mL/kg/min (n=81) | |||||
| Mean (±SD) | 14.4 (±2.95) | 65.0 (±18.6) | 51.9 (±18.6) | 87.0 (±8.52) | 60.3 (±26.1) |
| Guidelines exercise intensity (% prevalence) | |||||
| Low | 26.9 | 0.00 | 25.0 | ||
| Moderate | 56.4 | 6.80 | 36.8 | ||
| High | 12.8 | 52.7 | 18.4 | ||
| Very high | 3.80 | 40.5 | 19.7 | ||
| Peak VO2≥17.4 mL/kg/min (n=82) | |||||
| Mean (±SD) | 21.8 (±6.15) | 83.1 (±15.9) | 55.0 (±19.5) | 77.4 (±9.91) | 47.0 (±22.3) |
| Guidelines exercise intensity (% prevalence) | |||||
| Low | 12.2 | 0.00 | 30.5 | ||
| Moderate | 73.2 | 42.0 | 54.9 | ||
| High | 12.2 | 45.7 | 7.30 | ||
| Very high | 2.4 | 12.3 | 7.30 | ||
| p value between groups | <0.001 | <0.001 | 0.180 | <0.001 | <0.001 |
ESC: European Society of Cardiology; HR: heart rate; HRR: heart rate reserve; LVEF: left ventricle ejection fraction; SD: standard deviation; VO2: oxygen uptake; VT1: first ventilatory threshold.
To assess possible bias due to certain population subgroups, four sensitivity analyses were performed. In the first test, we excluded patients with atrial fibrillation at the time of the CPET (10 patients). Then we performed the same analysis excluding patients not on beta-blockers (BB) (12 patients). Afterwards, we assessed the influence of underperforming patients on the results, excluding patients that attained a peak RER <1.05, and hence submaximal effort (72 patients), and excluding patients that did not attained a maximal effort, defined by peak RER <1.10 (60 patients). Finally, we performed sensitivity analysis only including patients subject to the most used exercise protocol: modified Naughton (116 patients). Correspondence of the recommended indices of EI at VT1 with the ESC guidelines training zones was not significantly different in these subgroups, despite patients with submaximal and maximal effort demonstrating slightly better concordance (Supplementary Tables 3–7).
DiscussionOur study shows that in at least one out of three patients with HF referred for cardiac rehabilitation, the EI would be misclassified by employing some of the frequently used intensity indices when compared to the gold standard VTs. The % Peak HR was worst performing parameter as it overestimated EI in 75% of patients, while % Peak VO2 was the parameter with the best correspondence to the threshold-based approach. %HRR was the non-CPET-obtainable parameter that showed better approximation, despite misclassifying half of the patients. The performance of these EI indices was worse in patients with HF with preserved ejection fraction (HFpEF) and in those with lower exercise capacity.
ET is a core component of the cardiac rehabilitation programs and should be prescribed according to the FITT model [frequency, intensity, time (duration), and type of exercise] in which to the correct setting of intensity is key.20 Our data show that at least 35% of the patients enrolled in a cardiac rehabilitation program will have an inadequate exercise prescription if VTs are not used to tailor intensity. If % Peak HR is used to guide EI prescription, one will overestimate the EI and prescribe lower-than-recommended intensity exercise to 75% of the patients, precluding them from attaining maximal benefits from ET. In contrast, using % Peak VO2 or %HRR, will lead us to under or overexercise 35–54% of our HF patients. Together, these data emphasize the need for using VT parameters to optimize the gains with ET in HF populations.
Our results are consistent with previous studies that enrolled mostly non-HF patients. In 2019 Hansen et al.15 studied a group of patients with cardiovascular disease who performed a maximal CPET on a cycloergometer. At the same level of effort (both VT1 and VT2), different physiologic parameters corresponded to different recommendation-based EI domains, prompting the authors to suggest the adjustment of the recommendations in place at the time.16 Furthermore, they also observed that in physically deconditioned patients (with lower absolute peak VO2) there was a greater discordance of the EI domains. Along these lines, following the 2020 ESC guidelines on sports cardiology and exercise in patients with cardiovascular disease,6 it was shown that when % Peak VO2 was used, a better correspondence between the VT1 and the moderate intensity domain was observed.19 When the HR parameters (% Peak HR and %HRR) were used, there was greater incongruity between VTs and EI domains. Our results are comparable with these previous reports: VT1 was attained at 53% of peak VO2 (62% in Hansen et al.15; 63% in Anselmi et al.19; 68% in Pymer et al.13), at 53% of HRR (42% Hansen et al.15; 46% in Pymer et al.13), and at 82% of peak HR (75% in Hansen et al.15 and in Anselmi et al.19; 72% in Pymer et al.13). Our study extends these results to a HF population as patients enrolled in these previous studies were mainly coronary artery disease patients.13,15,19
In addition, we provide further insight into HFpEF, an increasingly prevalent HF phenotype including complex multimorbid patients to whom cardiac rehabilitation is also recommended.2,6 In this subgroup of HF patients, we found a heightened discrepancy in the classification of EI at VT1 that should be considered when designing cardiac rehabilitation programs to optimize health gains.21
Current guidelines have based intensity ranges derived from heart rate parameters on data obtained for healthy individuals on beta-blockers.6,7 In our study, heart rate derived parameters had a poor performance, especially % Peak HR. In fact, it has been previously demonstrated that this parameter, along with %HRR, fail to properly classify EI in a large proportion of patients.15% Peak HR largely overestimates the EI in our population, which is concordant with reported data from patients with cardiac disease.19 This underperformance of peak HR in HF can be ascribed to the prevalent chronotropic incompetence that stands as one of the pathophysiological hallmarks of HF. Likewise, HRR is also greatly affected by chronotropic incompetence. The high prevalence of BB treatment (93%) in our population might further contribute to the observed discordance between heart rate-related parameters and VT1.
LimitationsOur study has several limitations that need to be acknowledged. First, the retrospective nature and the single-center design of the study limit the generalizability of our results to other patient groups. Besides, the usage of a treadmill exercise protocols might not be directly comparable to cycle-ergometer-based protocols described in other studies. However, contrasting with other European populations, our population is less familiar with cycling-based exercises and might preform worse on those protocols. Second, the low percentage of patients (17%) who had preserved LVEF in our cohort limits the external validity of our data regarding HFpEF; a larger sample will be needed to confirm the results of our sub-analysis. Third, there is a chance that the peak performance measures are underestimated in this cohort. The mean peak RER was 1.06, lower than in some of the previously cited studies.15,19 Also, only 56% of patients reached a peak RER ≥1.05 (and only 37% reached a peak RER ≥1.1), which suggests that a significant proportion of patients did not reach maximal effort. This fact can be partially explained by the clinical characteristics of the studied patients, which also included patients with respiratory, vascular and musculoskeletal comorbidities. Because of this proportion of patients not achieving a (near-) maximal effort during CPET, especially among those with HF and reduced ejection fraction, indices of peak exercise capacity are limited. Another factor hampering the utility of these indices is the influence of the ramp rate during the test at the work peak; a continuous incremental ramp protocol individualized for the functional capacity of each patient instead of a standard staged intermittent one as we used may have helped to achieve maximal effort in more patients. However, previous published data showed a sensitive prognosis assessment of peak VO2 in patients with HF in all RER subgroups.22 The overall results of our study were replicated after performing sensitivity analyses excluding the patients with a peak RER <1.05 and <1.10. Fourth, we did not analyze the VT2 as few patients had it reported. Finally, women are underrepresented in our cohort (36%), which limits the generalizability of our results to this population.
ConclusionThe present study shows the accuracy of EI prescription in HF patients across the LVEF spectrum based on a threshold-based approach, when compared to the other indices. Exercise aerobic training for HF patients must be prescribed only by the VTs method determined by a CPET, as recommended by the European Association of Preventive Cardiology's position statement, since the prescription using the “range-based” parameters will misclassify one in three patients.
CRediT authorship contribution statementStudy design: DSC, MIO, MS. Data collection: DSC, IL, MIO, CS, MS. Statistical analysis: DSC, MS. Writing of the manuscript: DSC, IL, MS. Revision and approval: DSC, MIO, CS, SM, FR, HD, MS.
FundingThis work was financially supported by the project POCI-01-0145-FEDER-030011, funded by FEDER, through COMPETE2020-POCI, and by national funds, through FCT/MCTES (PTDC/MEC-CAR/30011/2017) to Cristine Schmidt.
Conflicts of interestThe authors have no conflicts of interest to declare.
Data availabilityThe data underlying this article will be shared on reasonable request to the corresponding author.
The following are the supplementary data to this article:

