

Hypertension is one of the main risk factors for disability and death from cardiovascular disease. Current guidelines include initiatives to control blood pressure in hypertensive patients that focus on lifestyle changes. The main objective of this study was to analyze the association between lifestyle and blood pressure in patients under antihypertensive medication.
MethodsData collected in the Portuguese National Health Examination Survey (INSEF) were analyzed. Individuals who met INSEF inclusion criteria and reported being under antihypertensive medication in the two weeks prior to the questionnaire were studied. Lifestyle variables (alcohol consumption, smoking, added salt intake, fruit and vegetable consumption, and physical activity) were assessed by questionnaire, and systolic and diastolic blood pressure were measured by physical examination. Associations between lifestyle factors and blood pressure, stratified by gender and adjusted for sociodemographic variables and obesity, were estimated through a multiple linear regression model.
ResultsAlcohol consumption (beta=6.31, p=0.007) and smoking (beta=4.72, p=0.018) were positively associated with systolic blood pressure in men. Added salt intake, fruit and vegetable consumption, and physical activity were not associated with blood pressure in men. In women, no association was observed for any behavioral variable.
ConclusionsThese conclusions highlight the need in the population under antihypertensive medication, particularly in men, to focus on the fight against high systolic blood pressure in the two modifiable and preventable behaviors of smoking and alcohol consumption.
A hipertensão arterial é um dos principais fatores de risco para incapacidade e morte por doenças cardiovasculares. Orientações atuais de controlo da pressão arterial em indivíduos hipertensos focam-se em alterações do estilo de vida. O principal objetivo deste estudo foi estimar a associação entre o estilo de vida e a pressão arterial em indivíduos sob medicação anti-hipertensiva.
MétodosProcedeu-se a uma análise dos dados colhidos no Inquérito Nacional de Saúde com Exame Físico. Indivíduos que cumpriram os critérios de inclusão e que referiram encontrar-se sob medicação anti-hipertensiva foram estudados. Variáveis de estilo de vida (consumo de álcool, hábito tabágico, consumo adicional de sal, consumo de fruta e vegetais, prática de atividade física) foram medidas por questionário e os valores de pressão arterial foram obtidos por exame físico. Associações entre fatores do estilo de vida e pressão arterial, estratificadas para o sexo e ajustadas a variáveis sociodemográficas e obesidade, foram estimadas através de um modelo de regressão lineal múltipla.
ResultadosConsumo de álcool (b=6,31, p=0,007) e hábito tabágico (b=4,72, p=0,018) foram positivamente associadas à pressão arterial sistólica em homens. Consumo adicional de sal, consumo de fruta e vegetais e prática de atividade física não se encontraram associados à pressão arterial em homens. Em mulheres, nenhuma associação foi identificada para qualquer variável comportamental.
ConclusõesEstas conclusões reforçam a necessidade, também na população sob medicação anti-hipertensiva, particularmente no sexo masculino, de centrar o combate à pressão arterial sistólica nestes dois comportamentos modificáveis e preveníveis: hábito tabágico e consumo de álcool.
Hypertension is one of the main risk factors for disability and death from cardiovascular disease.1,2 Worldwide, hypertension affects around one billion people and is responsible for 7.5 million deaths a year.3 Hypertension accounted for more than half of global deaths and disability-adjusted life years for ischemic heart disease and cerebrovascular disease in 2016.4
In Portugal, in 2012, 42.2% of the population had hypertension, and of these, 55.6% had controlled hypertension.5 Similar prevalences were observed in 2003.6
Elevated blood pressure (BP) results from environmental and genetic factors and their interaction. The environmental factors involved in the etiology of hypertension include various dietary and lifestyle factors.7
Efforts to reduce the prevalence of hypertension focus on pharmacological and non-pharmacological approaches. Among non-pharmacological approaches, the guidelines recommend weight control, reduction of salt intake and alcohol consumption, physical activity, and a diet high in fruits, vegetables and low-fat dairy products and low in saturated and total fat.7 Smoking is also associated with the risk of hypertension and cessation is advised as part of hypertension control.8
The effects of lifestyle factors on BP levels in the general population are well studied. Although various goals and initiatives have been developed by public health services, globally and nationally, aimed at the behavioral determinants of health, prevalences of lifestyles that run counter to the guidelines remain high.9
Evidence suggests that the effect of lifestyle interventions on BP is more pronounced in hypertensive individuals.10 However, to the best of our knowledge, few data are available in Portugal in this field, particularly in hypertensive populations under pharmacological treatment.
The present study aims to analyze associations between lifestyle factors (added salt intake, fruit and vegetable consumption, alcohol consumption, smoking and physical activity) and BP in patients under antihypertensive medication in Portugal, adjusted for obesity and sociodemographic variables.
MethodsStudy settingThis study is based on data from the first Portuguese National Health Examination Survey (INSEF).11 INSEF was a cross-sectional population-based survey carried out in 2015 by the National Health Institute Doutor Ricardo Jorge (INSA) in partnership with the five Regional Health Administrations of mainland Portugal, the two Regional Health Secretariats of the autonomous island regions of the Azores and Madeira, and the Norwegian Institute of Public Health.
The INSEF target population included non-institutionalized individuals aged between 25 and 74 years, resident in Portugal and able to follow an interview in Portuguese. The INSEF sample (n=4911) was selected using a complex multistage probabilistic design. For each respondent, in addition to the physical examination (BP, height and weight), data on socioeconomic status, medication intake, lifestyles and healthcare use were collected through computer-assisted personal interview. Detailed descriptions of the methodology and procedures of sample selection, recruitment, interview and examination have been published elsewhere.11,12
INSEF was approved by the Ethics Committee of INSA and by the National Data Protection Authority.
For this study, analysis was restricted to the subsample of INSEF participants who reported using prescribed antihypertensive medication in the two weeks prior to the interview.
MeasurementsVariables were divided into outcome variables (systolic [SBP] and diastolic [DBP] blood pressure); lifestyle variables (added salt intake, fruit and vegetable consumption, level of physical activity, alcohol consumption and smoking); anthropometric variable (obesity); sociodemographic variables (gender, age group [25-44, 45-54, 55-64, 65-74 years], residential area [rural/urban], education level [none/elementary, middle school, high school, university], and income [quintile of equivalized household income according to the modified OECD scale]), and last consultation with a general practitioner in a health center [<12 months/≥12 months before the interview]).
BP was measured during a single examination with the subject in a seated position after 5 min rest. Three consecutive BP readings were obtained and the mean of the second and third readings of SBP and DBP was used.
Fruit and vegetable intake was assessed by the question “How often do you eat fruit/vegetables (excluding juice and potatoes)?” Individuals who reported eating fruit/vegetables less than four times a day were considered to have low consumption.
Added salt intake was measured by the question “How often do you add salt to your plate?” Individuals who reported adding salt to their plate “rarely”, “sometimes”, “usually” and “always” were considered to have added salt intake.
Levels of physical activity were measured by the question “Which of these situations best describes your leisure time activities during the last 12 months?” Individuals who answered “Reading, watching TV and other sedentary activities” were considered to be sedentary.
Alcohol consumption was measured by the question “Have you drunk any alcoholic beverage in the past 12 months?” Individuals who replied in the affirmative were considered to consume alcohol.
Smoking was measured by the question “Do you smoke?” Individuals who responded that they smoked “daily” or “occasionally” were considered to be smokers.
Participants were considered obese if their body mass index (BMI) calculated from measured weight and height was ≥30 kg/m2.
Statistical analysisThe study sample was characterized using descriptive statistics (means and standard deviations for continuous variables, counts and percentages for categorical variables).
For each gender, relationships between SBP and DBP, lifestyle and sociodemographic variables were assessed using linear regression models that provided regression coefficients (beta) and respective 95% confidence interval (CI). Additional adjustment for obesity was also performed.
Data were analyzed using IBM SPSS® Statistics software. The significance level for all analyses was set at 5%. Sampling weights were used in the data analysis to account for the complex sample design. More detailed information on INSEF sampling and sampling weights is provided elsewhere.12
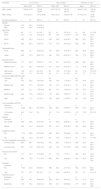
ResultsParticipants’ characteristics and dietary and lifestyle patterns are presented in Table 1. A total of 1277 participants met the inclusion criteria, 710 (54.3%) women and 567 (45.7%) men. Most of the population (74.7%) were aged 55 years or more. Mean SBP was 132.9 mmHg (95% CI 130.9-133.9) and mean DBP was 75.8 mmHg (95% CI 74.7-76.8). Mean SBP was higher in men (134.7 mmHg, 95% CI 133.26-136.15) than in women (130.53 mmHg, 95% CI 128.49-132.57), as was mean DBP (76.97 mmHg, 95% CI 76.05-77.90 in men; 74.74 mmHg, 95% CI 73.25-76.23 in women).
Characteristics of the study population.
| Variables | All (n=1277) | Men (n=567) | Women (n=710) | ||||||
|---|---|---|---|---|---|---|---|---|---|
| Mean (SD) | 95% CI | Mean (SD) | 95% CI | Mean | 95% CI | ||||
| SBP, mmHg | 132.44 (0.74) | 130.94-133.94 | 134.70 (0.71) | 133.26-136.15 | 130.53 (1.00) | 128.49-132.57 | |||
| DBP, mmHg | 75.76 (0.51) | 74.72-76.80 | 76.97 (0.47) | 76.05-77.90 | 74.74 (0.73) | 73.25-76.23 | |||
| Variables/categories | n | %a | 95% CI | n | %a | 95% CI | n | %a | 95% CI |
| Gender | |||||||||
| Women | 710 | 54.3 | 50.4-58.1 | ||||||
| Men | 567 | 45.7 | 41.9-49.6 | ||||||
| Age group | |||||||||
| 25-44 | 80 | 7.7 | 6.1-9.8 | 39 | 9.1 | 5.9-13.6 | 41 | 6.6 | 4.1-10.6 |
| 45-54 | 241 | 17.5 | 15.0-20.3 | 92 | 15.6 | 11.9-20.2 | 149 | 19.0 | 15.6-23.1 |
| 55-64 | 490 | 36.3 | 31.4-41.6 | 222 | 38.3 | 34.5-42.3 | 268 | 34.7 | 28.2-41.7 |
| 65-74 | 466 | 38.4 | 33.5-43.7 | 214 | 37.0 | 30.3-44.2 | 252 | 39.7 | 35.3-44.3 |
| Residential area | |||||||||
| Rural | 369 | 27.7 | 22.8-33.2 | 167 | 26.4 | 18.8-35.7 | 202 | 28.8 | 24.3-33.8 |
| Urban | 908 | 72.3 | 66.8-77.2 | 400 | 73.6 | 64.3-81.2 | 508 | 71.2 | 66.2-75.7 |
| Education level | |||||||||
| None/elementary | 711 | 54.0 | 50.3-57.7 | 313 | 51.1 | 45.0-57.2 | 398 | 56.5 | 52.5-60.5 |
| Middle school | 317 | 26.1 | 22.4-30.2 | 140 | 27.8 | 23.3-32.9 | 177 | 24.8 | 19.9-30.4 |
| High school | 148 | 12.4 | 9.2-16.5 | 80 | 13.8 | 10.1-18.6 | 68 | 11.2 | 7.8-15.9 |
| University | 101 | 7.4 | 5.0-10.9 | 34 | 7.3 | 4.1-13.0 | 67 | 7.5 | 5.1-10.7 |
| Income (modified OECD scale) | |||||||||
| Unknown | 86 | - | - | 30 | - | - | 56 | - | - |
| Low | 272 | 20.2 | 16.5-24.6 | 105 | 15.4 | 11.5-20.3 | 167 | 24.6 | 19.5-30.7 |
| Medium-low | 260 | 21.5 | 18.4-25.0 | 109 | 21.5 | 18.4-25.1 | 151 | 21.5 | 16.8-27.1 |
| Medium | 231 | 21.1 | 17.8-24.8 | 98 | 19.7 | 15.4-24.9 | 133 | 22.3 | 17.9-27.3 |
| Medium-high | 224 | 19.4 | 16.5-22.7 | 119 | 22.5 | 18.6-27.0 | 105 | 16.6 | 12.7-21.5 |
| High | 204 | 17.7 | 14.1-22.1 | 106 | 20.8 | 17.2-25.0 | 98 | 14.9 | 10.6-20.7 |
| Last consultation with GP | |||||||||
| Unknown | 6 | - | - | 3 | - | - | 3 | - | - |
| <12 months | 1029 | 85.2 | 80.7-88.8 | 443 | 82.2 | 76.5-86.7 | 586 | 87.8 | 82.4-91.7 |
| ≥12 months | 242 | 14.8 | 2.0 | 121 | 17.8 | 13.3-23.5 | 121 | 12.2 | 8.3-17.6 |
| Never | 0 | - | - | 0 | - | - | 0 | - | - |
| Obesity | |||||||||
| Unknown | 7 | - | - | 5 | - | - | 2 | - | - |
| Non-obese | 638 | 48.6 | 43.3-54.0 | 311 | 52.8 | 45.8-59.7 | 327 | 45.1 | 39.5-50.9 |
| Obese | 632 | 51.4 | 46.0-56.7 | 251 | 47.2 | 40.3-54.2 | 381 | 54.9 | 49.1-60.5 |
| Added salt intake | |||||||||
| No | 1119 | 86.8 | 81.5-90.8 | 484 | 83.4 | 76.8-88.5 | 635 | 89.7 | 84.4-93.3 |
| Yes | 158 | 13.2 | 9.2-18.5 | 83 | 16.6 | 11.5-23.2 | 75 | 10.3 | 6.7-15.6 |
| Fruit and vegetable consumption | |||||||||
| ≥4 times a day | 350 | 29.7 | 26.4-33.2 | 124 | 22.0 | 17.0-27.9 | 226 | 36.2 | 32.0-40.5 |
| <4 times a day | 927 | 70.3 | 66.8-73.6 | 443 | 78.0 | 72.1-83.0 | 484 | 63.8 | 59.5-68.0 |
| Alcohol consumption | |||||||||
| No | 317 | 24.7 | 21.0-28.9 | 61 | 10.9 | 7.7-15.1 | 256 | 36.4 | 30.0-43.3 |
| Yes | 960 | 75.3 | 71.1-79.0 | 506 | 89.1 | 84.9-92.3 | 454 | 63.6 | 56.7-70.0 |
| Smoking | |||||||||
| Unknown | 2 | - | - | - | - | - | 2 | - | - |
| No | 1138 | 90.2 | 86.4-93.1 | 486 | 87.2 | 81.7-91.2 | 652 | 92.8 | 88.4-95.6 |
| Yes | 137 | 9.8 | 6.9-13.6 | 81 | 12.8 | 8.8-18.3 | 56 | 7.2 | 4.4-11.6 |
| Physical activity | |||||||||
| Unknown | 10 | - | - | 4 | - | - | 6 | - | - |
| Active | 652 | 49.7 | 44.6-54.8 | 325 | 52.6 | 44.0-61.2 | 327 | 47.2 | 43.5-51.0 |
| Sedentary | 615 | 50.3 | 45.2-55.4 | 238 | 47.4 | 38.8-56.0 | 377 | 52.8 | 49.0-56.5 |
CI: confidence interval; DBP: diastolic blood pressure; GP: general practitioner; SBP: systolic blood pressure; SD: standard deviation.
Regarding lifestyle patterns among the study population, the prevalences of sedentary behavior (50.3%), alcohol consumption (75.3%), added salt intake (13.2%) and smoking (9.8%) were high, while consumption of fruit and vegetables was low (29.7%). Stratification by gender showed that 47.4% of men and 52.8% of women were sedentary, 89.1% of men and 63.6% of women had high alcohol consumption, 78.0% of men and 63.8% of women had low fruit and vegetable consumption, 16.6% of men and 10.3% of women reported high added salt intake and 12.8% of men and 7.2% of women were smokers.
More than half of the study population (51.4%) were obese (BMI ≥30 kg/m2) (47.2% of men and 54.9% of women).
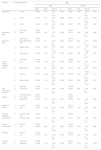
The gender-stratified associations between SBP and lifestyle factors are shown in Table 2. In men, a positive association between SBP and alcohol consumption (beta=3.36, p=0.007) was observed. In women, SBP was not significantly associated with any variable.
Associations between lifestyle factors and systolic blood pressure in men and women (n=1277).
| Variable | Values/categories | SBP | ||||||||
|---|---|---|---|---|---|---|---|---|---|---|
| Men | Women | |||||||||
| Mean | Beta | 95% CI | p | Mean | Beta | 95% CI | p | |||
| Age group | 1 | 25-44 | 136.04 | 1.36 | -4.82 to 7.55 | 0.657 | 128.61 | -3.84 | -14.09 to 6.41 | 0.452 |
| 2 | 45-54 | 134.74 | 0.07 | -7.65 to 7.78 | 0.986 | 130.57 | -1.89 | -7.03 to 3.25 | 0.460 | |
| 3 | 55-64 | 134.40 | -0.27 | -3.52 to 2.97 | 0.865 | 128.67 | -3.78 | -8.12 to 0.56 | 0.086 | |
| 4 | 65-74 (ref) | 134.67 | - | - | - | 132.45 | - | - | - | |
| Residential area | 0 | Rural | 138.33 | 4.93 | 1.75 to 8.12 | 0.003 | 130.10 | -0.61 | -3.58 to 2.37 | 0.682 |
| 1 | Urban (ref) | 133.40 | - | - | - | 130.70 | - | - | - | |
| Education level | 1 | None/elementary (ref) | 134.76 | 3.11 | -3.28 to 9.50 | 0.330 | 133.41 | 8.72 | -0.10 to 17.54 | 0.053 |
| 2 | Middle school | 135.32 | 3.68 | 3.73 to 11.08 | 0.320 | 127.46 | 2.77 | -7.15 to 12.69 | 0.574 | |
| 3 | High school | 134.90 | 3.25 | -3.47 to 9.97 | 0.332 | 126.63 | 1.94 | -4.34 to 8.22 | 0.535 | |
| 4 | University | 131.64 | - | - | - | 124.69 | - | - | - | |
| Income (OECD modified scale) | 1 | Low | 135.26 | -0.24 | -8.99 to 8.51 | 0.956 | 133.36 | 8.12 | 2.08 to 14.16 | 0.010 |
| 2 | Medium-low | 135.81 | 0.31 | -6.86 to 7.48 | 0.931 | 133.13 | 7.88 | 2.06 to 13.69 | 0.009 | |
| 3 | Medium | 131.27 | -4.23 | -10.12 to 1.65 | 0.153 | 128.79 | 3.55 | -1.69 to 8.78 | 0.178 | |
| 4 | Medium-high | 135.29 | -0.21 | -5.50 to 5.09 | 0.938 | 129.80 | 4.55 | -2.54 to 11.64 | 0.201 | |
| 5 | High (ref) | 135.50 | - | - | - | 125.35 | - | - | - | |
| Last consultation with GP | 0 | <12 months | 134.39 | -1.31 | -6.45 to 3.84 | 0.609 | 130.95 | 2.68 | -4.45 to 9.81 | 0.451 |
| 1 | ≥12 months (ref) | 135.70 | - | - | - | 128.28 | - | - | - | |
| Obesity | 0 | Non-obese | 133.75 | - | - | - | 127.94 | - | - | - |
| 1 | Obese (ref) | 135.48 | 1.73 | -3.82 to 7.29 | 0.531 | 132.63 | 4.70 | -0.06 to 9.45 | 0.053 | |
| Added salt intake | 0 | No (ref) | 135.04 | - | - | - | 130.72 | - | - | - |
| 1 | Yes | 133.02 | -2.02 | -8.79 to 4.74 | 0.548 | 128.87 | -1.85 | -5.81 to 2.12 | 0.351 | |
| Fruit and vegetable consumption | 0 | ≥4 times a day (ref) | 133.60 | - | - | - | 129.50 | - | - | - |
| 1 | <4 times a day | 135.01 | 1.41 | -2.23 to 5.05 | 0.437 | 131.11 | 1.62 | -1.88 to 5.11 | 0.354 | |
| Alcohol consumption | 0 | No (ref) | 129.03 | - | - | - | 130.55 | - | - | - |
| 1 | Yes | 135.39 | 6.36 | 1.83 to 10.90 | 0.007 | 130.52 | -0.03 | -2.75 to 2.68 | 0.981 | |
| Smoking | 0 | No (ref) | 134.26 | - | - | - | 130.76 | - | - | - |
| 1 | Yes | 137.74 | 3.48 | -0.28 to 7.24 | 0.069 | 127.54 | -3.22 | -7.38 to 0.94 | 0.125 | |
| Physical activity | 0 | Active (ref) | 134.92 | - | - | - | 130.91 | - | - | - |
| 1 | Sedentary | 134.48 | -0.43 | -3.62 to 2.75 | 0.783 | 130.21 | -0.70 | -4.77 to 3.37 | 0.729 | |
CI: confidence interval; Beta: regression coefficient; ref: reference; SBP: systolic blood pressure.
The relationships with DBP are not reported because the results were similar to the associations found for SBP (Supplementary Table 1). Furthermore, SBP is the most important BP parameter associated with hypertension complications.13
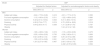
The results of multiple linear regression analysis are shown in Table 3. Stratification by gender and adjustment for sociodemographic variables showed a significant positive association between SBP and alcohol consumption (beta=6.43, p=0.003) and smoking (beta=4.26, p=0.019) in men, but there was no association in the remaining behavioral variables. In women, no significant associations were identified for any of the variables under study.
Multivariate association between lifestyle factors and systolic blood pressure in men and women, adjusted for lifestyle factors and for sociodemographic factors and obesity (n=1277).
| Model | SBP | |||
|---|---|---|---|---|
| Adjusted for lifestyle factors | Adjusted for sociodemographic factors and obesity | |||
| Beta (95% CI) | p | Beta (95% CI) | p | |
| Men | ||||
| Added salt intake | -2.24 (-7.75 to 3.28) | 0.416 | -2.31 (-7.77 to 3.15) | 0.395 |
| Fruit and vegetable consumption | -1.13 (-4.60 to 2.33) | 0.511 | -1.22 (-4.88 to 2.43) | 0.680 |
| Alcohol consumption | 6.43 (2.31 to 10.54) | 0.003 | 6.31 (1.88 to 10.74) | 0.007 |
| Smoking | 4.26 (0.74 to 7.77) | 0.019 | 4.72 (-0.85 to -8.60) | 0.018 |
| Physical activity | 0.94 (2.30 to 4.17) | 0.558 | 1.31 (-2.08 to 4.70) | 0.787 |
| Obesity | 1.64 (-4.14 to 7.42) | 0.568 | ||
| Women | ||||
| Added salt intake | -1.65 (-4.96 to 1.66) | 0.319 | -1.15 (-4.39 to 2.09) | 0.475 |
| Fruit and vegetable consumption | -0.55 (-4.04 to 2.93) | 0.750 | -0.36 (-3.82 to 3.11) | 0.836 |
| Alcohol consumption | 0.52 (-2.98 to 3.12) | 0.687 | 0.25 (-2.19 to 2.68) | 0.839 |
| Smoking | -1.33 (-6.31 to 3.65) | 0.591 | -0.47 (-4.72 to 3.79) | 0.826 |
| Physical activity | 1.29 (-2.27 to 4.85) | 0.467 | 2.08 (-1.60 to 5.75) | 0.259 |
| Obesity | 4.432 (-0.79 to 9.65) | 0.094 | ||
CI: confidence interval; Beta: regression coefficient.
An additional multivariate model was established for both sexes by adding obesity, but this did not change the previously found associations.
In men, the positive association between SBP and alcohol consumption (beta=6.31, p=0.007) and smoking (beta=4.72, p=0.018) remained, regardless of obesity. SBP was 6.3 mmHg higher in those who consumed alcohol (p=0.007) compared to non-consumers and was 4.7 mmHg higher in smokers (p=0.018) compared to non-smokers. In women, no such association was found.
DiscussionAlcohol consumption and smoking were significantly associated with SBP in men, but not in women. Added salt intake, fruit and vegetable consumption, and level of physical activity were not associated with SBP values in men or women.
The results of the bivariate analysis are in line with the evidence regarding the existence of associations between elevated SBP values and alcohol consumption and obesity.14,15
Stratification by gender and adjustment for behavioral variables and sociodemographic variables are discussed below.
Alcohol consumptionAfter adjustment for sociodemographic variables, alcohol consumption maintained a significant association with SBP, but only in men. In women, there was no statistically significant association after adjustment. These results are in line with the evidence.14 However, a meta-analysis showed differences between the sexes in terms of the effect of alcohol consumption on BP: while in men, higher consumption was associated with an increased risk of hypertension, in women light consumption was protective.16 The explanation for the apparent inverse relationship between mild to moderate alcohol consumption and the risk of hypertension seems to lie in plasma high-density lipoprotein (HDL) concentrations,17 since women physiologically have higher HDL concentrations than men.18 However, despite this difference between the sexes, it has been suggested that there are in fact differences in patterns of drinking and type of beverage, not measured in this study, that explain the observed differences in BP between men and women.19
SmokingThe association between smoking and SBP was statistically significant in our analysis, but not in women. Several studies have suggested that BP is increased in smokers but, paradoxically, other studies have concluded that smokers have lower BP than non-smokers. The results obtained for men in our study, with higher BP values in smokers than in non-smokers and significantly so for SBP, are in line with published studies.20 In women, there were no statistically significant associations between SBP values and smoking, a similar result to that observed in a 2001 study.21
Fruit and vegetable consumptionFruit and vegetable consumption lost its statistical association with SBP after adjustment, in both men and women, in contrast to the findings of published studies.22 Some research suggests that differences between fruit and vegetable types and how the foods themselves are prepared, leading to differences in the final concentration of compounds (fibers and flavonoids) and consequently in their effect on BP, could explain the lack of association between fruit and vegetable consumption and BP values.23 Unfortunately, the present study was not able to measure these differences.
Added salt intakeAdded salt intake was not associated with SBP in men or women. Although studies have reported a positive association between salt intake and increased BP,24,25 our results are in line with recent studies that found no association between them.5,22 The explanation may lie in the individual biological variability of salt sensitivity, as BP is salt-sensitive in some individuals and not in others,26 or in a parallel mechanism of sodium regulation that depends on the non-osmotic accumulation of sodium in the interstitial space.27 Another explanation may be that added salt, as measured in this study, represents a small proportion of the total dietary salt intake in the population; in fact, in Western societies, 75% of daily dietary salt intake comes from processed foods.28 So measuring this type of intake may underestimate total salt intake.
Physical activityLevels of physical activity were not associated with SBP in either men or women after adjustment. Numerous epidemiological studies have demonstrated the antihypertensive effects of exercise.29,30 The results of our study, which conflict with this evidence, can be explained by differences in types of physical activity, which vary in frequency, intensity and duration, that the present study was not able to measure.
ObesitySedentary behavior, low consumption of fruit and vegetables, high consumption of salt and alcohol, and smoking are associated with obesity,31 and this condition is known to be an important mediator of the effect of lifestyle on BP levels. However, in the present study, adjustment for obesity did not alter the associations found, with a significant positive association between SBP and alcohol consumption and smoking being found. In women, no association reached statistical significance.
Strengths and limitationsThe main strength of this study is its investigation of the association between BP, measured using a standardized protocol, and lifestyle factors, measured through a validated questionnaire, in a population of Portuguese adults who reported taking antihypertensive medication, enabling this association to be adjusted for sociodemographic variables and obesity.
The differences in the distribution of the sample in relation to the target population were minimized by the use of sampling weights for age, gender and region of the country.
The sample is representative of the national population, so the study findings can be generalized to the Portuguese population aged between 25 and 74 years.
Nevertheless, there are some limitations. There may be selection bias, since the hypertensive individuals who agreed to participate in the study may be different from those who refused to do so. We attempted to minimize this bias by characterizing non-participants through the application of a questionnaire, which made it possible to conclude that the use of self-reported antihypertensive medication was similar in the two groups (25.0% in participants and 26.0% in non-participants) for the total population studied in INSEF, so the effect of this bias may be small (Supplementary Table 2).
There may also be measurement bias related to the type of questions used to measure behaviors. Alcohol consumption was measured through a question about alcohol consumption in the previous 12 months, without questioning the frequency of consumption. The question used to measure the frequency of consumption of fruit and vegetables in the population did not specify the type of fruit and vegetables consumed or the form of preparation and consumption. Also, the question about the frequency of salt added to prepared dishes did not provide information on the baseline amount of salt used in the preparation of food.
Another limitation of the study concerns the lack of additional information – number, type and dose – on the antihypertensive medication that the participants reported taking. The effectiveness of the different classes of antihypertensive drugs and whether they are used in monotherapy or combined therapy affect therapeutic adherence and hence BP levels.32
ConclusionThe most important result of the study is that, of all the behavioral lifestyle factors most frequently described in the literature as associated with elevated BP, alcohol consumption and smoking are those associated with SBP levels in medicated hypertensive men, whether or not they are obese.
The significant positive associations found and the high prevalence of these behaviors in the hypertensive population highlight the need for public health strategies aimed at the population under antihypertensive medication that focus on the fight against high BP in the two modifiable and preventable behaviors of alcohol consumption and smoking.
Future research in this area should design follow-up periods that will enable causal links between lifestyle and BP levels to be determined. The limitations of this study should also be borne in mind, particularly those related to the issues of measuring frequency of alcohol and salt intake and to the lack of knowledge of the number and type of antihypertensive drugs used by hypertensive individuals.
FundingIn this study, a secondary analysis of data collected by INSEF was conducted. INSEF was developed as part of a predefined project of the Public Health Initiatives Program, “Improvement of epidemiological health information to support public health decision and management in Portugal. Towards reduced inequalities, improved health, and bilateral cooperation”, which received a €1 500 000 grant from Iceland, Liechtenstein and Norway through the EEA Grants.
Conflicts of interestsThe authors have no conflicts of interest to declare.
The authors would like to thank the INSEF group and all those involved in the INSEF fieldwork.
The following are the supplementary material to this article:

