


Smoking patterns inform tobacco control policies. This study aimed to assess trends in smoking prevalence and associated socioeconomic factors in Portugal between 1987 and 2014.
MethodsWe used data from National Health Interview Surveys (NHIS) conducted in 1987, 1995/96, 1998/99, 2005/06 and 2014/15. For each NHIS, we estimated gender-specific and age-standardized smoking prevalences, stratified by education, occupation, marital status and region. We constructed NHIS- and gender-specific logistic regression models, adjusting for the above-mentioned variables. We describe changes in smoking prevalence and inequalities in associated socioeconomic factors between 1987 and 2014.
ResultsIn men, smoking prevalence (32.2% and 26.7%, respectively) and inequalities for all factors except for education decreased between 1987 and 2014. For women, inequalities decreased for region, age and occupation, and these changes occurred through increasing smoking prevalence in all groups. For marital status and education, inequalities were stable but smoking prevalence increased for all groups within these variables. In both sexes, the unemployed (adjusted odds ratio [aOR] 2014: men 2.33, women 2.76) and divorced (aOR 2014: men 2.12, women 3.18) consistently had the highest prevalences and aORs of smoking. For the first three NHIS higher aORs of smoking were observed among less-educated men and highly-educated women, while for the last two the higher odds were for the less-educated in both sexes.
ConclusionsSmoking trends among men showed decreasing prevalences and diminishing inequalities. For women, inequalities were stable but there was an overall increase in prevalence. The unemployed and divorced had the highest smoking prevalences in both sexes. Smoking prevention and cessation policies in Portugal should take into consideration inequalities, particularly among men, and increasing consumption among women.
Os padrões de consumo de tabaco informam as políticas de controlo do tabaco. O objetivo deste estudo foi avaliar as tendências na prevalência de tabagismo e fatores socioeconómicos associados em Portugal de 1987-2014.
MétodosForam analisados os dados dos Inquéritos Nacionais de Saúde (INS) de 1987, 1995/96, 1998/99, 2005/06 e 2014/15. Para cada, foram estimadas prevalências de tabagismo por sexo, padronizadas para a idade e estratificadas por educação, ocupação, estado civil e região. Para cada sexo e inquérito foram desenvolvidas regressões logísticas, ajustados para as variáveis mencionadas. A evolução da prevalência e desigualdades nos fatores socioeconómicos de 1987-2014 são descritas.
ResultadosPara os homens, a prevalência e desigualdades diminuíram de 32,2% para 26,7% e para todos os fatores exceto educação. Nas mulheres, as desigualdades por região, idade e ocupação diminuíram com aumento generalizado da prevalência. Para o estado civil e educação as desigualdades estabilizaram com aumento na prevalência em todos os grupos. Para ambos os sexos, desempregados (odds ratio ajustado – aOR 2014: homens-2,33; mulheres-2,76) e divorciados (aOR 2014: homens-2,12; mulheres-3,18) apresentaram persistentemente as maiores prevalências/aOR de consumo. Para os primeiros três inquéritos os maiores aOR foram nos homens com menos educação e mulheres mais instruídas, sendo nos últimos dois nos menos instruídos para ambos os sexos.
ConclusõesNos homens a tendência foi de diminuição da prevalência e de desigualdades. Nas mulheres, as desigualdades estabilizaram, com aumento generalizado na prevalência. Desempregados e divorciados permanecem com elevadas prevalências em ambos os sexos. As políticas de prevenção e cessação em Portugal devem considerar desigualdades, particularmente nos homens, e o consumo crescente entre as mulheres.
Smoking is a well-known risk factor for various types of cancer and respiratory and cardiovascular diseases.1,2 Mortality from communicable diseases can also be partially attributed to tobacco use, although with lower attributable fractions.3,4 Despite being recognized as an important cause of years of life lost, tobacco consumption remains high in developed countries and is increasing in developing countries.5,6 Worldwide, Europe has the highest prevalence of smoking (32%), while Africa has the lowest (10%).5,7 On the basis of 2004 data, the World Health Organization (WHO) estimated smoking-attributable mortality to be 16% in Europe and 10% in Portugal.6 The WHO also estimates that in 2030 smoking will be responsible for 8.3 million deaths worldwide.6
Thun et al.8 updated the four-stage model of the smoking epidemic developed by Lopez et al. in 1994.9 Both models highlight the lag between taking up smoking and smoking-attributed mortality and the differences in these timings between men and women, and the updated version enables a gender-specific description of this phenomenon. Besides known gender-specific patterns and evolution, tobacco use differs according to individual socioeconomic characteristics. Previous studies in different countries reported higher smoking prevalence in more deprived groups, such as the unemployed, divorced and less educated, with greater inequalities particularly in northern European countries.7,10–12 Several explanations have been put forward for these differences, including that more deprived individuals are more likely to start smoking and that more affluent individuals are more likely to quit. Bacigalupe et al. suggested that more affluent groups have better access to information that would make them less likely to start smoking and more likely to quit, that more deprived individuals have lower self-efficacy, which increases people's perceived barriers to quitting smoking, and that smoking might be a socially accepted way of dealing with difficulties associated with deprivation.13 Nevertheless, these differences are not observed equally in every region, and for southern European countries the prevalence of smoking in women was reported as still being higher in more educated groups.14
In Portugal, a previous study reviewing the prevalence of smoking in men and women showed that inequalities have increased for worse-off men but more affluent women were still more likely to smoke in 2005.15 Furthermore, it raised the hypothesis of a delayed epidemic in the country, as opposed to what has been observed in other countries. Since 2005, Portugal has made progress in fighting the smoking epidemic. The country has ratified the WHO's Framework on Tobacco Control and approved new legislation limiting smoking in enclosed public spaces.16 On the other hand, the country has suffered an economic recession, leading to high levels of unemployment, a known determinant of smoking.17 It is unclear what the final balance of these factors has been in terms of patterns of smoking. Knowledge of their effects is important for guiding selection of tobacco control policies in Portugal and for assessing how previously implemented measures may have disproportionally affected certain groups.
Instruments to measure and monitor smoking prevalence have been recommended by the WHO and EUROSTAT and are used in the Portuguese National Health Interview Surveys (NHIS).18 These surveys, conducted periodically over time, are an important source of information for monitoring smoking trends and other dimensions of tobacco use.19
A previous study described changes in socioeconomic inequalities among Portuguese smokers between 1987 and 2005.15 However, it only considered educational level and income, and so it is important to assess how other factors, such as marital status and region, influence smoking patterns. Furthermore, the study data are now over 10 years old, and thus more recent data are required to provide decision-makers with more up-to-date information.15 Since new data from a recently conducted NHIS (2014) are now available, such an assessment is now possible.20
This study thus aims to describe trends in daily tobacco consumption and to measure associated socioeconomic factors in the Portuguese population between 1987 and 2014.
MethodsData sourcesData on tobacco consumption from the five NHIS available to date (1987, 1998/99, 1995/96, 2005/06 and 2014) were used. The NHIS are observational, cross-sectional epidemiological surveys conducted periodically on samples designed to be representative of the Portuguese population at Nomenclature of Territorial Units for Statistics (NUTS) II regional level. Individual data on health status, health determinants and health care use are collected face-to-face using a structured questionnaire filled in during a personal interview.19,21
For the first three NHIS, sampling was based on family households in mainland Portugal and was representative at five NUTS II regional levels. For the last two NHIS,22 the sample was also based on family households but at national level (mainland Portugal and the island regions of Madeira and the Azores), and was thus representative at all seven regional levels. For all but the last NHIS, data were collected on all individuals in the household, by direct or proxy interview, while for the last NHIS, data were collected by direct interview on only one individual per household. For the last survey a subsample was interviewed using web interview, with the option of changing to the standard survey. In all NHIS, the sample was obtained through a multistage sampling procedure.19,21,22
Study population and definition of variablesThe analysis included individuals aged 15 years or over resident in mainland Portugal, to ensure comparability of data for all NHIS.
An individual was defined as a smoker if he/she reported daily smoking during the two weeks prior to data collection, except for the last NHIS, for which individuals who reported smoking at the current time were included (smokers were defined as those responding affirmatively to the question “Do you smoke?” and “daily” to the question “Do you smoke daily or occasionally?”). This definition was selected (daily smokers in the reference period) as for the first NHIS there was only information on daily smoking in the previous two weeks, and it was deemed necessary to use the same definition whenever possible as the aim was to assess existing trends and changes in the definition of smoking could bias such comparisons. For each gender, the data were stratified by age group (15-24 years, 25-34 years, 35-44 years, 45-54 years, 55-64 and ≥65 years), occupation and occupational category, educational level, marital status and mainland NUTS II region (North, Central, Lisbon and Tagus Valley, Alentejo and Algarve). Although income levels have also been described as an important socioeconomic variable in the context of tobacco consumption,15 it was not possible to access comparable data and it was therefore decided not to include this variable in our analysis. Education was recorded as completed levels of schooling and divided into four categories: no education (none), first level (four years’ schooling) and second level (six years), third level (eight years), secondary education, and higher education. To avoid collinearity, occupation and occupational category were merged into one variable (occupation). This variable included occupational groups (unemployed, retired, and other. The ‘other’ group referred to students, homemakers, and those unable or unwilling to work, such as individuals living from unearned income, or the disabled) and for employed individuals their occupational category (G1: most qualified to G4: least qualified) (Table 1).23
Classification of occupations.21
| Group | Occupations included |
|---|---|
| G1 | Managers, professionals and armed forces personnel |
| G2 | Technicians and related occupations |
| G3 | Skilled agricultural, forestry and fishery workers; craft workers and related trades; plant and machine operators and fitters |
| G4 | Unskilled workers (e.g. cleaners; unskilled workers in agriculture, livestock, fishing, forestry and industry; kitchen staff) |
For each NHIS, gender-specific and age-standardized smoking prevalences were estimated (direct method, standard European population, 1976), which were then stratified by educational level, occupation, marital status and region. For standardization, different age groups were considered depending on the variable. This was done to avoid categories containing no individuals (for example there were no widowed individuals in younger age groups) and thus to obtain more stable estimates. The number of age groups considered for each variable analyzed was progressively reduced until there were no levels of that variable with zero individuals. For region, groups at 10-year intervals and an over-65 group were considered. For marital status and occupation the age groups were 15-54 and ≥55 years, and for education 15-44, 45-54, and ≥55 years. We then constructed NHIS- and gender-specific stratified logistic regression models, adjusted for the above variables. For each factor and within each gender, changes in smoking prevalence and inequalities in the associated socioeconomic factors were described using adjusted odds ratios (aORs) observed between 1987 and 2014. All analyses were performed using RStudio version 0.99.489.
ResultsA total of 73 593 men and 82 928 women were included from all five surveys. Age-standardized smoking prevalences by NHIS and gender are presented in Figure 1. The results show that while smoking prevalence in men decreased over time, reaching a minimum in the 2014 NHIS (26.7%), for women the prevalence increased, reaching a maximum in 2014 (14.6%). Nevertheless, the changes in prevalence decelerated between 1995 and 1999, with no significant differences between men and women.

Stratified NHIS-specific age-standardized prevalences and adjusted odds ratios are depicted in Figure 2 (men) and Figure 3 (women). These results, with confidence intervals, are presented in Table 2 (prevalence, men), Table 3 (prevalence, women), Table 4 (aORs, men), and Table 5 (aORs, women).
 and adjusted odds ratios (B) for each of the characteristics studied and year of survey (men). LVT: Lisbon and Tagus Valley; R: reference group in the logistic regression models.")
 and adjusted odds ratios (B) for each of the characteristics studied and year of survey (women). R: reference group in the logistic regression models.")
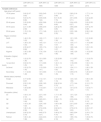
Prevalences and respective confidence intervals stratified by age groups and age-standardized prevalences and respective confidence intervals stratified by region, educational level, marital status, and occupation (men).
| Prevalences, % (95% CI) | |||||
|---|---|---|---|---|---|
| 1987 | 1995 | 1999 | 2005 | 2014 | |
| Variable | |||||
| Age group | |||||
| 15-24 years | 31.1 (29.5-32.7) | 26.8 (25.4-28.2) | 25.8 (24.3-27.2) | 25.3 (23.3-27.5) | 21.0 (17.6-24.9) |
| 25-34 years | 53.2 (51.1-55.2) | 48.8 (46.9-50.6) | 46.7 (44.9-48.6) | 39.4 (37.1-41.8) | 33.6 (29.8-37.6) |
| 35-44 years | 41.3 (39.3-43.4) | 41.8 (40.1-43.6) | 44.4 (42.7-46.2) | 40.2 (38.0-42.5) | 32.4 (29.6-35.3) |
| 45-54 years | 32.3 (30.5-34.2) | 31.6 (30.0-33.3) | 31.6 (30.0-33.3) | 32.0 (30.0-34.1) | 35.2 (32.2-38.2) |
| 55-64 years | 28.2 (26.4-30.0) | 21.2 (19.8-22.7) | 21.9 (20.4-23.5) | 20.3 (18.5-22.2) | 24.3 (21.7-27.0) |
| ≥65 years | 19.3 (17.8-20.8) | 13.2 (12.1-14.2) | 11.8 (10.9-12.8) | 9.8 (8.8-10.9) | 7.6 (6.5-9.0) |
| Region | |||||
| North | 36.1 (34.3-37.9) | 30.3 (28.9-31.9) | 30.1 (28.7-31.5) | 27.0 (24.9-29.2) | 24.4 (21.4-27.8) |
| Central | 27.7 (26-29.5) | 25.2 (23.6-26.9) | 25.7 (24.0-27.5) | 23.5 (21.5-25.8) | 23.9 (20.9-27.3) |
| LVT | 34.9 (33.1-36.7) | 32.5 (30.9-34.1) | 33.6 (32.0-35.3) | 28.6 (26.4-30.9) | 26.8 (23.6-30.4) |
| Alentejo | 46.8 (43.3-50.7) | 38.4 (35.8-41.1) | 35.2 (32.7-37.9) | 34.1 (31.6-36.8) | 29.5 (25.6-33.9) |
| Algarve | 41.8 (37.7-46.2) | 36.6 (33.8-39.5) | 35.9 (33.4-38.5) | 30.9 (28.7-33.3) | 28.4 (25.0-32.2) |
| Educational level | |||||
| None | 33.5 (30.1-37.4) | 30.0 (26.9-33.3) | 31.6 (28.0-35.5) | 30.3 (24.2-37.6) | 32.8 (20.4-50.9) |
| 1st and 2nd levels | 33.5 (32.4-34.7) | 32.8 (31.7-33.9) | 33.5 (32.4-34.7) | 32.8 (31.1-34.6) | 32.0 (28.6-35.9) |
| 3rd level | 35.8 (32.4-39.6) | 30.3 (28.3-32.5) | 30.4 (28.5-32.5) | 33.1 (30.5-35.9) | 31.3 (28.3-34.6) |
| Secondary | 39.1 (34.6-44.2) | 28.4 (25.0-32.5) | 30.4 (27.2-34.0) | 25.3 (22.8-28.1) | 25.7 (22.7-29.1) |
| Higher | 39.8 (33.5-47.0) | 32.1 (28.1-36.6) | 29.0 (25.1-33.4) | 23.0 (20.4-26.0) | 19.4 (16.4-22.8) |
| Marital status | |||||
| Married | 35.0 (33.9-36.2) | 31.1 (30.1-32.1) | 30.9 (29.9-32.0) | 26.9 (25.7-28.2) | 22.5 (20.6-24.4) |
| Single | 29.7 (27.2-32.4) | 28.6 (26.6-30.8) | 27.7 (25.8-29.9) | 28.6 (26.3-31.2) | 29.4 (26.5-32.6) |
| Divorced | 58.6 (48.0-70.8) | 48.1 (40.7-56.4) | 55.2 (47.7-63.7) | 40.5 (34.8-46.8) | 38.9 (33.6-44.8) |
| Widowed | 33.8 (23.2-48.0) | 27.6 (18.2-40.5) | 34.2 (23.1-49.0) | 35.2 (20.1-57.6) | 29.1 (13.8-54.5) |
| Occupation | |||||
| G1 | 41.4 (36.3-47.0) | 31.3 (27.5-35.6) | 29.5 (26.7-32.5) | 21.7 (19.3-24.4) | 19.4 (16.2-23.1) |
| G2 | 37.1 (34.8-39.6) | 34.1 (32.1-36.3) | 33.4 (31.1-35.7) | 31.9 (29.2-34.9) | 29.6 (25.6-34.2) |
| G3 | 32.6 (31.3-34.0) | 29.5 (28.0-31.0) | 31.6 (30.2-32.9) | 30.9 (29.2-32.8) | 31.1 (27.9-34.6) |
| G4 | 38.5 (31.7-47.0) | 35.7 (33.5-38.2) | 40.2 (36.4-44.3) | 34.2 (29.8-39.3) | 41.5 (32.5-52.7) |
| Unemployed | 53.0 (45.5-61.8) | 46.4 (42.1-51.0) | 45.5 (40.6-50.8) | 42.9 (38.1-48.2) | 40.2 (35.6-45.2) |
| Other | 26.9 (24.2-29.9) | 17.5 (15.4-19.9) | 20.6 (18.3-23.2) | 15.6 (12.8-19.3) | 19.1 (15.3-23.8) |
| Retired | 30.9 (25.7-36.8) | 29.3 (24.5-34.7) | 29.6 (24.7-35.2) | 24.4 (18.5-31.6) | 25.1 (14.9-39.9) |
aOR: adjusted odds ratio; CI: confidence interval; G1: managers, professionals and armed forces personnel; G2: technicians and related occupations; G3: skilled agricultural, forestry and fishery workers; craft and related trades workers; plant and machine operators and fitters; G4: unskilled workers; LVT: Lisbon and Tagus Valley.
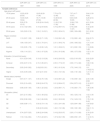
Prevalences and respective confidence intervals stratified by age groups and age-standardized prevalences and respective confidence intervals stratified by region, educational level, marital status, and occupation (women).
| Prevalences, % (95% CI) | |||||
|---|---|---|---|---|---|
| 1987 | 1995 | 1999 | 2005 | 2014 | |
| Variable | |||||
| Age group | |||||
| 15-24 years | 10.3 (9.3-11.4) | 10.4 (9.4-11.4) | 10.6 (9.6-11.7) | 12.7 (11.1-14.5) | 13.9 (11.1-17.2) |
| 25-34 years | 12.3 (11.0-13.8) | 17.2 (15.9-18.7) | 19.3 (17.9-20.8) | 17.0 (15.3-18.9) | 20.5 (17.5-23.7) |
| 35-44 years | 6.3 (5.4-7.3) | 11.2 (10.2-12.3) | 15.0 (13.8-16.3) | 19.9 (18.2-21.7) | 19.6 (17.5-22.0) |
| 45-54 years | 2.4 (1.9-3.1) | 4.1 (3.5-4.8) | 6.1 (5.3-7.0) | 10.3 (9.0-11.6) | 17.0 (14.9-19.3) |
| 55-64 years | 1.0 (0.7-1.5) | 1.1 (0.8-1.6) | 2.2 (1.8-2.8) | 3.2 (2.5-4.1) | 10.5 (8.9-12.3) |
| ≥65 years | 0.4 (0.2-0.7) | 0.6 (0.4-0.8) | 0.6 (0.4-0.9) | 0.6 (0.4-0.9) | 1.6 (1.2-2.2) |
| Region | |||||
| North | 4.4 (3.8-5.0) | 4.7 (4.1-5.3) | 6.5 (5.8-7.1) | 8.2 (7.1-9.5) | 11.3 (9.4-13.6) |
| Central | 3.6 (3.0-4.3) | 5.7 (4.9-6.5) | 6.0 (5.2-6.9) | 7.8 (6.6-9.2) | 12.3 (10.3-14.7) |
| LVT | 9.2 (8.4-10.2) | 12.8 (11.8-13.8) | 14.2 (13.2-15.4) | 16.0 (14.4-17.8) | 16.1 (13.9-18.5) |
| Alentejo | 5.3 (4.1-6.7) | 6.7 (5.6-8.0) | 9.9 (8.5-11.4) | 10.2 (8.8-11.9) | 14.8 (12.0-18.2) |
| Algarve | 7.4 (5.7-9.5) | 11.1 (9.5-12.8) | 13.7 (12.1-15.4) | 13.8 (12.3-15.5) | 18.8 (16.0-22.1) |
| Educational level | |||||
| None | 1.4 (0.7-2.6) | 1.6 (0.9-2.7) | 4.6 (3.1-6.5) | 4.9 (2.2-9.4) | 7.2 (2.0-19.8) |
| 1st and 2nd levels | 3.7 (3.3-4.1) | 5.7 (5.2-6.2) | 7.3 (6.7-7.9) | 9.5 (8.5-10.6) | 15.0 (12.2-18.3) |
| 3rd level | 12.8 (10.7-15.5) | 13.5 (12.1-15.2) | 14.8 (13.4-16.3) | 17.2 (15.3-19.3) | 17.8 (15.4-20.4) |
| Secondary | 15.8 (13.4-18.8) | 15.0 (12.8-17.8) | 16.5 (14.5-18.9) | 16.0 (13.9-18.4) | 19.0 (16.6-21.8) |
| Higher | 23.3 (17.9-30.5) | 20.4 (17.2-24.3) | 18.5 (15.4-22.4) | 14.0 (12.2-16.1) | 16.0 (13.9-18.4) |
| Marital status | |||||
| Married | 4.4 (4.0-4.8) | 6.3 (5.9-6.8) | 7.9 (7.4-8.4) | 9.3 (8.6-10.0) | 9.4 (8.3-10.6) |
| Single | 6.8 (6.0-7.6) | 7.9 (7.2-8.8) | 9.1 (8.3-10.0) | 10.8 (9.6-12.1) | 17.0 (15.1-19.1) |
| Divorced | 16.0 (12.3-20.4) | 18.4 (15.1-22.2) | 23.9 (20.5-27.7) | 22.7 (19.4-26.4) | 26.1 (22.5-30.2) |
| Widowed | 2.3 (1.1-4.2) | 4.5 (2.8-6.9) | 6.6 (4.4-9.5) | 9.4 (5.8-14.5) | 14.0 (8.7-21.5) |
| Occupation | |||||
| G1 | 18.3 (15.1-22.4) | 18.0 (14.9-22.1) | 15.6 (13.3-18.3) | 13.7 (11.5-16.4) | 18.0 (14.6-22.2) |
| G2 | 8.6 (7.7-9.7) | 10.2 (9.4-11.2) | 14.9 (13.6-16.3) | 15.4 (13.9-17.1) | 18.8 (16.4-21.6) |
| G3 | 1.9 (1.5-2.4) | 2.9 (2.4-3.6) | 5.7 (4.9-6.7) | 6.9 (5.4-8.5) | 7.1 (4.7-10.9) |
| G4 | a | 10.6 (7.3-18.5) | 6.8 (5.6-8.1) | 9.3 (7.6-11.2) | 14.3 (11.3-17.8) |
| Unemployed | 11.5 (8.7-16.8) | 12.0 (9.8-15.0) | 16.3 (13.6-19.8) | 15.3 (12.7-18.5) | 22.7 (19.6-26.3) |
| Other | 3.7 (3.2-4.2) | 4.7 (4.3-5.3) | 4.7 (4.2-5.3) | 6.7 (5.8-7.7) | 7.7 (6.1-9.6) |
| Retired | 2.0 (1.0-3.6) | 4.3 (2.6-6.6) | 5.0 (3.0-8.0) | 6.8 (3.6-11.7) | 13.6 (5.4-28.5) |
aOR: adjusted odds ratio; CI: confidence interval; G1: managers, professionals and armed forces personnel; G2: technicians and related occupations; G3: skilled agricultural, forestry and fishery workers; craft and related trades workers; plant and machine operators and fitters; G4: unskilled workers; LVT: Lisbon and Tagus Valley.
Adjusted odds ratios and respective confidence intervals for men in individual surveys.
| aOR (95% CI) | aOR (95% CI) | aOR (95% CI) | aOR (95% CI) | aOR (95% CI) | |
|---|---|---|---|---|---|
| 1987 | 1995 | 1999 | 2005 | 2014 | |
| Variable (reference) | |||||
| Age group (≥65 years) | |||||
| 15-24 years | 3.00 (2.47-3.65) | 3.00 (2.45-3.67) | 3.17 (2.58-3.90) | 2.83 (2.16-3.71) | 1.77 (1.14-2.75) |
| 25-34 years | 5.63 (4.75-6.66) | 6.06 (5.08-7.22) | 6.51 (5.45-7.79) | 4.51 (3.56-5.71) | 3.34 (2.28-4.89) |
| 35-44 years | 3.35 (2.85-3.94) | 4.56 (3.86-5.39) | 5.78 (4.88-6.85) | 5.04 (4.05-6.27) | 3.55 (2.52-5.00) |
| 45-54 years | 2.21 (1.89-2.58) | 2.88 (2.45-3.39) | 3.26 (2.76-3.85) | 3.66 (2.96-4.53) | 3.87 (2.78-5.39) |
| 55-64 years | 1.76 (1.53-2.04) | 1.71 (1.48-1.99) | 2.02 (1.73-2.35) | 2.05 (1.68-2.50) | 2.58 (1.92-3.47) |
| Region (Central) | |||||
| North | 1.48 (1.35-1.63) | 1.29 (1.17-1.42) | 1.26 (1.14-1.39) | 1.21 (1.05-1.39) | 1.01 (0.82-1.23) |
| LVT | 1.38 (1.25-1.53) | 1.45 (1.31-1.60) | 1.51 (1.37-1.67) | 1.35 (1.17-1.55) | 1.16 (0.96-1.41) |
| Alentejo | 2.35 (2.07-2.68) | 1.95 (1.74-2.19) | 1.66 (1.47-1.87) | 1.68 (1.46-1.92) | 1.23 (1.00-1.51) |
| Algarve | 1.95 (1.68-2.26) | 1.74 (1.54-1.97) | 1.65 (1.46-1.86) | 1.48 (1.29-1.69) | 1.16 (0.95-1.42) |
| Education (higher) | |||||
| None | 1.02 (0.76-1.36) | 1.01 (0.80-1.29) | 1.25 (0.99-1.57) | 1.11 (0.87-1.42) | 1.12 (0.76-1.64) |
| 1st and 2nd levels | 0.94 (0.72-1.25) | 1.11 (0.89-1.39) | 1.40 (1.14-1.72) | 1.18 (0.99-1.41) | 1.50 (1.16-1.93) |
| 3rd level | 1.05 (0.79-1.40) | 1.12 (0.90-1.41) | 1.34 (1.09-1.65) | 1.34 (1.11-1.61) | 1.80 (1.39-2.32) |
| Secondary | 1.11 (0.84-1.48) | 1.01 (0.80-1.28) | 1.17 (0.94-1.45) | 0.95 (0.79-1.15) | 1.25 (0.97-1.62) |
| Marital status (married) | |||||
| Single | 0.77 (0.68-0.87) | 1.12 (1.01-1.25) | 1.07 (0.96-1.19) | 1.40 (1.23-1.59) | 1.66 (1.39-1.97) |
| Divorced | 2.50 (1.83-3.42) | 2.08 (1.63-2.64) | 2.96 (2.34-3.73) | 1.77 (1.44-2.17) | 2.12 (1.72-2.61) |
| Widowed | 1.08 (0.88-1.34) | 1.13 (0.91-1.39) | 1.31 (1.05-1.62) | 1.01 (0.75-1.37) | 1.03 (0.71-1.51) |
| Occupation (other) | |||||
| G1 | 1.69 (1.34-2.12) | 2.37 (1.90-2.95) | 1.77 (1.48-2.12) | 1.57 (1.24-1.99) | 1.09 (0.77-1.53) |
| G2 | 1.59 (1.38-1.84) | 2.65 (2.31-3.06) | 1.98 (1.72-2.28) | 2.53 (2.06-3.12) | 1.57 (1.15-2.12) |
| G3 | 1.43 (1.26-1.62) | 2.24 (1.95-2.56) | 1.89 (1.66-2.15) | 2.51 (2.05-3.07) | 1.66 (1.23-2.23) |
| G4 | 1.86 (1.45-2.38) | 2.74 (2.38-3.16) | 2.62 (2.21-3.09) | 2.79 (2.19-3.55) | 2.49 (1.67-3.71) |
| Unemployed | 2.95 (2.33-3.73) | 4.49 (3.75-5.37) | 3.38 (2.79-4.10) | 3.85 (3.04-4.87) | 2.33 (1.73-3.14) |
| Retired | 1.66 (1.40-1.98) | 2.42 (2.03-2.89) | 1.83 (1.53-2.18) | 1.99 (1.54-2.57) | 1.09 (0.76-1.58) |
aOR: adjusted odds ratio; CI: confidence interval; G1: managers, professionals and armed forces personnel; G2: technicians and related occupations; G3: skilled agricultural, forestry and fishery workers; craft and related trades workers; plant and machine operators and fitters; G4: unskilled workers; LVT: Lisbon and Tagus Valley.
Adjusted odds ratios and respective confidence intervals for women in individual surveys.
| aOR (95% CI) | aOR (95% CI) | aOR (95% CI) | aOR (95% CI) | aOR (95% CI) | |
|---|---|---|---|---|---|
| 1987 | 1995 | 1999 | 2005 | 2014 | |
| Variable (reference) | |||||
| Age group (≥65 years) | |||||
| 15-24 years | 12.23 (6.35-23.55) | 10.63 (6.29-17.96) | 7.70 (4.75-12.48) | 7.37 (4.17-13.01) | 2.64 (1.50-4.65) |
| 25-34 years | 10.00 (5.25-19.04) | 16.71 (10.08-27.69) | 14.38 (9.03-22.90) | 9.30 (5.39-16.05) | 4.28 (2.54-7.21) |
| 35-44 years | 5.29 (2.78-10.10) | 9.95 (6.04-16.40) | 11.09 (7.00-17.56) | 12.84 (7.53-21.88) | 4.91 (2.99-8.06) |
| 45-54 years | 3.10 (1.62-5.90) | 4.19 (2.54-6.90) | 4.74 (2.99-7.51) | 6.76 (3.98-11.47) | 4.72 (2.90-7.68) |
| 55-64 years | 1.63 (0.83-3.19) | 1.93 (1.16-3.21) | 2.55 (1.62-4.01) | 2.88 (1.69-4.88) | 3.61 (2.32-5.61) |
| Region (Central) | |||||
| North | 1.10 (0.87-1.38) | 0.86 (0.71-1.05) | 1.19 (0.99-1.43) | 1.12 (0.89-1.40) | 0.94 (0.73-1.21) |
| LVT | 1.99 (1.60-2.47) | 2.02 (1.70-2.41) | 2.31 (1.94-2.74) | 2.06 (1.68-2.52) | 1.31 (1.04-1.65) |
| Alentejo | 1.30 (0.95-1.78) | 1.14 (0.90-1.45) | 1.61 (1.29-2.01) | 1.21 (0.96-1.53) | 1.13 (0.86-1.48) |
| Algarve | 1.59 (1.14-2.21) | 1.84 (1.47-2.29) | 2.34 (1.91-2.86) | 1.69 (1.37-2.09) | 1.52 (1.19-1.93) |
| Education (1st and 2nd levels) | |||||
| None | 0.31 (0.20-0.49) | 0.19 (0.12-0.28) | 0.40 (0.29-0.55) | 0.32 (0.19-0.55) | 0.50 (0.29-0.85) |
| 3rd level | 2.55 (2.07-3.13) | 2.15 (1.85-2.51) | 2.05 (1.77-2.37) | 2.06 (1.71-2.46) | 1.99 (1.56-2.53) |
| Secondary | 2.95 (2.40-3.62) | 2.43(2.03-2.91) | 1.90 (1.61-2.24) | 1.75 (1.44-2.12) | 1.81 (1.42;2.31) |
| Higher | 4.45 (3.05-6.48) | 2.67 (2.01-3.53 | 1.50 (1.16-1.94) | 1.48 (1.18-1.84) | 1.47 (1.10-1.95) |
| Marital status (married) | |||||
| Single | 0.87 (0.71-1.07) | 0.90 (0.76-1.08) | 1.04 (0.89-1.22) | 1.18 (0.98-1.42) | 2.30 (1.88-2.82) |
| Divorced | 3.03 (2.19-4.20) | 2.88 (2.24-3.70) | 3.31 (2.69-4.07) | 2.54 (2.07-3.12) | 3.18 (2.57-3.95) |
| Widowed | 0.98 (0.59-1.65) | 1.86 (1.32-2.62) | 1.24 (0.89-1.71) | 1.19 (0.80-1.77) | 1.36 (0.96-1.92) |
| Occupation (other) | |||||
| G1 | 2.87 (2.15-3.82) | 1.93 (1.48-2.52) | 2.37 (1.87-3.01) | 1.63 (1.25-2.14) | 1.52 (1.06-2.18) |
| G2 | 2.52 (2.08-3.06) | 1.94 (1.66-2.26) | 2.24 (1.92-2.62) | 1.74 (1.43-2.12) | 1.78 (1.32-2.40) |
| G3 | 0.89 (0.68-1.17) | 0.93 (0.73-1.19) | 1.53 (1.24-1.89) | 1.25 (0.94-1.68) | 1.00 (0.62-1.62) |
| G4 | a | 3.06 (2.03-4.62) | 1.49 (1.19-1.88) | 1.38 (1.06-1.80) | 1.62 (1.13-2.31) |
| Unemployed | 3.74 (2.67-5.25) | 2.86 (2.24-3.66) | 3.16 (2.52-3.97) | 2.20 (1.71-2.83) | 2.76 (2.05-3.73) |
| Retired | 1.72 (1.04-2.84) | 1.79 (1.22-2.61) | 1.37 (0.94-1.99) | 0.88 (0.56-1.37) | 1.12 (0.74-1.71) |
aOR: adjusted odds ratio; CI: confidence interval; G1: managers, professionals and armed forces personnel; G2: technicians and related occupations; G3: skilled agricultural, forestry and fishery workers; craft and related trades workers; plant and machine operators and fitters; G4: unskilled workers; LVT: Lisbon and Tagus Valley.
In men there was an overall decrease in smoking prevalence for the variables analyzed (Figure 2A). The overall decrease in prevalence, particularly in groups with higher prevalences at the beginning of the period analyzed, resulted in decreasing inequalities (Figure 2B). The exceptions to this pattern were men aged 45-64 and educational level, for which inequalities increased in the last NHIS. In particular, men aged 45-64 smoked more than in the previous surveys, an opposite trend to the other age groups. For education, men with secondary or higher education presented a decrease in prevalence, while for the other groups the prevalence was constant over time, resulting in an increase in inequalities. The unemployed (aOR 2014: 2.33 [95% CI: 1.73-3.14]) and divorced (aOR 2014: 2.12 [95% CI: 1.72-2.61]) consistently had the highest prevalences and aORs of smoking.
In women there has been an increasing convergence in prevalence for all groups (Figure 3A). These changes led to a decrease in inequalities for region, age and occupation (Figure 3B). For marital status inequalities were stable, but there has been an overall increase in smoking prevalence. Education showed different changes for different groups. While smoking prevalence among highly educated women decreased, smoking among less educated women became more frequent, particularly among those with first and second levels of basic education: the prevalence increased nearly five-fold from 3.7 (95% CI: 3.3-4.1) in 1987 to 15.0% (95% CI: 12.2-18.3) in 2014. The highest odds of smoking were now seen among those with the third level of basic education (1.99, 95% CI: 1.56-2.53). Similarly to men, the unemployed (aOR 2014: 2. 76 [95% CI: 2.05-3.73]) and divorced (aOR 2014: 3.18 [95% CI: 2.57-3.95]) consistently had the highest prevalence and aORs of smoking.
DiscussionWe performed a comprehensive analysis of social determinants of smoking in Portugal, over a period of almost 30 years (1987 to 2014). Our results show a reduction in smoking prevalence in men and an increase in women. Whereas the initial version of the tobacco epidemic model considered men and women together, the more recent version by Thun et al.8 argued for an update to the model that would analyze men and women separately. This appears to make sense for Portugal, where consumption among men is at a more advanced stage of the epidemic.
According to this model, Portugal is now at stage 3/4 for men and at stage 2 for women.8 This indicates that smoking among women may not yet have reached its peak. For planning purposes, it is important to be aware of this fact and to target women in cessation policies. An example is a campaign by the Portuguese Society of Pneumology that emphasizes some of the negative effects of smoking among women.24 Tobacco-related medical conditions are also expected to become more frequent among women than in the past.
Previous work by Alves et al.15 showed that inequalities increased for the worse-off but that better-off women were still more likely to smoke in 2005, suggesting a different path, in particular for women, from that usually observed in countries that have progressed further in the course of the smoking epidemic. Our more recent data show that inequalities have decreased for men. However, with regard to education there was a widening in inequalities, which were worse for the least educated. For women, our data suggest that the maximum prevalence for women might not have yet been reached. Looking in particular at education, it is also clear that smoking prevalence mainly increased in the less-educated and declined in the well-educated. On the other hand, this pattern was not observed with regard to occupation. When assessing inequalities by occupational group, women from more qualified groups (G1 and G2) had higher odds ratios of smoking. If the trend described here continues, the pattern reported for other countries is likely to be observed, with widening inequalities. However, overall, compared to other countries Portugal may have a delayed pattern.10,11,22 The results observed for education and occupational group thus raise concerns about widening inequalities in the near future among women and emphasize the need to implement equity-oriented interventions.9,22
Our work also considers further social determinants, consistently highlighting vulnerable groups. In particular, divorced and unemployed men and women were more likely to smoke. These results are similar to those of studies in other countries, and may be related to stress arising from important life events.10,11,22 However, it is less clear how these vulnerabilities should be addressed. For the unemployed, one suggestion is to develop preventive interventions aimed at developing job-seeking skills and motivation.25,26 Regarding marital status, the higher smoking prevalence among divorced individuals is likely to be explained by a lower cessation rate.27 Therefore, information on marital status may be valuable for those working in smoking cessation to identify individuals at higher risk of failure. Nevertheless, further research in this area is warranted.25
When considering specific regions, patterns were stable over time, with men smoking more in the Alentejo and women smoking more in Lisbon at an earlier stage, and in more recent years in the Algarve. The cross-sectional nature of this study does not enable conclusions to be drawn on the reasons behind this. Nevertheless, it could be speculated that the initial observation of more women smoking in Lisbon could be related with this being an area where smoking in women was accepted early on.13 However, while for the other regions there was an increase in smoking prevalence, in Lisbon it stabilized and the Algarve has now higher rates of smoking. These results should be taken into consideration and explored further when setting out to establish priorities for different areas of the country.
Our findings should be interpreted in the light of their limitations, particularly those related to the study design and instruments used.18,28,29 In all the NHIS the participation rate was over 79% and only a small proportion of participants (0.05-0.29%) did not respond to the section of the questionnaire on smoking. It is thus unlikely that non-participation and item non-response biased our results. Nevertheless, it should be noted that self-reported smoking status can underestimate smoking prevalence, especially in younger groups.9 In addition, we only analyzed daily smokers, which excludes occasional smokers. This decision was taken considering that occasional smokers may differ from daily smokers. Future research should look at this group and compare them with daily smokers.
For the last NHIS there were several changes in the sampling and interviewing methods, which may have affected comparability of data between different surveys. In the first four NHIS data were collected on all household members, while for the last NHIS only one household member was surveyed. This change should have helped to eliminate a potential family cluster effect and to minimize misclassification of smoking status as all individuals answered on their own behalf. Regarding the changes in the interviewing method, in the last NHIS a subsample was interviewed using web interview. However, those not responding by this method were invited to answer using the standard method. The use of two interviewing methods could have resulted in different response rates and have led to the inclusion of more younger individuals by the web-interview method. Nevertheless, the option to change to the standard interviewing method should have minimized these issues. Moreover, the question used to assess smoking changed over the years, which limited our analysis. In particular, daily smokers in the two weeks prior to the interview were analyzed in all but the last NHIS, in which current smokers were defined as those who typically smoked daily. Information is available from the third and fourth NHIS (data not shown) that enables comparison between participants reporting that they typically smoked daily (“Do you smoke?”) and those who reported having smoked daily in the two weeks prior to the interview. This comparison shows that, for the two surveys, 99.0% of those who reported being a current daily smoker also reported having smoked daily in the two weeks prior to the interview, leading to a slight underestimate (0.1%) of daily smoking prevalence. Therefore, we believe the changes in the question did not introduce an appreciable source of bias in our analysis. Overall, it is unlikely that these changes resulted in substantial changes in estimates of smoking prevalences, as indicated by the opposing trends in smoking prevalence for men and women.
Although the instruments used to measure variables were in general stable over time, there were some changes in these instruments in different years. These changes reflected developments in society, particularly in educational levels and marital status. We have tried to limit the effects of these changes by constructing similar categories, but some differences may restrict comparability of these categories. An extreme situation was income, which we were unable to include due to differences in definition over time. A related issue was the need to combine occupational situation and occupational category into a single variable to avoid collinearity. This limits the interpretation of this variable but does provide valuable insight into the role of occupational groups in this context.
The current study was restricted to mainland Portugal due to lack of data on the autonomous island regions of the Azores and Madeira in the first three surveys. However, it is important to keep in mind that in the last two NHIS the Azores showed the highest prevalence of smoking for men.15,22 Furthermore, the lack of weightings in the older surveys did not enable us to generate population-based estimates. In comparison with other studies using weightings, our results overestimate prevalence by around 3%.30 It is reassuring that this pattern is observed for several years and groups as we aimed to compare findings between different NHIS.
Despite these limitations, analysis of repeated NHIS can provide important information on observed trends.10,22,28,29 These results are an important contribution to epidemiologic characterization in Portugal and monitoring should continue. Further research on the topic should also include analysis of consumer profiles, quantities consumed, and initiation and cessation rates. This information, together with that from future research, can help guide policymakers, in particular those responsible for tobacco control plans.
Conflicts of interestThe authors have no conflicts of interest to declare.
This work was presented at the 9th European Public Health Conference in Vienna, November 2016. The authors would like to thank Irina Kislaya for information regarding the methodology used in the last NHIS.
