
Studies have shown that both cystatin C and metabolic syndrome (MetS) are associated with inflammation. We set out to investigate the correlation between serum cystatin C levels and MetS in the elderly.
MethodsThis prospective study was conducted in 380 elderly individuals, including 135 patients with MetS, 142 patients with metabolic disturbance (MetD), and 103 healthy elderly individuals (control group). Waist–hip ratio, waist circumference, waist–height ratio, body mass index (BMI), fasting plasma glucose (FPG), hemoglobin A1c (HbA1c), low-density lipoprotein cholesterol (LDL-C), triglycerides (TG), high-density lipoprotein (HDL-C), systolic blood pressure (SBP), diastolic blood pressure (DBP), pulse pressure and cystatin C were measured and their mutual relations were analyzed.
ResultsThe higher the MetS scores, the higher the serum cystatin C concentration in these patients. Serum cystatin C concentration was closely related to waist–hip ratio, waist circumference, waist–height ratio, BMI, TG, FPG, and blood pressure, not related to LDL-C levels, and negatively correlated with HDL-C levels. Logistic regression analysis indicated that cystatin C, waist–height ratio, waist circumference, FPG, TG, SBP and pulse pressure were significantly associated with MetS (OR between cystatin C and MetS 2.164, 95% CI 1.136–8.259).
ConclusionCystatin C was significantly associated with MetS in the elderly. As MetS scores rose, serum cystatin C levels increased.
Alguns estudos demonstraram que tanto a cistatina C como a síndrome metabólica (SM) estão associadas à inflamação. Procuramos investigar a correlação entre os níveis séricos da cistatina C e a SM nos idosos.
MétodosEste estudo prospetivo foi realizado em 380 idosos, incluindo 135 doentes com SM, 142 doentes com alterações metabólicas (AM) e 103 idosos saudáveis num grupo de controlo corrente. Foram medidos a relação cintura-quadril, o perímetro abdominal, a razão cintura-estatura, o índice da massa corporal (IMC), glicemia em jejum, a hemoglobina glicada (HbA1c), o colesterol de lipoproteína de baixa densidade (colesterol-DL), os triglicéridos (TG),o colesterol de lipoproteína de alta densidade (colesterol-HDL), a pressão arterial sistólica (PAS), a pressão arterial diastólica (PAD), a pressão do pulso e a cistatina C e foram avaliadas as suas relações mútuas.
Resultados1. Como os scores dos componentes da SM aumentaram, os níveis da cistatina C subiram nestes doentes. Quanto mais elevados foram os scores da SM, mais elevada foi a concentração sérica de cistatina C nestes doentes. 2. A concentração sérica de cistatina C foi estreitamente relacionada com a razão cintura-quadril, com o perímetro abdominal, com a razão cintura-estatura, com o IMC, com os TG, com a glicemia em jejum e com a pressão arterial, mas não associada aos níveis de colesterol-LDL e negativamente correlacionada com os níveis de colesterol-HDL. 3. A análise de regressão logística indicou que a cistatina C, a razão cintura-estatura, o perímetro abdominal, a glicemia em jejum, os TG, a PAS e a pressão do pulso foram significativamente associados à SM, ao valor da OR entre a cistatina C e a SM foi de 2,164 (95% IC=1,136-8,259).
ConclusãoA cistatina C foi significativamente associada com a SM nos idosos. Como os scores da SM subiram, os níveis séricos de cistatina C aumentaram.
Cystatin C (cysteine protease inhibitor C) is a member of the protease inhibitor superfamily, consisting of 122 amino acids, and is a low molecular weight alkaline protein. Various studies1–3 have revealed that cystatin C is not only a more sensitive indicator of renal function than creatinine or creatinine clearance but is also an independent and strong predictor of cardiovascular events, diabetes and all-cause mortality. Recent research has shown that cystatin C is closely associated with the inflammatory process and other inflammation factors.1,4
Metabolic syndrome (MetS) is a clinical entity characterized by abdominal obesity, hyperglycemia, hypertension, and dyslipidemia. Each of the components has been recognized as a risk factor for cardiovascular events. It is reported that more than 20% of the elderly suffer from MetS in China and the prevalence of MetS in the elderly in the United States has reached 43.5%. A prospective clinical study has demonstrated that serum cystatin C concentration has a strong independent association with cardiovascular events. MetS, as the most important risk factor for cardiovascular disease, carries a high risk of renal dysfunction, and abnormal renal function also has a close correlation with cardiovascular risk. As a marker of renal function, cystatin C may be closely related to MetS.1,3,5 However, the pathogenesis of MetS has not been fully determined. The elderly have a high incidence of cardiovascular and kidney disease, so this study set out to analyze clinical data on MetS, to investigate whether there is a relationship between cystatin C and MetS in the elderly, and to discuss its possible pathogenesis and clinical importance.
MethodsStudy population and diagnostic criteriaA total of 380 consecutive subjects were prospectively recruited between August 2009 and July 2012 from the Second Hospital of Shandong University and Qilu Hospital of Shandong University. According to the International Diabetes Federation (IDF) criteria,6,7 MetS is defined as central obesity (waist circumference ≥90 cm for Chinese men and ≥80 cm for Chinese women) plus any two of the following: (1) triglycerides (TG) ≥1.7 mmol/l or specific treatment for this lipid abnormality; (2) high-density lipoprotein (HDL-C) levels <1.0 mmol/l in men and <1.3 mmol/l in women or specific treatment for this lipid abnormality; (3) systolic blood pressure (SBP) ≥130 mmHg or diastolic blood pressure (DBP) ≥85 mmHg or treatment of previously diagnosed hypertension; and (4) fasting plasma glucose (FPG) ≥5.6 mmol/l or previously diagnosed type 2 diabetes. The criteria for a diagnosis of metabolic disturbance (MetD) is at least one of the diagnostic criteria for MetS as listed above. The definition of elderly was taken as 60 years of age or older. All diagnoses of MetS or MetD were supported by medical history, physical examination and laboratory tests. Patients with any of the following conditions were excluded from the study: infectious diseases, autoimmune disease, severe chronic disease such as advanced liver cirrhosis or cancer, renal dysfunction or use of hormone. The study was conducted in accordance with the ethical principles of the Declaration of Helsinki. The study protocol was approved by the Clinical Research Ethics Committee of the Secondary Hospital of Shandong University and written informed consent was obtained from all participants.
Groups and study designSubjects were divided into three groups according to the diagnosis of MetS and MetD: the MetS group included 135 patients, 64 male and 71 female, mean age 69.18±6.30 (60–82) years; the MetD group had 142 patients, 65 male and 77 female, mean age 70.05±6.64 (60–86) years; and the control group had 103 elderly individuals deemed healthy after examination, including 41 males and 62 females, with a mean age of 69.39±6.58 (60–85) years. There were no statistically significant differences (p>0.05) in age, gender or etiological composition between the three groups.
On the basis of their MetS score, determined as the number of metabolic syndrome components described by the IDF definition,8 each group was also subdivided into subgroups as follows: score-0 subgroup, subjects with no abnormal component; score-1 subgroup, subjects with one abnormal component, and so on, making a total of five subgroups.
Biochemical assessmentA 5-ml peripheral vein blood sample was obtained from all participants early in the day after a 12-h fast, immediately transferred to a glass tube containing disodium ethylenediaminetetraacetic acid (EDTA), centrifuged for 10 min at 3000 rpm, separated into aliquots, and then stored at −80°C. Cystatin C was measured by means of a particle-enhanced turbidimetric immunoassay with commercial kits (Beijing Leadman Biochemistry Co., Ltd., Beijing, China). Its normal reference value is 0.55–1.05 mg/l. FPG, hemoglobin A1c (HbA1c), total cholesterol (TC), LDL-C, HDL-C, TG, blood urea nitrogen and serum creatinine (Cr) were measured using an automatic biochemical analyzer (Hitachi 7600, Tokyo, Japan) with an enzymatic method in all subjects. Microalbuminuria (MAU) in early morning urine was assessed by rapid immunoturbidimetry using a DCA 2000 analyzer (Bayer Diagnostics, München, Germany). Estimated glomerular filtration rate (eGFR) was calculated by a modified MDRD equation: eGFR (ml/min per 1.73 m2)=175×plasma Cr (mg/dl)−1.234×age (in years)−0.179×0.79 (if female).9 All measurements were approved according to the quality control standards of the laboratory.
Statistical analysisContinuous variables were presented as mean ± SD and categorical variables were expressed as percentages. Measurement variables were compared using one-way ANOVA and numerical variables were compared with the chi-square test. The significance of associations between variables was assessed by partial correlation analysis after adjusting for classical risk factors (age and gender). Predictors of MetS were determined by multivariate regression analysis. The association between variables and the occurrence of MetS was represented by odds ratios (OR) and 95% confidence intervals (CI). SPSS 19.0 (SPSS Inc., Chicago, IL, USA) was used for all calculations. A value of p<0.05 was considered significant.
ResultsClinical characteristics of the study populationAs shown in Table 1, there were no differences in age or gender ratio between the MetS, MetD and control groups (p>0.05). There were significant differences in weight-related indicators (body mass index [BMI], waist circumference, waist–hip ratio and waist–height ratio), blood glucose parameters (FPG, HbA1c), blood lipids (LDL-C, TG and HDL-C), blood pressure (SBP, DBP and pulse pressure), renal function (Cr, eGFR and MAU) and cystatin C between the three groups (p<0.05 or p<0.01).
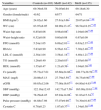
Comparison of baseline data between MetS, MetD and control groups (x¯±s).
| Variables | Controls (n=103) | MetD (n=142) | MetS (n=135) |
| Age (years) | 69.39±6.58 | 70.05±6.64 | 69.18±6.30 |
| Gender (female/male) | 41/62 | 65/77 | 64/71 |
| BMI (kg/m2) | 24.82±1.60 | 27.61±3.66* | 29.07±4.84**,## |
| WC (cm) | 83.97±8.05 | 88.90±13.47* | 98.54±18.25**,## |
| Waist–hip ratio | 0.85±0.06 | 0.98±0.08* | 1.04±0.09**,## |
| Waist–height ratio | 0.52±0.08 | 0.60±0.08 | 0.67±0.09 |
| FPG (mmol/l) | 5.24±1.05 | 6.09±2.01** | 6.63±2.37**,## |
| HbA1c | 5.83±0.90 | 6.56±1.61** | 7.30±2.40**,## |
| LDL-C (mmol/l) | 2.38±1.04 | 3.58±1.14** | 4.40±1.21**,## |
| TG (mmol/l) | 1.26±0.40 | 2.20±0.83* | 2.95±0.68*,# |
| HDL (mmol/l) | 1.35±0.47 | 1.21±0.39* | 1.04±0.30*,## |
| Cr (μmol/l) | 55.72±17.61 | 85.60±24.86** | 108.77±38.59**,## |
| MAU (mg/l) | 20.08±5.13 | 27.79±5.59** | 38.75±9.90**,## |
| eGFR | 89.85±12.06 | 77.08±16.67** | 64.80±14.63**,## |
| SBP (mmHg) | 122.16±12.45 | 142.73±17.56* | 165.08±19.61**,## |
| DBP (mmHg) | 78.29±8.45 | 85.94±14.08* | 91.83±15.34*,# |
| Pulse pressure (mmHg) | 44.88±7.98 | 57.07±9.90** | 74.30±10.85**,## |
| Cystatin C | 0.78±0.23 | 1.07±0.37** | 1.34±0.58**,## |
BMI: body mass index; Cr: serum creatinine; DBP: diastolic blood pressure; eGFR: estimated glomerular filtration rate; FPG: fasting plasma glucose; HbA1c: hemoglobin A1c; HDL-C: high-density lipoprotein cholesterol; LDL-C: low-density lipoprotein cholesterol; MAU: microalbuminuria; MetS: metabolic syndrome; MetD: metabolic disturbance; SBP: systolic blood pressure; TG: triglycerides; WC: waist circumference.
Compared with control group:
The higher the MetS component scores, the higher the serum cystatin C concentration in these patients. In comparison with the control group, the MetS and MetD groups had significantly higher cystatin C concentrations (p<0.05 or p<0.01). Compared with MetD group, the MetS group had significantly cystatin C (p<0.05 or p<0.01).
. In comparison with MetD, the MetS group had higher MetS component scores and cystatin C concentrations (all p<0.05). As MetS component scores rose, cystatin C concentrations also increased. MetD: metabolic disturbances; MetS: metabolic syndrome.")
Comparison of MetS component scores and cystatin C concentrations between groups. Compared with the control group, the MetD and MetS groups had higher MetS component scores and cystatin C concentrations (all p<0.05). In comparison with MetD, the MetS group had higher MetS component scores and cystatin C concentrations (all p<0.05). As MetS component scores rose, cystatin C concentrations also increased. MetD: metabolic disturbances; MetS: metabolic syndrome.
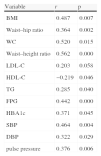
After adjusting for age and gender, the results of partial correlation analysis for a single factor showed that serum cystatin C concentrations in the MetS group were closely associated with (1) the body weight-related indicators BMI, waist–hip ratio, waist circumference and waist–height ratio, with r values all >0.300 (all p<0.05); (2) TG levels (r=0.285, p=0.040) but not LDL-C levels (r=0.283, p=0.058), and negatively associated with HDL-C levels (r=−0.219, p=0.046); (3) FPG and HbA1c (r=0.442, p=0.000; r=0.371, p=0.045, respectively); and (4) SBP, DBP and pulse pressure (r=0.464, p=0.004; r=0.322, p=0.029; r=0.376, p=0.006, respectively).
Correlation of cystatin C and other variables.
| Variable | r | p |
| BMI | 0.487 | 0.007 |
| Waist–hip ratio | 0.364 | 0.002 |
| WC | 0.520 | 0.015 |
| Waist–height ratio | 0.562 | 0.000 |
| LDL-C | 0.203 | 0.058 |
| HDL-C | −0.219 | 0.046 |
| TG | 0.285 | 0.040 |
| FPG | 0.442 | 0.000 |
| HBA1c | 0.371 | 0.045 |
| SBP | 0.464 | 0.004 |
| DBP | 0.322 | 0.029 |
| pulse pressure | 0.376 | 0.006 |
BMI: body mass index; DBP: diastolic blood pressure; FPG: fasting plasma glucose; HbA1c: hemoglobin A1c; HDL-C: high-density lipoprotein cholesterol; LDL-C: low-density lipoprotein cholesterol; SBP: systolic blood pressure; TG: triglycerides; WC: waist circumference.
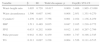
Multivariate stepwise regression analysis was performed to determine independent risk factors for MetS, with age, gender, and other factors including BMI, waist–hip ratio, waist circumference, waist–height ratio, FPG, HbA1c, LDL-C, TG, Cr, eGFR, MAU, SBP, DBP and pulse pressure identified in univariate analysis as independent variables. In this model, the presence or absence of MetS was taken as a dependent variable. All the independent variables were put into the logistic regression model. The analysis demonstrated that cystatin C (OR=2.164, 95% CI=1.136–8.259, p=0.002), waist–height ratio (OR=3.406, 95% CI=1.965–15.098, p=0.000), waist circumference (OR=2.951, 95% CI=1.351–9.270, p=0.008), TG (OR=1.526, 95% CI=0.112–0.515, p=0.004), FPG (OR=1.883, 95% CI=0.267–2.799, p=0.012), SBP (OR=2.105, 95% CI=1.218–9.772, p=0.047) and pulse pressure (OR=1.747, 95% CI=0.198–2.545, p=0.000) entered the regression equation and were then independently associated with MetS.
Multivariate logistic regression analysis of predictors for metabolic syndrome.
| Variable | β | SE | Wald chi-square | p | Exp(B) | 95% CI |
| Waist–height ratio | 1.695 | 0.720 | 10.617 | 0.000 | 3.406 | 1.965–15.098 |
| Waist circumference | 1.590 | 0.607 | 8.941 | 0.008 | 2.951 | 1.351–9.270 |
| Cystatin C | 1.239 | 0.445 | 7.756 | 0.001 | 2.164 | 1.136–8.259 |
| SBP | 1.511 | 0.489 | 9.035 | 0.047 | 2.105 | 1.218–9.772 |
| FPG | 0.633 | 0.202 | 9.800 | 0.012 | 1.883 | 0.267–2.799 |
| Pulse pressure | 0.942 | 0.192 | 8.439 | 0.000 | 1.747 | 0.198–2.545 |
| TG | 0.313 | 0.097 | 3.238 | 0.004 | 1.526 | 0.111–0.515 |
FPG: fasting plasma glucose; SBP: systolic blood pressure; SE: standard error; TG: triglycerides.
As the most important etiological factor of cardiovascular disease, MetS is probably intimately associated with cystatin C. In our study population, the greater the number of MetS components, the higher were the serum cystatin C levels. So cystatin C may be able to predict the risk of cardiovascular events.1
Central obesity is a key factor in the occurrence and development of MetS.5 However, some anthropometric parameters of central obesity remain controversial. Although BMI is widely applied in the assessment of overweight and obesity, it does not distinguish fat from muscle or different fat distribution.10 The main limitation of the waist–hip ratio is that both waist and hip circumference can change with weight variation and as a consequence alterations in the ratio are frequently small.10 Waist circumference is a sensitive indicator of central obesity; it not only reflects visceral fat content but is also the principal parameter for predicting obesity health-related risk. Waist circumference is also strongly related to central obesity. Nevertheless, it does not take into account differences in individual stature.10 A meta-analysis has shown that waist–height ratio is a better screening tool for cardiometabolic outcomes than other indicators of somatometric measurement, using receiver operating characteristic analysis as an indicator of sensitivity, with a ranking order of areas under the curve for predictive ability of the anthropometric indices of waist–height ratio>waist circumference>waist–hip ratio>BMI.11 Multivariate regression analysis in this study confirmed that waist–height ratio and waist circumference had a significant correlation with MetS in women and are simple and convenient measures.
It has been shown that cystatin C is closely linked to adipose tissue. Preadipocytes differentiated in vitro can express and release cystatin C; subcutaneous and omental fatty tissue overexpress cystatin C in vivo. Cystatin C produced by adipose tissue may be a fat-derived secretory adipocytokine.12 It not only has the potential to affect adipose tissue and vascular homeostasis through local and/or systemic inhibition of cathepsins but also affects the functions of adipose tissue and induces obesity-linked complications.12
Clinical data have demonstrated that serum cystatin C levels are closely connected to LDL-C and TG in patients with coronary heart disease.13 Univariate analysis in this study showed cystatin C was positively correlated with TG and LDL-C, and negatively correlated with HDL-C. However, multivariate analysis disclosed that TG was the only lipid variable that entered the regression equation. This is probably linked to the characteristics of hyperlipidemia in China, where there is less hypercholesterolemia, mainly low HDL-C and hypertriglyceridemia. In particular, among elderly patients with MetS, hypertriglyceridemia accounted for 37.4% of lipid metabolic abnormalities, while decreased HDL-C accounted for only 2.6%. Multivariate regression analysis in the Western New York Study indicated that cystatin C is the strongest independent risk factor for hyperglycemia,14 its concentration increasing before the onset of clinical diabetes. In comparison with healthy adults, cystatin C was associated with a threefold excess risk of progression to pre-diabetes in this population,14 and cystatin C and FPG were shown to be closely connected. Kestenbaum et al. found, in long-term follow-up, that after adjusting for confounding factors, cystatin C concentration in different ethnic populations is independently correlated with blood pressure.15 Data from the Heart and Soul Study revealed SBP and pulse pressure were linearly associated with cystatin C concentrations.16 The univariate correlation analysis in this study showed that SBP and pulse pressure had a closer association with cystatin C than DBP. These findings are probably relevant to features of hypertension in the elderly.
The mechanism of cystatin C's association with MetS remains unclear. Possibilities include the following.1,16–18 (1) Impaired renal function: each component of MetS may lead to renal function impairment.3 In our study, the MetS group had significantly higher Cr, eGFR and MAU values than the other groups. When renal function is impaired, ultrafiltration rate and loss of charge selectivity may contribute to the increased serum cystatin C concentrations in MetS patients.19 (2) Cystatin C participates in the process of cell apoptosis and has direct toxic effects on cells. (3) Cystatin C levels correlate significantly with insulin resistance.19 (4) Cystatin C is intimately linked to inflammatory and procoagulant factors,13 including homocysteine, C-reactive protein (CRP), interleukin-6 (IL-6), tumor necrosis factor-α (TNF-α), intercellular adhesion molecule-1, fibrinogen, and others. Moreover, cystatin C is independently related to CRP.1,4 In addition, cystatin C and its fragments may affect the phagotrophic and chemotactic functions of granulocytes, and participate in the inflammatory process.1,20 (5) Cystatin C is relevant to hypermetabolism.17 (6) Cystatin C may induce MetS by an oxidative stress mechanism.21
We acknowledge several limitations in this study. First, our sample size, although small, was sufficient to display differences between the MetS group and the control group, but further studies with larger cohorts should be performed to confirm these results. In addition, some inflammatory markers such as CRP, IL-6 and TNF-α were not assessed in this study to further elucidate the pathogenesis of MetS. Finally, we did not divide the patients with MetS score-4 and MetS score-5 into two groups because of the limited numbers in the two groups.
In conclusion, cystatin C is not only closely related to MetS in the elderly but is also intimately linked to the components of MetS. This study indicates that paying more attention to serum cystatin C levels in elderly patients at high risk for MetS has important theoretical and clinical implications for the prevention of MetS in the elderly. The generation rate of cystatin C is stable, not affected by factors such as gender, age, diet, bilirubin, or hemolysis. Monitoring dynamic changes in cystatin C levels may help in predicting the occurrence, development and prognosis of MetS in the elderly.
Ethical disclosuresProtection of human and animal subjectsThe authors declare that no experiments were performed on humans or animals for this study.
Confidentiality of dataThe authors declare that no patient data appear in this article.
Right to privacy and informed consentThe authors declare that no patient data appear in this article.
Conflicts of interestThe authors have no conflicts of interest to declare.
