


To characterize the distribution of total cholesterol (TC), LDL cholesterol (LDL-C), HDL cholesterol (HDL-C) and triglycerides in primary health care users.
MethodsWe performed a cross-sectional study in a primary care setting, involving 719 general practitioners based on stratified distribution proportional to the population density of each region of Portugal. The first two adult patients scheduled for an appointment on a given day were invited to participate. A questionnaire was applied to assess sociodemographic, clinical and laboratory data, including lipid profile.
ResultsThe study included 16856 individuals (mean age 58.1±15.1 years; 61.6% women). Data on TC, LDL-C, HDL-C and triglycerides was available in 95.9% (n=16159), 59.1% (n=9956), 95.4% (n=16074) and 97.9% (n=16494) of the population, respectively. Hypercholesterolemia (TC ≥200 mg/dl) was detected in 47% and 38.4% had high levels of LDL-C (≥130 mg/dl). Hypertriglyceridemia (≥200 mg/dl) and low HDL-C (<40 mg/dl) were less prevalent, affecting roughly 13% of the population. Dyslipidemia was more common in midle-aged men and in post-menopausal women. Of the population aged over 40, 54.1% met eligibility criteria for lipid-lowering therapy and 44.7% were medicated with statins, but only 16.0% of these had TC ≤175 mg/dl.
ConclusionsDyslipidemia is highly prevalent in primary health care users in Portugal. It is particularly common in middle-aged men and post-menopausal women, who should be considered target groups for preventive public health measures.
Caracterizar a distribuição dos níveis de colesterol total (CT), colesterol LDL (C-LDL), colesterol HDL (C-HDL) e triglicéridos nos utentes dos cuidados de saúde primários em Portugal.
MétodosEstudo transversal envolvendo 719 médicos de família, segundo distribuição estratificada e proporcional à densidade populacional de cada região. Os primeiros dois utentes adultos de cada dia de consulta foram convidados a participar independentemente do motivo de consulta. Foi utilizado um inquérito para recolha de dados sociodemográficos, clínicos e laboratoriais, incluindo o perfil lipídico avaliado nos 12 meses precedentes.
ResultadosForam avaliados 16.856 indivíduos (61,6% do sexo feminino, 58 ± 15 anos), dispondo-se da determinação de CT, C-LDL, C-HDL e triglicéridos em 95,9% (N = 16.159), 59,1% (N = 9.956), 95,4% (N = 16.074) e 97,9% (N = 16.494), respetivamente. Detetou-se hipercolesterolemia (≥ 200 mg/dl) em 47% e níveis aumentados de C-LDL (≥ 130 mg/dl) em 38,4%. A hipertrigliceridemia (≥ 200 mg/dl) e o C-HDL diminuído (< 40 mg/dl) foram menos prevalentes, afetando 13% da população. A dislipidemia foi mais frequente nos homens entre os 30-60 anos e nas mulheres pós-menopausa. Considerando a população com idade ≥ 40 anos, 54,1% dos indivíduos cumpriam critérios de elegibilidade para terapêutica hipolipidemiante e 44,7% estavam medicados com estatinas (mas apenas 16,0% desses apresentavam CT ≤ 175 mg/dl).
Conclusões A prevalência de dislipidemia é elevada entre os utentes adultos dos cuidados de saúde primários em Portugal. Além disso, é particularmente frequente nos homens entre os 30-60 anos e nas mulheres após a menopausa, que deverão constituir grupos-alvo nas estratégias preventivas de saúde pública.
cardiovascular disease
HDL cholesterol
LDL cholesterol
total cholesterol
triglycerides
Cardiovascular disease (CVD) is the leading cause of morbidity and mortality worldwide and a major problem in Portugal, in terms of coronary artery disease and even more of stroke, the incidence of which is among the highest in the world.1,2 Furthermore, the incidence of CVD is increasing in developed and developing countries, the result of changes in lifestyles and increased prevalence of cardiovascular risk factors.3,4
Dyslipidemia is an important risk factor for CVD, since cholesterol is a central component of atheromatous plaques. The link between cholesterol levels and coronary and cerebrovascular disease has been clearly demonstrated.5,6 It is estimated that hypercholesterolemia is implicated in 56% of cases of coronary disease and 18% of cerebrovascular disease.7,8 At the same time, lowering levels of total cholesterol (TC) and low-density lipoprotein cholesterol (LDL-C) with HMG-coenzyme A reductase inhibitors (statins) has been shown to reduce the incidence of CVD in primary prevention9–11 and the risk of recurrence in secondary prevention.12,13 The beneficial effect of lipid-lowering therapy on mortality rates means that assessment of global cardiovascular risk is now of fundamental importance.
Major medical societies have repeatedly reviewed optimum cholesterol levels for the general population and for those at increased risk, and have successively reduced the threshold for a diagnosis of hypercholesterolemia.14–16 It is now recognized that other changes in lipid profile also predispose to premature CVD. Atherogenic dyslipidemia is defined as a combination of high levels of triglycerides (TG), apolipoprotein B and small LDL particles, together with low levels of high-density lipoprotein cholesterol (HDL-C). It is also often associated with other cardiovascular risk factors in the form of metabolic syndrome.
The prevalence of dyslipidemia in Portugal has been investigated in various epidemiological studies at regional17–19 and national level,20,21 and estimated in a systematic review.22–24 However, these studies present considerable differences in diagnostic criteria, methodologies, target populations and method of assessing lipid levels. This makes the present analysis of lipid profile in adult primary health care users in Portugal of particular importance.
The aim of the present study was to characterize the distribution of TC, LDL-C, HDL-C and TG and to estimate the prevalence of dyslipidemia in primary health care users in Portugal. A second objective was to determine the prevalence of lipid-lowering therapy and to assess the level of control of lipid profile in those under such therapy.
MethodsThe VALSIM study was a cross-sectional observational study of adult primary care users in Portugal.25 It involved 719 general practitioners, based on stratified and proportional distribution by district and region of mainland Portugal, Madeira and the Azores. The study was carried out between April 2006 and November 2007.
The first two adult patients scheduled for an appointment on a given day who met the study criteria were invited to participate, irrespective of the reason for the consultation and of the presence of cardiovascular risk factors. The inclusion criterion was the existence of laboratory test results for fasting glucose, HDL-C and TG performed in the previous year; the exclusion criterion was the presence of clinical conditions that could affect a diagnosis of metabolic syndrome, such as thyroid dysfunction. After informed consent was obtained, a questionnaire was applied to characterize sociodemographic, anthropometric, clinical (personal history, current medication, diet and physical activity) and laboratory data. Coronary artery disease was considered present when this diagnosis had been made by the attending physician, with no requirement for exams confirming the diagnosis and no distinction being made as to the clinical setting involved (angina, acute coronary syndrome or myocardial infarction). Stroke was considered present when this diagnosis had been made by the attending physician, with no requirement for exams confirming the diagnosis and no distinction being made as to the type (ischemic or hemorrhagic). Diabetes was defined as the presence of fasting glucose ≥126 mg/dl or below this level under therapy with oral antidiabetics or insulin.
The 10-year risk of cardiovascular death was estimated in the population aged over 40 by application of the SCORE system, using the charts for countries with low CVD risk.26 Individuals aged under 40 were not included in the analysis, while the risk for those aged over 65 was estimated by applying the charts for age 65. Patients with a history of coronary artery disease, stroke, diabetes or severe hyper-cholesterolemia (TC ≥320 mg/dl or LDL-C ≥240 mg/dl) were assumed to be at high baseline cardiovascular risk. Of the remaining patients, those with an estimated 10-year risk of cardiovascular death of ≥5% after stratification were also considered at high cardiovascular risk.
To enable comparison with previous studies in the Portuguese population, the prevalence of hypercholesterolemia was determined using different definitions: (1) serum TC ≥200 mg/dl; (2) TC ≥200 mg/dl or below this level under lipid-lowering therapy; and (3) different cut-offs according to estimated 10-year risk of cardiovascular death. In the latter case, hypercholesterolemia was considered present in individuals at low cardiovascular risk with TC ≥190 mg/dl (5 mmol/l), in those at high cardiovascular risk (due to previous history or after stratification) with TC ≥175 mg/dl (4.5 mmol/l), and in all those taking lipid-lowering drugs, irrespective of their estimated cardiovascular risk.
Patients with high cardiovascular risk and TC ≥175 mg/dl (4.5 mmol/l) were considered eligible for lipid-lowering therapy, as were those already under such therapy.
Statistical analysisCategorical variables were analyzed to determine absolute and relative frequencies, with 95% confidence intervals. Prevalence rates were adjusted for gender and age by the total probability theorem, taking into account the demographic composition of the adult population resident in Portugal, by district and region, in 2000 (2001 Census, National Institute of Statistics [INE]). Categorical variables were compared using the chi-square test. Numerical variables were analyzed based on the number of observations, means, standard deviation, medians, and analysis of variance by Levene's test. Numerical variables with a normal distribution (as assessed by the Kolmogorov-Smirnov test) were compared using the Student's t test, and those with a non-normal distribution were compared using Kruskal-Wallis non-parametric tests. The statistical analysis was performed using SPSS, a level of significance of 5% being used in comparative analyses (p<0.05).
ResultsStudy populationThe VALSIM study assessed 16 856 individuals, of whom 61.6% were women, with a mean age of 58±15 years. Data on serum TC, LDL-C, HDL-C and TG were available in 95.9% (n=16159), 59.1% (n=9956), 95.4% (n=16074) and 97.9% (n=16494), respectively.
Of the individuals assessed, 14 251 were aged ≥40 years (male [M]: 5573; female [F]: 8678). Of this population, 29.5% (M: 34.4%; F: 25.4%) met at least one criterion for high cardiovascular risk based on previous history: 8.2% (M: 9.5%; F: 7.2%) had coronary artery disease, 3.3% (M: 3.7%; F: 2.8%) a history of cerebrovascular disease, 22.1% (M: 25.3%; F: 19.4%) diabetes, and 1.5% (M: 1.8%; F: 1.2%) severe hypercholesterolemia (TC ≥320 mg/dl or LDL-C ≥240 mg/dl). A further 3.7% (M: 6.9%; F: 0.8%) were placed in the high-risk group after stratification (estimated 10-year risk ≥5%).
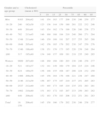
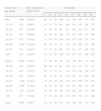
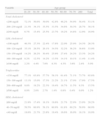
Serum lipid levelsMean TC in the study population was 206±41 mg/dl, and 200±40 mg/dl adjusted for gender and age, with no difference between the sexes (M: 200±42 mg/dl; F: 200±38 mg/dl). Mean LDL-C was 126±37 mg/dl, and 122±36 mg/dl adjusted for gender and age (M: 123±37 mg/dl; F: 120±35 mg/dl). TC and LDL-C levels increased and then decreased with age (Tables 1 and 2). Up to the fifth decade of life, TC and LDL-C levels were higher in men, while in older individuals they were higher in women (Table 3).
Serum total cholesterol by gender and age-group.
| Gender and age-group | n | Cholesterol (mean ± SD) | Percentile | ||||||||
| 5 | 10 | 15 | 25 | 50 | 75 | 85 | 90 | 95 | |||
| Men | 6163 | 204±42 | 141 | 154 | 163 | 177 | 200 | 230 | 246 | 259 | 277 |
| 18–29 | 240 | 182±39 | 123 | 136 | 144 | 159 | 180 | 201 | 222 | 232 | 246 |
| 30–39 | 449 | 201±41 | 143 | 154 | 162 | 174 | 199 | 226 | 240 | 256 | 273 |
| 40–49 | 792 | 213±45 | 146 | 160 | 168 | 184 | 210 | 240 | 260 | 271 | 294 |
| 50–59 | 1348 | 211±44 | 146 | 159 | 169 | 181 | 207 | 237 | 255 | 265 | 288 |
| 60–69 | 1648 | 205±41 | 142 | 156 | 165 | 179 | 202 | 230 | 247 | 259 | 276 |
| 70–79 | 1346 | 198±40 | 138 | 151 | 159 | 173 | 195 | 220 | 239 | 248 | 264 |
| ≥80 | 317 | 195±40 | 134 | 148 | 157 | 169 | 191 | 218 | 235 | 249 | 265 |
| Women | 9889 | 207±40 | 148 | 160 | 168 | 180 | 203 | 230 | 246 | 258 | 277 |
| 18–29 | 521 | 183±37 | 132 | 141 | 149 | 160 | 179 | 204 | 215 | 224 | 246 |
| 30–39 | 824 | 189±35 | 136 | 148 | 155 | 168 | 187 | 208 | 224 | 232 | 250 |
| 40–49 | 1406 | 200±36 | 145 | 156 | 164 | 176 | 198 | 221 | 238 | 247 | 260 |
| 50–59 | 2146 | 213±39 | 156 | 167 | 175 | 187 | 210 | 237 | 251 | 265 | 283 |
| 60–69 | 2527 | 212±40 | 153 | 165 | 173 | 185 | 210 | 235 | 252 | 263 | 281 |
| 70–79 | 1982 | 210±40 | 151 | 163 | 172 | 183 | 207 | 233 | 250 | 263 | 282 |
| ≥80 | 449 | 209±41 | 152 | 163 | 170 | 183 | 206 | 232 | 251 | 261 | 283 |
| Total | 16 159 | 206±41 | 145 | 158 | 166 | 179 | 202 | 230 | 246 | 258 | 277 |
LDL-cholesterol levels by gender and age-group.
| Gender and age-group | n | LDL cholesterol (mean ± SD) | Percentile | ||||||||
| 5 | 10 | 15 | 25 | 50 | 75 | 85 | 90 | 95 | |||
| Men | 3807 | 126±38 | 68 | 81 | 90 | 100 | 124 | 149 | 164 | 174 | 190 |
| 18–29 | 134 | 110±34 | 62 | 73 | 78 | 88 | 106 | 128 | 143 | 160 | 177 |
| 30–39 | 271 | 124±36 | 71 | 85 | 88 | 98 | 121 | 148 | 164 | 171 | 189 |
| 40–49 | 487 | 130±40 | 70 | 80 | 90 | 103 | 130 | 155 | 170 | 184 | 196 |
| 50–59 | 822 | 132±39 | 74 | 85 | 94 | 106 | 128 | 155 | 169 | 183 | 201 |
| 60–69 | 1019 | 127±38 | 68 | 82 | 93 | 101 | 126 | 150 | 164 | 174 | 186 |
| 70–79 | 852 | 121±35 | 67 | 79 | 87 | 98 | 120 | 141 | 157 | 166 | 180 |
| ≥80 | 210 | 120±36 | 55 | 72 | 86 | 100 | 118 | 145 | 157 | 168 | 182 |
| Women | 6085 | 126±37 | 71 | 82 | 90 | 101 | 124 | 148 | 162 | 173 | 190 |
| 18–29 | 294 | 103±29 | 60 | 68 | 75 | 84 | 100 | 121 | 131 | 137 | 157 |
| 30–39 | 456 | 114±35 | 64 | 73 | 79 | 91 | 110 | 133 | 149 | 156 | 178 |
| 40–49 | 841 | 120±34 | 67 | 79 | 86 | 97 | 119 | 142 | 155 | 164 | 178 |
| 50–59 | 1326 | 131±37 | 74 | 86 | 94 | 107 | 129 | 154 | 169 | 179 | 196 |
| 60–69 | 1624 | 131±36 | 76 | 87 | 96 | 107 | 129 | 152 | 166 | 178 | 192 |
| 70–79 | 1271 | 127±36 | 72 | 86 | 94 | 103 | 125 | 148 | 162 | 174 | 190 |
| ≥80 | 255 | 129±41 | 70 | 81 | 90 | 101 | 123 | 150 | 172 | 181 | 200 |
| Total | 9956 | 126±37 | 70 | 81 | 90 | 101 | 124 | 149 | 162 | 173 | 190 |
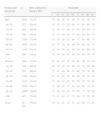
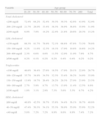
Triglyceride levels by gender and age-group.
| Gender and age-group | n | Triglycerides (mean ± SD) | Percentile | ||||||||
| 5 | 10 | 15 | 25 | 50 | 75 | 85 | 90 | 95 | |||
| Men | 6.304 | 146±94 | 58 | 68 | 76 | 91 | 125 | 176 | 209 | 240 | 296 |
| 18–29 | 245 | 120±78 | 43 | 53 | 61 | 72 | 98 | 143 | 165 | 201 | 282 |
| 30–39 | 459 | 153±106 | 57 | 67 | 76 | 90 | 124 | 180 | 224 | 259 | 337 |
| 40–49 | 816 | 169±120 | 61 | 73 | 82 | 96 | 136 | 200 | 258 | 299 | 374 |
| 50–59 | 1388 | 157±105 | 62 | 74 | 83 | 96 | 137 | 188 | 218 | 250 | 326 |
| 60–69 | 1676 | 147±88 | 61 | 72 | 78 | 93 | 129 | 178 | 208 | 237 | 278 |
| 70–79 | 1374 | 128±66 | 54 | 64 | 70 | 82 | 113 | 157 | 187 | 207 | 241 |
| ≥80 | 323 | 126±60 | 59 | 64 | 69 | 87 | 111 | 150 | 180 | 197 | 235 |
| Women | 10 078 | 127±70 | 54 | 63 | 70 | 82 | 112 | 153 | 181 | 204 | 248 |
| 18–29 | 530 | 102±83 | 45 | 54 | 59 | 69 | 90 | 121 | 140 | 154 | 182 |
| 30–39 | 830 | 109±58 | 44 | 52 | 59 | 71 | 98 | 134 | 158 | 180 | 217 |
| 40–49 | 1434 | 117±66 | 47 | 56 | 61 | 73 | 102 | 142 | 168 | 192 | 245 |
| 50–59 | 2189 | 129±69 | 54 | 63 | 70 | 82 | 113 | 155 | 185 | 210 | 259 |
| 60–69 | 2579 | 135±75 | 60 | 69 | 76 | 89 | 119 | 161 | 190 | 215 | 263 |
| 70–79 | 2026 | 134±65 | 62 | 72 | 79 | 91 | 119 | 162 | 189 | 213 | 250 |
| ≥80 | 457 | 128±56 | 64 | 72 | 80 | 90 | 117 | 153 | 172 | 193 | 224 |
| Total | 16 494 | 134±80 | 55 | 65 | 72 | 85 | 117 | 161 | 192 | 217 | 268 |
Mean TG adjusted for gender and age was 132±81 mg/dl, and was significantly higher in men (M: 146±96 mg/dl vs. F: 119±69 mg/dl; p<0.001). TG also increased and then decreased with age, and was higher in men of all age-groups (Table 4); furthermore, the highest mean values were seen at an earlier age in men.
HDL-cholesterol levels by gender and age-group.
| Gender and age-group | n | HDL-cholesterol (mean ± SD) | Percentile | ||||||||
| 5 | 10 | 15 | 25 | 50 | 75 | 85 | 90 | 95 | |||
| Men | 6161 | 51±18 | 33 | 36 | 38 | 42 | 48 | 57 | 63 | 68 | 76 |
| 18–29 | 237 | 51±15 | 32 | 35 | 37 | 42 | 49 | 58 | 61 | 65 | 70 |
| 30–39 | 448 | 50±16 | 32 | 36 | 37 | 40 | 47 | 55 | 60 | 65 | 75 |
| 40–49 | 794 | 50±16 | 32 | 35 | 36 | 40 | 47 | 56 | 61 | 68 | 74 |
| 50–59 | 1369 | 51±16 | 33 | 36 | 38 | 42 | 48 | 57 | 62 | 66 | 74 |
| 60–69 | 1635 | 52±18 | 33 | 37 | 39 | 42 | 49 | 58 | 64 | 68 | 76 |
| 70–79 | 1347 | 52±19 | 33 | 36 | 39 | 42 | 49 | 58 | 65 | 69 | 78 |
| ≥80 | 309 | 53±22 | 32 | 36 | 38 | 42 | 49 | 59 | 65 | 70 | 78 |
| Women | 9801 | 57±18 | 37 | 40 | 43 | 47 | 55 | 65 | 70 | 75 | 83 |
| 18–29 | 500 | 60±16 | 38 | 42 | 45 | 50 | 58 | 67 | 72 | 79 | 86 |
| 30–39 | 795 | 59±18 | 37 | 41 | 44 | 48 | 57 | 66 | 72 | 78 | 84 |
| 40–49 | 1382 | 58±18 | 37 | 41 | 44 | 47 | 56 | 65 | 70 | 76 | 84 |
| 50–59 | 2132 | 57±18 | 37 | 40 | 42 | 47 | 55 | 65 | 70 | 75 | 84 |
| 60–69 | 2529 | 56±17 | 37 | 40 | 42 | 47 | 54 | 63 | 69 | 74 | 81 |
| 70–79 | 1986 | 58±20 | 37 | 40 | 42 | 47 | 55 | 65 | 71 | 76 | 84 |
| ≥80 | 447 | 57±16 | 37 | 41 | 43 | 47 | 55 | 66 | 73 | 78 | 86 |
| Total | 16 074 | 55±18 | 35 | 38 | 41 | 45 | 52 | 62 | 68 | 73 | 81 |
Mean HDL-C adjusted for gender and age was 55±17 mg/dl, and was significantly lower in men (M: 51±17 mg/dl vs. F: 58±18 mg/dl; p<0.001), but did not vary significantly with age (Table 6).
Prevalence of dyslipidemiaThe estimated prevalence of hypercholesterolemia in primary health care users was 47.0% (unadjusted: 53.2%), based on a TC cut-off of 200 mg/dl; 57.9% (unadjusted: 64.4%) presented TC ≥190 mg/dl, and 11.4% (unadjusted: 13.4%) had TC ≥250 mg/dl. Overall prevalence was similar in both sexes (Table 5), but varied significantly with age, tending to be higher in middle-aged men, but in older age-groups women tended to predominate (Figure 1, Table 6). Elevated LDL-C (≥130 mg/dl) was found in 38.4% of the population, with a similar proportion in both sexes.
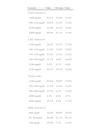
Lipid profile of the study population adjusted for gender, age and region of residence.
| Variable | Men | Women | Total |
| Total cholesterol | |||
| <200 mg/dl | 53.1% | 52.9% | 53.0% |
| 200–239 mg/dl | 30.1% | 31.9% | 31.0% |
| ≥240 mg/dl | 16.9% | 15.2% | 16.0% |
| ≥200 mg/dl | 46.9% | 47.1% | 47.0% |
| LDL cholesterol | |||
| <100 mg/dl | 26.3% | 28.7% | 27.6% |
| 100–129 mg/dl | 33.0% | 35.0% | 34.0% |
| 130–159 mg/dl | 24.2% | 23.5% | 23.8% |
| 160–189 mg/dl | 11.4% | 8.6% | 10.0% |
| ≥190 mg/dl | 5.0% | 4.2% | 4.6% |
| ≥130 mg/dl | 40.7% | 36.3% | 38.4% |
| Triglycerides | |||
| <150 mg/dl | 65.8% | 76.8% | 71.6% |
| 150–199 mg/dl | 17.5% | 14.2% | 15.8% |
| 200–499 mg/dl | 15.5% | 8.7% | 12.0% |
| ≥500 mg/dl | 1.2% | 0.2% | 0.7% |
| ≥200 mg/dl | 16.7% | 9.0% | 12.7% |
| HDL cholesterol | |||
| ≥60 mg/dl | 20.2% | 40.6% | 30.9% |
| 40–59 mg/dl | 60.9% | 52.2% | 56.3% |
| <40 mg/dl | 18.9% | 7.2% | 12.8% |
 by gender and age.")
Lipid profile of male population by age-group.
| Variable | Age-group | |||||||
| 18–29 | 30–39 | 40–49 | 50–59 | 60–69 | 70–79 | ≥80 | Total | |
| Total cholesterol | ||||||||
| <200 mg/dl | 72.1% | 50.6% | 39.0% | 42.8% | 46.2% | 54.9% | 58.4% | 53.1% |
| 200–239 mg/dl | 21.3% | 34.1% | 35.5% | 33.5% | 34.6% | 30.3% | 28.7% | 30.1% |
| ≥240 mg/dl | 6.7% | 15.4% | 25.5% | 23.7% | 19.2% | 14.8% | 12.9% | 16.9% |
| LDL cholesterol | ||||||||
| <100 mg/dl | 40.3% | 27.3% | 22.4% | 17.8% | 22.0% | 25.9% | 24.3% | 26.3% |
| 100–129 mg/dl | 35.1% | 29.5% | 26.1% | 34.5% | 32.2% | 36.2% | 38.6% | 33.0% |
| 130–159 mg/dl | 14.2% | 26.2% | 30.4% | 25.9% | 27.4% | 24.2% | 23.3% | 24.2% |
| 160–189 mg/dl | 8.2% | 12.5% | 14.2% | 13.5% | 14.1% | 10.1% | 11.4% | 11.4% |
| ≥190 mg/dl | 2.2% | 4.4% | 7.0% | 8.3% | 4.3% | 3.6% | 2.4% | 5.0% |
| Triglycerides | ||||||||
| <150 mg/dl | 77.1% | 63.8% | 57.7% | 58.1% | 61.4% | 71.1% | 73.7% | 65.8% |
| 150–199 mg/dl | 13.1% | 15.0% | 17.3% | 21.2% | 21.1% | 17.0% | 17.0% | 17.5% |
| 200–499 mg/dl | 9.8% | 19.2% | 22.3% | 19.4% | 16.7% | 11.5% | 9.3% | 15.5% |
| ≥500 mg/dl | 0.0% | 2.0% | 2.7% | 1.4% | 0.8% | 0.4% | 0.0% | 1.2% |
| HDL cholesterol | ||||||||
| ≥60 mg/dl | 21.9% | 17.4% | 18.1% | 19.6% | 21.7% | 22.9% | 23.0% | 20.2% |
| 40–59 mg/dl | 59.5% | 60.9% | 58.1% | 60.9% | 61.8% | 60.2% | 58.9% | 60.9% |
| <40 mg/dl | 18.6% | 21.7% | 23.8% | 19.4% | 16.6% | 16.9% | 18.1% | 18.9% |
Hypertriglyceridemia (≥200 mg/dl) was detected in 12.7% and low HDL-C (<40 mg/dl) in 12.8%; both were more common in men (OR: 1.43; 95% CI 1.37–1.48; p<0.001 and OR: 1.59; 95% CI 1.55–1.63; p<0.001, respectively) (Table 5).
The prevalence of lipid disorders increased and then decreased with age (Figures 1–3), the highest prevalences being found in the fourth decade of life in men (Table 6), and one or two decades later in women (Table 7).
 by gender and age.")
 by gender and age.")
Lipid profile of female population by age-group.
| Variable | Age-group | |||||||
| 18–29 | 30–39 | 40–49 | 50–59 | 60–69 | 70–79 | ≥80 | Total | |
| Total cholesterol | ||||||||
| <200 mg/dl | 72.4% | 64.2% | 52.4% | 39.3% | 39.3% | 42.6% | 43.9% | 52.9% |
| 200–239 mg/dl | 21.7% | 28.0% | 33.4% | 38.3% | 38.9% | 36.8% | 35.9% | 31.9% |
| ≥240 mg/dl | 6.0% | 7.8% | 14.2% | 22.4% | 21.8% | 20.6% | 20.3% | 15.2% |
| LDL cholesterol | ||||||||
| <150 mg/dl | 88.3% | 81.7% | 78.9% | 72.1% | 68.8% | 67.8% | 73.3% | 76.8% |
| 150–199 mg/dl | 9.2% | 11.6% | 12.3% | 16.1% | 17.9% | 19.8% | 18.6% | 14.2% |
| 200–499 mg/dl | 2.3% | 6.6% | 8.6% | 11.5% | 12.9% | 11.9% | 7.9% | 8.7% |
| ≥500 mg/dl | 0.2% | 0.1% | 0.2% | 0.2% | 0.4% | 0.4% | 0.2% | 0.2% |
| Triglycerides | ||||||||
| <100 mg/dl | 46.6% | 36.4% | 27.6% | 18.5% | 17.9% | 20.1% | 22.0% | 28.7% |
| 100–129 mg/dl | 35.7% | 34.9% | 34.5% | 32.3% | 33.4% | 36.2% | 34.9% | 35.0% |
| 130–159 mg/dl | 13.9% | 19.7% | 26.4% | 28.2% | 29.3% | 27.0% | 23.9% | 23.5% |
| 160–189 mg/dl | 2.7% | 5.9% | 8.7% | 13.7% | 13.9% | 11.4% | 12.5% | 8.6% |
| ≥190 mg/dl | 1.0% | 3.1% | 2.9% | 7.3% | 5.6% | 5.3% | 6.7% | 4.2% |
| HDL cholesterol | ||||||||
| ≥60 mg/dl | 46.8% | 42.5% | 38.7% | 35.8% | 34.4% | 36.1% | 36.7% | 40.6% |
| 40–59 mg/dl | 47.4% | 50.3% | 54.1% | 55.3% | 56.9% | 55.0% | 55.9% | 52.2% |
| <40 mg/dl | 5.8% | 7.2% | 7.2% | 8.9% | 8.6% | 8.9% | 7.4% | 7.2% |
When hypercholesterolemia was defined as TC ≥200 mg/dl or below this threshold under lipid-lowering therapy, its prevalence rose to 63.7% (unadjusted 73.5%), with no significant difference between the sexes (M: 63.9%; F: 63.4%).
When account was taken of both 10-year risk of cardiovascular death and TC levels, the prevalence of hypercholesterolemia in the study population reached 82.2% (M: 83.1%; F: 81.4%; p<0.001).
Lipid-lowering therapyOf the population aged ≥40 years, 54.1% met eligibility criteria for lipid-lowering therapy (M: 57.8%; F: 50.8%); this finding was significantly more common in men (OR: 1.45; 95% CI 1.31–1.61; p<0.001) and increased with age (Figure 4).

In this patient subgroup, 44.7% were medicated with statins (M: 45.4%; F: 44.0%), and of those with indication for lipid-lowering therapy, 77.7% were receiving treatment, with a higher proportion of women (M: 73.6%; F: 81.4%). However, of those medicated with statins, only 16.0% had controlled TC (≤175 mg/dl) – M: 18.6%; F: 13.8% – and only 12.8% had controlled levels of both TC (≤175 mg/dl) and LDL-C (<100 mg/dl) – M: 15.1%; F: 10.8%.
DiscussionThe present study shows that there is a high prevalence of dyslipidemia among adult primary health care users in Portugal. Hypercholesterolemia was detected in 47% of the study population (based on a TC cut-off of 200 mg/dl), and 38.4% had LDL-C ≥130 mg/dl. Elevated TG (≥200 mg/dl) and low HDL-C (<40 mg/dl) were less prevalent, affecting under 13% of the population.
The prevalence of CVD has progressively increased, initially in developed countries and more recently in developing countries, in parallel with changes in lifestyle and increases in body weight. The prevalence of obesity has also risen in the last ten years in Portugal,27,28 and is now estimated at 16.8% of men and 21.8% of women.29 The adverse epidemiological impact of cardiovascular risk factors would probably be even greater were it not for the implementation of preventive measures designed to improve their control. For example, improved detection and treatment of hypertension has led to a progressive reduction in mean blood pressure values worldwide over the last 30 years.30 However, the effect of various interventions designed to improve lipid profile has probably been more limited; despite the availability and widespread use of powerful lipid-lowering drugs, mean TC levels have remained virtually unchanged worldwide over the same period.31 It is thus particularly important to assess a population's lipid profile and the extent of control of dyslipidemia.
Mean TC adjusted for gender and age in our population of adult primary health care users (200±40 mg/dl) is similar to that observed in developed countries of western Europe, North America and south-east Asia (M: 203 mg [196–208 mg]; F: 202 mg [195–210 mg]).30 Although overall mean TC levels are similar in both sexes, there are significant differences with age. TC, LDL-C and TG increase with age, reaching maximum values in men aged 40–49 and in women aged 50–59, the differences being more marked in younger age-groups, and with significantly higher levels in men. The differences between the sexes tend to disappear or reverse in older individuals, with slightly higher levels in women. These changes in lipid profile with age have also been reported in other studies.32
The prevalence of dyslipidemia in Portugal has been investigated in various epidemiological studies at regional17–19 and national level20,21 and estimated in a systematic review.22–24 Seventy-one percent of these studies used a TC cut-off of ≥200 mg/dl as the criterion of hypercholesterolemia and reported an estimated prevalence ranging between 47% and 75%.22–24 The 2001 BECEL epidemiological study, aimed at characterizing lipid profile in the Portuguese population, included 1500 individuals aged 18–96 years.22–24 Hypercholesterolemia (defined as TC ≥190 mg/dl) was found in 68.5% (95% CI 66.4–70.5); 23.4% had TC ≥240 mg/dl, and 71% presented LDL-C ≥115 mg/dl. The ALTO-MAR study (2001) included 16.763 individuals, of whom 23.4% presented TC ≥240 mg/dl and 21.8% ≥250 mg/dl.22–24 Comparison between these studies is hindered by the use of different definitions of dyslipidemia, the result of the varying diagnostic cut-offs used in international guidelines.
The VALSIM study was based on the NCEP ATP III recommendations15 and the results presented in this article are based on these cut-offs. However, to facilitate comparison with epidemiological studies using different definitions, we also estimated prevalence based on other commonly used cut-offs. Our results suggest a lower prevalence of dyslipidemia among primary health care users in Portugal: 47% had TC ≥200 mg/dl and 16% had ≥240 mg/dl. These values are in line with estimated prevalences of hypercholesterolemia in other southern European countries, including Spain, where it is estimated that 20% of adults present TC >250 mg/dl and 50% present ≥200 mg/dl.33,34
Our study also indicates that 44.7% of primary health care users aged over 40 are being treated with statins, which is reflected in increased expenditure on lipid-lowering drugs in Portugal. According to a study by Teixeira et al.,35 the number of daily doses per 1000 population rose from 10.21 in 1995 to 67.93 in 2004. There was thus an annual mean increase of 34.5% in the use of statins during that period, and expenditure on lipid-lowering drugs accounted for 5% of outpatient medication costs (123 million euros) in 2003.
The finding of such a high prevalence and poor control of hypercholesterolemia points to the need for public health measures, particularly promotion of a healthy diet, to complement pharmacological treatment in high-risk groups.
Study limitationsThe present study was performed in a primary health care setting, as this is a reliable way of recruiting a large sample of individuals that is representative of a country's different regions. However, caution is required in extrapolating the results to the overall population, since important differences may exist between the population followed in primary health care and others. Furthermore, while the method of selection (the first two patients on any given day) is intended to be random, it may be affected by inequalities in access to health services.
Given the size of the study, laboratory tests were not performed by a single central laboratory. Nevertheless, laboratories in Portugal undergo certification and quality control, which minimizes variation in references values and makes comparison of results acceptable.
Ten-year risk of cardiovascular death was only calculated for those aged over 40, with no upper age limit; for the purposes of the study, individuals aged over 65 were assessed using the formula applicable to those aged 65. This method may have underestimated the actual cardiovascular risk in older individuals, but does not compromise the overall interpretation of the results.
When assessing the prevalence of lipid-lowering therapy, all patients taking such medication were considered eligible for the therapy; the study did not set out to assess the appropriateness of any decision to institute lipid-lowering therapy on the part of attending physicians.
ConclusionsDyslipidemia is highly prevalent in primary health care users in Portugal, with elevated TC levels (≥200 mg/dl) in 47%. The study's results contribute to the epidemiological characterization of cardiovascular risk in the Portuguese population, which is essential for the planning of appropriate preventive public health measures. In addition, the study updates estimates of prevalence reported by previous studies and provides data on prevalences by gender and age and using different diagnostic cut-offs.
Conflicts of interestThe authors have no conflicts of interest to declare.
Please cite this article as: Cortez-Dias N, Robalo Martins S, Belo A, Fiúza M, em nome dos Investigadores do Estudo VALSIM. Caracterização do perfil lipídico nos utentes dos cuidados de saúde primários em Portugal. Rev Port Cardiol. 2013;32:987–996.
