


Limitations have been pointed out in the clinical risk prediction model for sudden cardiac death (SCD) of the European Society of Cardiology (ESC), which is recommended for hypertrophic cardiomyopathy (HCM) patients. The aim of this study was to determine the SCD risk of the HCM patients enrolled in a Portuguese nationwide registry and to develop a new SCD risk prediction model applicable to our population.
Methods and resultsThe cohort consisted of 1022 patients (mean age 53.2±16.4 years, 59% male) enrolled in a Portuguese national HCM registry. During the follow-up period (median five years), 19 patients (1.9%) died suddenly or had aborted SCD or appropriate implantable cardioverter-defibrillator (ICD) shock therapy. Through a Cox proportional hazards model, four variables were independently associated with SCD or equivalent: unexplained Syncope, Heart failure signs, Interventricular septum thickness ≥19 mm and FragmenTed QRS complex. These predictors were included in the SHIFT model and individual risk probabilities of SCD at five years were estimated. This model was internally validated using bootstrapping. The C-index of the SHIFT model was 0.81 (95% CI: 0.77-0.83) and the C-index of the ESC model (performed in a subgroup of 349 HCM patients) was 0.77 (95% CI: 0.73-0.81) (p=0.246).
ConclusionThe SHIFT model may potentially provide prognostic value and contribute to the clinical decision-making process for ICD implantation for primary prevention of SCD.
Algumas limitações têm sido apontadas ao modelo de risco da Sociedade Europeia de Cardiologia (SEC), recomendado para estimar o risco de morte súbita cardíaca (MSC) em doentes com miocardiopatia hipertrófica (MCH). O objetivo deste estudo foi conhecer o risco de MSC dos doentes com MCH incluídos num registo nacional português e desenvolver um novo modelo preditor de MSC aplicável à nossa população.
Métodos e resultadosForam analisados 1022 doentes incluídos no Registo Nacional Português de MCH (idade média: 53,2±16,4 anos, 59% sexo masculino). Durante o período de seguimento (mediana de cinco anos), 19 doentes (1,9%) morreram subitamente, tiveram MSC abortada ou receberam um choque apropriado do cardioversor desfibrilhador implantável (CDI). Através do Modelo de Cox de Riscos Proporcionais, quatro variáveis foram associadas de forma independente a MSC ou equivalente: síncope inexplicada, sinais de insuficiência cardíaca, espessura do septo interventricular ≥19 mm e QRS fragmentado. Estes preditores foram incluídos no modelo SHIFT, as probabilidades individuais de MSC a cinco anos foram estimadas e a validação interna do modelo foi realizada através de bootstrapping. O C-index do modelo SHIFT foi de 0,81 (95% CI: 0,77 – 0,83) e o C-index do modelo da SEC (desenvolvido num subgrupo de 349 doentes) foi de 0,77 (95% CI: 0,73 – 0,81), valor-p: 0,246.
ConclusõesO modelo SHIFT poderá proporcionar valor prognóstico e contribuir para a decisão clínica de implantação de CDI em prevenção primária.
Hypertrophic cardiomyopathy (HCM) is the most common monogenic heart disease, with an estimated prevalence of 1 per 500 persons in the general population.1 The 2014 European Society of Cardiology (ESC) guidelines for HCM2 recommend a clinical risk prediction model for sudden cardiac death (SCD), based on the HCM Risk-SCD study.3 However, criticisms have been made regarding the ESC's SCD risk score, particularly its failure to include clinical signs of heart failure, electrocardiographic parameters or the presence and extent of myocardial fibrosis, an emerging tool for SCD risk stratification.4–6
The ESC risk prediction model has been assessed in different studies but the results have been conflicting. Although most reports and subsequent meta-analyses have validated the model,7–11 a single recent study suggested that it may misclassify risk.4 We used the Portuguese Registry of Hypertrophic Cardiomyopathy (PRo-HCM) to study the SCD risk of HCM patients and to develop a new SCD risk prediction model applicable to our population.
MethodsThe PRo-HCM, run by the Portuguese Society of Cardiology, was a voluntary multicenter observational study with a two-year enrollment period (April 2013-April 2015), which was retrospective but included a prospective update. It was instituted to collect data on the epidemiology and outcomes of HCM patients seen in Portugal and the first overall results have been published.12 The criteria for enrollment were age >18 years at the time of enrollment and maximum left ventricular wall thickness ≥15 mm unexplained by abnormal loading conditions, in accordance with the 2014 ESC guidelines.2
For the purpose of the current study a cohort of 1022 patients enrolled in PRo-HCM was analyzed (20 patients were excluded due to missing data during follow-up). The follow-up time for each patient was calculated from the date of their first assessment to the study endpoint or death from another cause, or follow-up of five years. The study endpoint was defined as the composite of SCD or an equivalent event. SCD was defined as witnessed sudden death with or without documented ventricular fibrillation or death within one hour of new symptoms or nocturnal deaths with no previous history of worsening symptoms.13 Aborted SCD during follow-up and appropriate implantable cardioverter-defibrillator (ICD) shock therapy (ICD shock to treat sustained ventricular tachycardia or ventricular fibrillation) were considered equivalent events to SCD.
Baseline clinical, electrocardiographic, echocardiographic and cardiovascular magnetic resonance (CMR) characteristics, as well as medical treatment and follow-up data, were analyzed. Heart failure signs such as elevated jugular venous pressure, pulmonary crackles and peripheral edema were defined according to the most recent ESC guidelines.14 Electrocardiographic signs of myocardial fibrosis, such as Q waves and fragmented QRS complexes were analyzed. Fragmented QRS complexes were defined according to previous studies15: various RSR′ patterns with or without a Q wave, with >2 R waves (R′) or >2 notches in the R wave, or >2 notches in the downstroke or upstroke of the S wave, in two contiguous leads. Late gadolinium enhancement (LGE) on CMR was also recorded.
Statistical analysisVariables are expressed as mean ± standard deviation, median and interquartile range (IQR), or count and percentage (%), as appropriate. Normality was tested using the Shapiro-Wilk test.
Patients with and without SCD or an equivalent event were compared. Comparisons between the two groups were performed using the Student's t test for continuous variables or the chi-square test for categorical variables. Due to the presence of several variables with missing values, only complete cases were included in the comparative analysis. All potential predictors of the endpoint identified from univariate analysis with a p-value <0.100 were used in the Cox proportional hazards models. For continuous variables, the statistical significance was determined, and the most significant cut-off value (receiver operating characteristic [ROC] curve cut-off point with more than 70% for both sensitivity and specificity) was used in the subsequent multivariate analysis. A risk model for prediction of SCD or equivalent was proposed. The probability (or predicted risk) of SCD (PSCD) at five years for an individual HCM patient was calculated using the following equation, derived from the Cox proportional hazards model: PSCD at five years=1-S0(t)exp(prognostic index), where S0(t) is the average survival probability at time t (i.e. at five years), and the prognostic index, also known as the risk model, is the sum of the products of the predictors and their coefficients.
Internal validation of the model was carried out using a bootstrap resampling method and 200 bootstrap samples were generated for each sample, the Cox regression was fitted and bootstrap beta coefficients estimated and 95% confidence intervals (CI) were calculated. Model calibration was assessed by comparing observed five-year event rates with predictions from the Portuguese model. Harrell's C-index16 and the D-statistic were used to measure how well the model discriminated between patients with high and low risk of SCD. Additionally, we calculated the predicted risk (C-index and D-statistic) for the ESC model in a subgroup of patients for whom complete data were available on the eight risk factors used to calculate the ESC SCD risk score. A C-index of 0.5 indicates no discrimination and a value equal to 1 indicates perfect discrimination. A model with no discriminatory ability will produce a value of 0 for the D-statistic, with increasing values indicating greater separation.
The net benefit of assessment by the new prediction model was used assess clinical usefulness. Net benefit was determined through decision curve analysis, which was obtained from the difference between the proportion of true positives and the proportion of false positives weighted by the odds of the selected threshold for high-risk designation, through the following equation: net benefit=[(true positives/n)-(false positives/n)*threshold probability/(1-threshold probability)] (n: total sample size).
All analyses of model development were performed using IBM SPSS version 19.0 (IBM SPSS Inc., Chicago, IL). A two-sided p-value <0.05 was considered statistically significant. Statistical analyses for model validation were carried out in R, version 3.5.0 (R Foundation for Statistical Computing, Vienna, Austria).
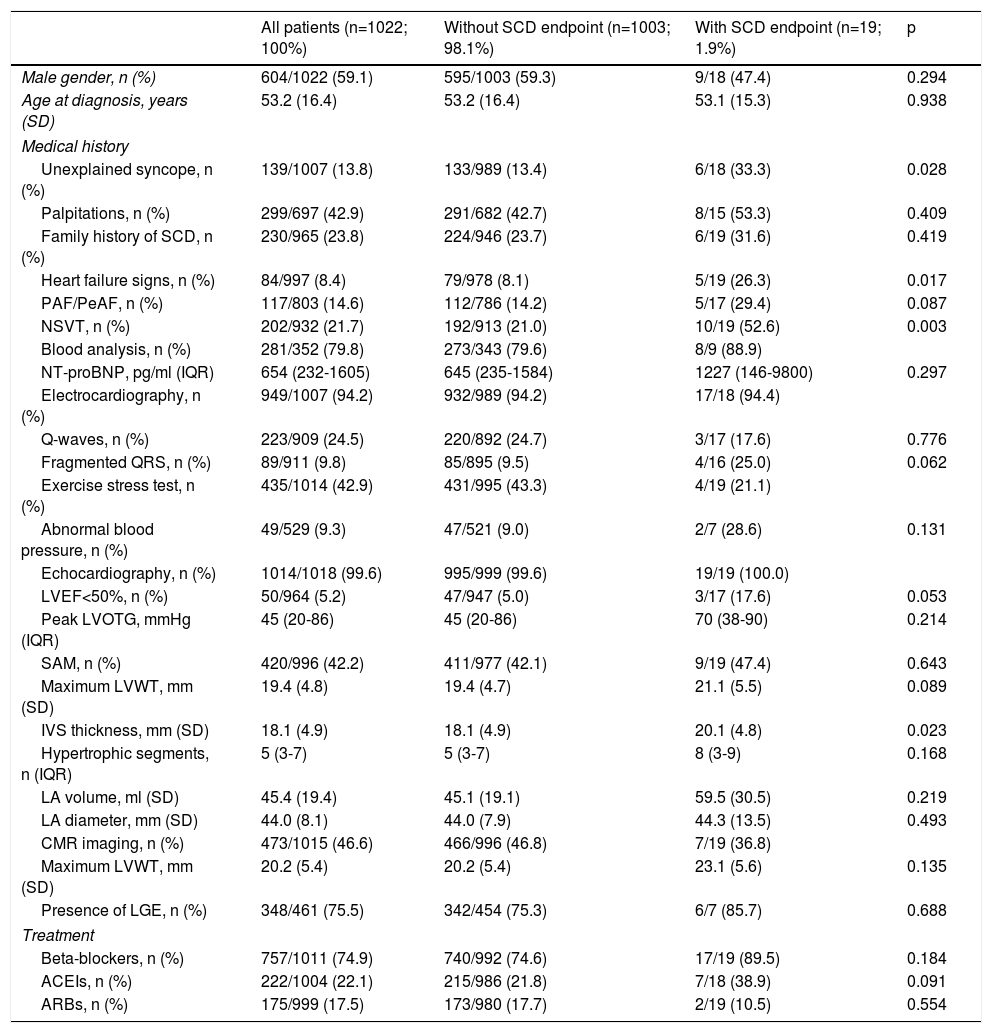
ResultsThe characteristics of the patient cohort, including clinical, electrocardiographic, echocardiographic, CMR and treatment data, are summarized in Table 1. The mean age at diagnosis for the entire cohort was 53.2±16.4 years and 59.1% were male. During a median five-year follow-up, 19 of 1022 patients (1.9%) had SCD (n=7) or an equivalent event (n=12).
Baseline characteristics of the study population with hypertrophic cardiomyopathy.
| All patients (n=1022; 100%) | Without SCD endpoint (n=1003; 98.1%) | With SCD endpoint (n=19; 1.9%) | p | |
|---|---|---|---|---|
| Male gender, n (%) | 604/1022 (59.1) | 595/1003 (59.3) | 9/18 (47.4) | 0.294 |
| Age at diagnosis, years (SD) | 53.2 (16.4) | 53.2 (16.4) | 53.1 (15.3) | 0.938 |
| Medical history | ||||
| Unexplained syncope, n (%) | 139/1007 (13.8) | 133/989 (13.4) | 6/18 (33.3) | 0.028 |
| Palpitations, n (%) | 299/697 (42.9) | 291/682 (42.7) | 8/15 (53.3) | 0.409 |
| Family history of SCD, n (%) | 230/965 (23.8) | 224/946 (23.7) | 6/19 (31.6) | 0.419 |
| Heart failure signs, n (%) | 84/997 (8.4) | 79/978 (8.1) | 5/19 (26.3) | 0.017 |
| PAF/PeAF, n (%) | 117/803 (14.6) | 112/786 (14.2) | 5/17 (29.4) | 0.087 |
| NSVT, n (%) | 202/932 (21.7) | 192/913 (21.0) | 10/19 (52.6) | 0.003 |
| Blood analysis, n (%) | 281/352 (79.8) | 273/343 (79.6) | 8/9 (88.9) | |
| NT-proBNP, pg/ml (IQR) | 654 (232-1605) | 645 (235-1584) | 1227 (146-9800) | 0.297 |
| Electrocardiography, n (%) | 949/1007 (94.2) | 932/989 (94.2) | 17/18 (94.4) | |
| Q-waves, n (%) | 223/909 (24.5) | 220/892 (24.7) | 3/17 (17.6) | 0.776 |
| Fragmented QRS, n (%) | 89/911 (9.8) | 85/895 (9.5) | 4/16 (25.0) | 0.062 |
| Exercise stress test, n (%) | 435/1014 (42.9) | 431/995 (43.3) | 4/19 (21.1) | |
| Abnormal blood pressure, n (%) | 49/529 (9.3) | 47/521 (9.0) | 2/7 (28.6) | 0.131 |
| Echocardiography, n (%) | 1014/1018 (99.6) | 995/999 (99.6) | 19/19 (100.0) | |
| LVEF<50%, n (%) | 50/964 (5.2) | 47/947 (5.0) | 3/17 (17.6) | 0.053 |
| Peak LVOTG, mmHg (IQR) | 45 (20-86) | 45 (20-86) | 70 (38-90) | 0.214 |
| SAM, n (%) | 420/996 (42.2) | 411/977 (42.1) | 9/19 (47.4) | 0.643 |
| Maximum LVWT, mm (SD) | 19.4 (4.8) | 19.4 (4.7) | 21.1 (5.5) | 0.089 |
| IVS thickness, mm (SD) | 18.1 (4.9) | 18.1 (4.9) | 20.1 (4.8) | 0.023 |
| Hypertrophic segments, n (IQR) | 5 (3-7) | 5 (3-7) | 8 (3-9) | 0.168 |
| LA volume, ml (SD) | 45.4 (19.4) | 45.1 (19.1) | 59.5 (30.5) | 0.219 |
| LA diameter, mm (SD) | 44.0 (8.1) | 44.0 (7.9) | 44.3 (13.5) | 0.493 |
| CMR imaging, n (%) | 473/1015 (46.6) | 466/996 (46.8) | 7/19 (36.8) | |
| Maximum LVWT, mm (SD) | 20.2 (5.4) | 20.2 (5.4) | 23.1 (5.6) | 0.135 |
| Presence of LGE, n (%) | 348/461 (75.5) | 342/454 (75.3) | 6/7 (85.7) | 0.688 |
| Treatment | ||||
| Beta-blockers, n (%) | 757/1011 (74.9) | 740/992 (74.6) | 17/19 (89.5) | 0.184 |
| ACEIs, n (%) | 222/1004 (22.1) | 215/986 (21.8) | 7/18 (38.9) | 0.091 |
| ARBs, n (%) | 175/999 (17.5) | 173/980 (17.7) | 2/19 (10.5) | 0.554 |
ACEIs: angiotensin-converting enzyme inhibitors; AF: atrial fibrillation; ARBs: angiotensin receptor blockers; CMR: cardiac magnetic resonance; IQR: interquartile range; IVS: interventricular septum; LA: left atrial; LGE: late gadolinium enhancement; LVEF: left ventricular ejection fraction; LVOTG: left ventricular outflow tract gradient at rest or with Valsalva; LVWT: left ventricular wall thickness; NSVT: non-sustained ventricular tachycardia; NT-proBNP: N-terminal pro-brain natriuretic peptide; PAF: permanent atrial fibrillation; PeAF: persistent atrial fibrillation; SAM: systolic anterior motion of the mitral valve; SCD: sudden cardiac death; SD: standard deviation.
Results are presented as mean (standard deviation), median (interquartile range) or count (percentage) as appropriate.
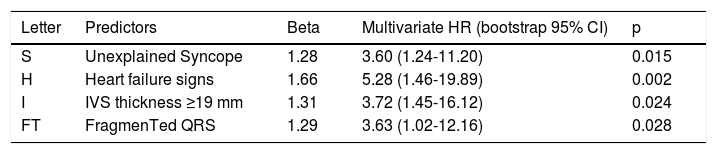
Variables identified with p<0.100 in univariate analysis were included in the multivariate Cox proportional hazards analysis. The model identified four categorical variables as potential predictors of SCD or equivalent (Table 2). The new proposed risk model (SHIFT model) is an acronym for these four variables: unexplained Syncope, Heart failure signs, Interventricular septum thickness ≥19 mm and FragmenTed QRS complex. The predicted five-year risk of SCD (PSCD) for an individual HCM patient can be calculated from the following equation: PSCD at five years=1-0.9695exp (prognostic index), where prognostic index=1.663211×Heart failure signs+1.281165×unexplained Syncope+1.289594×FragmenTed QRS complex+1.312358×Interventricular septum thickness ≥19 mm.
Independent predictors of sudden cardiac death or equivalent, composing the SHIFT model.
| Letter | Predictors | Beta | Multivariate HR (bootstrap 95% CI) | p |
|---|---|---|---|---|
| S | Unexplained Syncope | 1.28 | 3.60 (1.24-11.20) | 0.015 |
| H | Heart failure signs | 1.66 | 5.28 (1.46-19.89) | 0.002 |
| I | IVS thickness ≥19 mm | 1.31 | 3.72 (1.45-16.12) | 0.024 |
| FT | FragmenTed QRS | 1.29 | 3.63 (1.02-12.16) | 0.028 |
HR: hazard ratio; IVS: interventricular septum.
The ESC model was applied in a subgroup of patients for whom complete data were available on the eight risk factors used to calculate the ESC SCD risk score (total: 349 patients; low risk group: 331; intermediate risk group: 18; high risk group: 0), of whom eight patients (2.3%) had SCD or an equivalent event during the five-year follow-up.
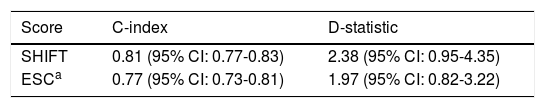
The performance of the derived model was internally validated on the sample created with bootstrap resampling. The estimated beta coefficients and 95% CIs for the bootstrapped model are presented in Table 2. The calibration plot of the SHIFT model is shown in Figure 1, with calibration slope of 0.91 (95% CI: 0.74-1.07). The C-index was 0.81 (95% CI: 0.77-0.83) for SHIFT and 0.77 (95% CI: 0.73-0.81) for the ESC model (p=0.246, z: -1.160). The D-statistic was 2.38 (95% CI: 0.95-4.35) for the SHIFT and 1.97 (95% CI: 0.82-3.22) for the ESC model (Table 3). Through ROC curve analysis, a SHIFT score of 1.49 was the best cut-off above which the model recommends ICD implantation (a SHIFT score >1.49 has a sensitivity of 68.8% and a specificity of 83.1% in predicting SCD or equivalent events).

C-index and D-statistics (95% confidence intervals) for the SHIFT and ESC models.
| Score | C-index | D-statistic |
|---|---|---|
| SHIFT | 0.81 (95% CI: 0.77-0.83) | 2.38 (95% CI: 0.95-4.35) |
| ESCa | 0.77 (95% CI: 0.73-0.81) | 1.97 (95% CI: 0.82-3.22) |
Decision curve analysis showed the value of the SHIFT model. The results are presented as a graph with the selected threshold probability between 0.01 (1%) and 0.26 (26%) plotted on the x axis and the net benefits of models (SHIFT model, treat all model or treat none model) on the y axis (Figure 2). The SHIFT model presents higher net benefit values between 0.01 (1%) and 0.06 (6%). Knowing the net benefit, we can also calculate the reduction in the number of ICDs implanted per 100 patients using the formula: 100× (net benefit of the SHIFT model-net benefit of treat all)/[threshold probability/(1-threshold probability)]. For example, considering a threshold probability of 5%, the reduction in the number of ICDs implanted is 54, meaning that there are 54 fewer false positives per 100 patients.
 or equivalent. The dotted line represents the net benefit of an implantable cardioverter-defibrillator (ICD) for patients according to the SHIFT prediction model; the gray line represents the net benefit of providing an ICD for all patients, assuming that all patients would have SCD or equivalent; and the solid line represents the net benefit of an ICD to no patients, assuming that none would have SCD or equivalent.")
Decision curve analysis of the SHIFT model in predicting sudden cardiac death (SCD) or equivalent. The dotted line represents the net benefit of an implantable cardioverter-defibrillator (ICD) for patients according to the SHIFT prediction model; the gray line represents the net benefit of providing an ICD for all patients, assuming that all patients would have SCD or equivalent; and the solid line represents the net benefit of an ICD to no patients, assuming that none would have SCD or equivalent.
The present study shows that combining clinical, electrocardiographic and echocardiographic characteristics in HCM patients enables prediction of SCD, aborted SCD or appropriate ICD shock therapy. The SHIFT model is easy to use and does not require complex measurements or calculations since unexplained syncope, heart failure signs, interventricular septum thickness and fragmented QRS complexes are routinely and easily collected variables.
Syncope in HCM is a complex entity since several mechanisms may be responsible for this symptom, including arrhythmias and a primary hemodynamic mechanism. Some of these mechanisms are directly linked to SCD, such as sustained ventricular tachycardia, complete heart block or left ventricular outflow tract obstruction.17 The prognostic significance of unexplained syncope has been widely investigated18,19 and has been identified as a risk factor of SCD in different guidelines.2,20,21 In our study, unexplained syncope was more prevalent in patients with SCD (13.4% vs. 33.3%); similar differences were observed in the HCM Risk-SCD study (13.0% vs. 26.0%).3
HCM patients may present heterogeneous clinical profiles, particularly in terms of signs and symptoms of heart failure, related to left ventricular outflow obstruction, atrial fibrillation, and diastolic and systolic dysfunction.22 Ismail et al.23 identified left ventricular dysfunction as an independent risk factor and a harbinger of increased SCD risk. In our cohort, 8.4% of the population had heart failure signs, which were clearly more prevalent in the SCD group (26.3%), and this variable was an independent predictor of SCD or equivalent.
In our analysis, maximum left ventricular wall thickness and interventricular septum (IVS) thickness were both found to be predictors of the endpoint in univariate analysis (p<0.100). Nevertheless, in multivariate analysis only IVS thickness was an independent predictor, the most predictive cut-off value being ≥19 mm (p=0.024). The degree of hypertrophy and left ventricular outflow tract obstruction are directly related to the risk of SCD and progression of heart failure, and are strong and independent predictors of prognosis.11,24–27
The SHIFT model also considers fragmented QRS as an independent predictor of SCD or equivalent. Fragmented QRS complexes have been associated with myocardial fibrosis,13,28,29 which leads to myocardial scar-related heart failure and arrhythmic events.30 Fragmented QRS has also been associated with HCM Risk-SCD score >4% and increased ventricular arrhythmias in HCM patients.31 Moreover, myocardial fibrosis identified by LGE-CMR is a known predictor of SCD in HCM patients.5,23,32 From this standpoint, the inclusion of fragmented QRS complexes in the proposed risk model provides additional information to assess SCD event risk among HCM patients, and indirectly signifies the presence of fibrosis. It should be noted that the small number of patients who underwent CMR in our study (n=473, 46.3%) may explain why the presence of LGE on CMR imaging was not an independent predictor of SCD.
Our proposed risk prediction model has good discrimination, with a C-index of 0.81 and a D-statistic of 2.38. It is interesting to note that the C-index for the ESC model (0.77) was similar to those obtained from HCM Risk-SCD validation (0.70 [95% CI: 0.68-0.72]).3 A direct comparison between the SHIFT and ESC models was not feasible, as only a small subgroup of patients had complete data for the eight risk factors used to calculate the ESC SCD risk score.
Based on ROC curve analysis and with a cut-off of 1.49, the SHIFT model has the potential to improve patient management by simultaneously minimizing the number of unnecessary and potentially harmful ICD implantations in patients who will not suffer SCD (specificity 83.1%) while accurately identifying the majority of those who will suffer SCD and are most likely to benefit from an ICD (sensitivity 68.8%).
On this basis, the SHIFT model may complement clinical decisions by providing additional and objective prognostic information. In particular, it can be applied to patients whose risk remains uncertain after consideration of conventional risk factors.
LimitationsSome characteristics of our study should be borne in mind when interpreting its findings. Firstly, the small number of endpoints (n=19) observed in the study may have had an impact on the results. The low number of events could be explained by the low risk levels of the population included in PRo-HCM. In fact, when the ESC model was applied, no patient had a high risk score. Nevertheless, we should take into account that only a small subgroup of patients (n=349) were analyzed, as a significant quantity of missing data compromised the applicability of the ESC model.
Second, compared with prospective cohort studies, registries have limitations regarding detailed analyses of specific scientific questions, but they are of great value in providing real-world data.
In view of these limitations, our proposed risk model should be further validated in additional and larger patient populations.
ConclusionThe SHIFT model appears to be a promising tool to assess the probability of SCD, aborted SCD or appropriate ICD shock therapy in HCM patients. It may potentially provide additional prognostic value and can be helpful when deciding to implant an ICD for primary prevention.
Conflicts of interestThe authors have no conflicts of interest to declare.
