


Transcatheter aortic valve implantation (TAVI) is associated with cardiac electrical disturbances. However, beyond the risks of pacemaker implantation, few studies have performed a detailed assessment of the effects of TAVI on several cardiac electrical properties.
ObjectivesTo assess the frequency and type of electrocardiographic disturbances following TAVI, according to the type of prostheses and to assess predictors of these disturbances.
MethodsWe performed a detailed retrospective analysis of all electrocardiograms in patients who underwent TAVI, before and after the procedure, at a tertiary center from August 2007 to October 2016. Patients with permanent pacemakers were excluded.
ResultsWe included 182 patients (78±8 years; 56% female) and self-expanding prostheses (SEP) were implanted in 54%. Most patients (80%) were in sinus rhythm at baseline. After TAVI, 21% of patients developed new-onset atrial fibrillation and there was a significant increase in PR interval at discharge (186±41 ms vs. 176±32; p=0.003), which was not maintained after at six-month follow-up (181±35 ms, p=0.06). There was also a significant increase in QRS duration at discharge (129±28 ms vs. 114±25 at baseline p<0.0001), which persisted at six-months (122±28 ms, p<0.0001). New-onset left-bundle branch block (LBBB) was observed in 25% of patients. The depth of valve implantation was a predictor of new LBBB at discharge after multivariate analysis (OR 37.6, 95% CI 14.6–65.2, p=0.001).
ConclusionsThe main electrocardiographic disturbances post TAVI were PR prolongation, increased QRS and new-onset LBBB. These disturbances were more pronounced in patients undergoing SEP implantation and tended to improve at six-month follow-up. The depth of valve implantation was a predictor of conduction disturbances.
A implantação percutânea de prótese aórtica (TAVI) associa-se a alterações da condução elétrica cardíaca. Contudo, à exceção do risco de implantação de pacemaker definitivo, poucos estudos avaliaram os efeitos da TAVI nas propriedades elétricas.
ObjetivosAvaliar a frequência e o tipo de alterações elétricas após a TAVI, consoante o tipo de prótese; avaliar os preditores destas alterações.
MétodosAnálise retrospetiva dos electrocardiogramas, antes e após TAVI, num centro terciário entre agosto/2007 e outubro/2016. Os doentes com pacemaker permanente foram excluídos.
ResultadosIncluídos 182 doentes (78±8 anos; sexo feminino 56%) e em 54% destes implantadas próteses autoexpansíveis. Antes do procedimento, 80% dos doentes estavam em ritmo sinusal. Após a TAVI, 21% tiveram fibrilhação auricular de novo e houve aumento significativo do intervalo PR à alta (186±41 ms versus 176±32; p=0,003), que não persistiu aos seis meses (181±35 ms, p=0,06). Houve aumento significativo da duração do complexo QRS à alta (129±28 ms versus 114±25; p<0,0001), que persistiu aos seis meses (122±28 ms, p<0,0001). Em 25% dos doentes verificou-se bloqueio de ramo esquerdo de novo (BRE). A profundidade de implantação da prótese no trato de saída do ventrículo esquerdo foi preditora de BRE à alta pela análise multivariada (OR 37,6, 95% CI 14,6–65,2, p=0,001).
ConclusõesAs principais alterações elétricas cardíacas após a TAVI foram o prolongamento do intervalo PR, aumento do QRS e BRE de novo. Estas alterações foram mais acentuadas nos doentes com próteses autoexpansíveis e houve tendência para a melhoria aos seis meses. A profundidade de implantação da prótese foi preditora de BRE.
Aortic stenosis (AS) is the most common primary heart valve disease requiring intervention in Western countries, but its prevalence will increase exponentially due to the population ageing.1,2 In the last 10 years, transcatheter aortic valve implantation (TAVI) has emerged as a safe and effective treatment in patients with severe AS considered inoperable or at high surgical risk.3,4 More recently, new randomized trials have broadened the clinical indications for the procedure, demonstrating its efficacy also in intermediate risk5,6 and low risk7 patients. Since the introduction of this technology to clinical practice, more than 300 000 patients have been treated, but these figures are likely to increase dramatically in the future.8,9
It is known that TAVI can induce cardiac electrical disturbances of varying severity. The incidence of these disturbances and need for permanent pacemaker implantation (pPM) may be influenced by valve type. Self-expanding prostheses (SEP) were associated with higher rates of electrical disturbances compared to balloon-expandable prostheses (BEP).10 Most studies have reported a significant rate of high-grade atrioventricular (AV) block and new-onset left bundle branch block (LBBB) following TAVI, which frequently requires pPM.10,11 Fewer studies have evaluated the effect of TAVI on cardiac electrical properties in patients without the need for pacemaker implantation. The role of these electrical disturbances following TAVI is not fully understood and may have a prognostic impact. As the use of TAVI is expanded progressively to lower risk patients,5,12 the comprehension and monitoring of these electrical disturbances may be useful to personalize the follow-up strategy and to understand which patients can be safely discharged soon after the procedure.
Therefore, in this study we aimed to assess the frequency and type of electrocardiographic disturbances after TAVI at discharge and at six-month follow-up, according to the type of prostheses (SEP vs. BEP). We also sought to determine the main predictors of these electric disturbances.
MethodsStudy populationWe conducted a retrospective review of the medical records of 338 consecutive patients who underwent TAVI from August 2007 to October 2016 at Vila Nova de Gaia Hospital Center, Portugal.13,14 We excluded from the analysis patients with pPM (implanted before TAVI or during the follow-up period) and those with unavailable 12-lead electrocardiograms.
A separate sub-analysis was performed according to the type of implanted prosthesis: SEP or BEP. The types of SEP were Medtronic CoreValve Evolut R (Medtronic, Minneapolis, Minnesota), Medtronic Engager Valve (Medtronic, Minneapolis, Minnesota), Symetis Acurate Neo Valve (Symetis, Ecublens VD, Switzerland), St. Jude Medical Portico Valve (St. Jude Medical, St. Paul, Minnesota) and Boston Scientific Lotus Valve (Boston Scientific, Marlborough, Massachusetts). The BEP were Edwards Sapien XT Valve and Edwards Sapien 3 Valve (Edwards Lifesciences, Irvine, California).
All patients were assessed by a multidisciplinary team and the TAVI procedure was decided by consensus. The local ethics board approved the study, which was conducted in accordance with the Declaration of Helsinki.
Electrocardiogram analysisStandard 12-lead electrocardiograms were obtained at hospital admission (within 24 hours before the procedure), on the day of hospital discharge and at six-month follow-up. Electrocardiograms were recorded using standard calibration (10 mm=1 mV, 25 mm/second). The same researcher performed a prospective analysis of all the electrocardiograms and assessed the following parameters: rhythm, heart rate, PR interval, presence and type of AV block, QRS interval, presence of bundle-branch block and corrected QT interval (cQT) using Bazett's formula. All these analyses were performed according to the recommendations for the standardization and interpretation of electrocardiograms.15 The investigator was blinded to the type of implanted prosthesis.
Evaluation with imaging techniquesEchocardiograms were performed and several variables were collected, mean aortic gradient, valvular aortic area, left ventricle ejection fraction and left ventricle end-diastolic diameter.
Cardiac computed tomography was performed and the following variables were collected: aortic valve calcium volume and depth of prosthesis implantation within left ventricular outflow tract (LVOT). Prosthesis implantation depth was assessed before and three months after TAVI and measured as the distance between the annular margin of the non-coronary cusp of the native aortic valve and the ventricular edge of the prosthesis frame, as previously described.16
All these measurements were performed by two independent and experienced cardiologists blinded to clinical data, who reviewed the images separately, using dedicated software for aortic valve assessment (3mensioValvesTM, version 6.1, 3mensio Medical Imaging BV, Bilthoven, the Netherlands). We used the mean values of the two measurements.
Statistical analysisContinuous variables are expressed as mean ± standard deviation or median, as appropriate. Differences were analyzed using the Friedman test for heart rhythm, AV and intraventricular conduction. The Wilcoxon signed-rank test was used for the other variables.
To identify predictors of electric disturbances after TAVI, univariate and multivariate logistic regressions were performed. All variables with a p-value of <0.10 in univariate analysis were entered in the multivariate model. The adequacy of the model was verified using the Hosmer-Lemeshow test. All statistical tests were two-tailed and a p-value of <0.05 was considered statistically significant. All data analyses were performed using the IBM SPSS Statistics for Windows, Version 23.0. Armonk, NY: IBM Corp.
ResultsAt the beginning, a total of 338 patients were analyzed but 56 were excluded because they had a permanent pacemaker before the procedure. After TAVI implantation, 59 patients needed to implant a pacemaker and were also excluded from the analysis (9% of patients with SEP and 8% with BEP). As detailed in Figure 1, 41 patients were lost to follow-up. These patients were transferred to other centers and 6-month electrocardiograms were unavailable.

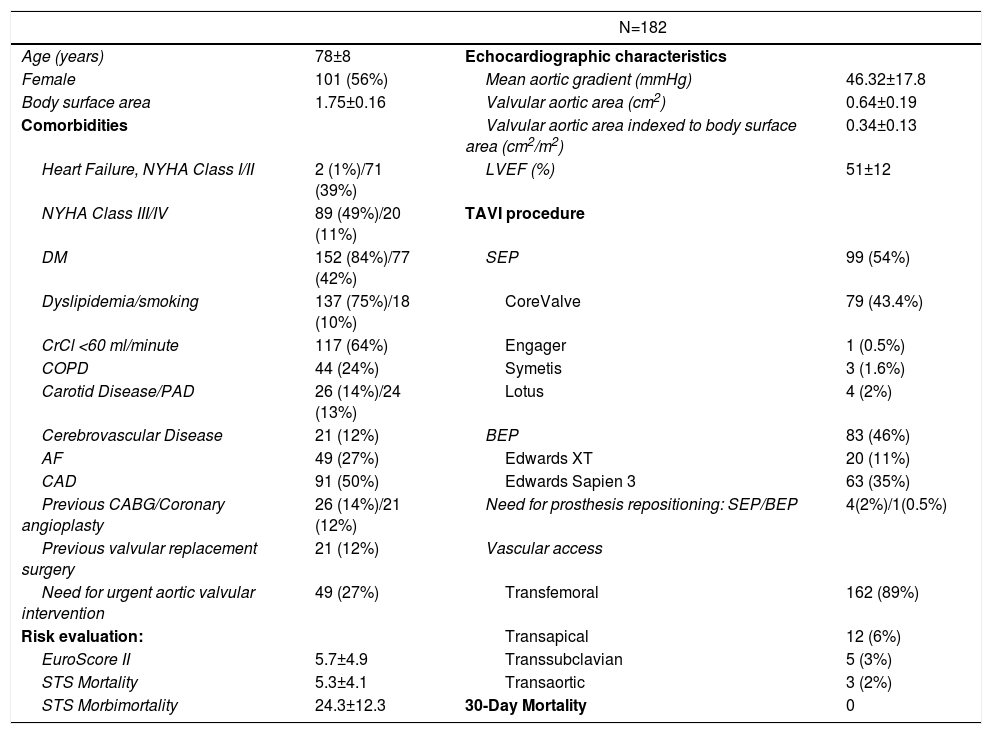
The final analysis included 182 patients with a mean age of 78±8 years, 56% of whom were female. The detailed information about the clinical characteristics of this population is shown in Table 1. SEP was used in 99 patients (54%). Evaluation of electrocardiographic parameters and medication before and after TAVI
Baseline characteristics of the study population.
| N=182 | |||
|---|---|---|---|
| Age (years) | 78±8 | Echocardiographic characteristics | |
| Female | 101 (56%) | Mean aortic gradient (mmHg) | 46.32±17.8 |
| Body surface area | 1.75±0.16 | Valvular aortic area (cm2) | 0.64±0.19 |
| Comorbidities | Valvular aortic area indexed to body surface area (cm2/m2) | 0.34±0.13 | |
| Heart Failure, NYHA Class I/II | 2 (1%)/71 (39%) | LVEF (%) | 51±12 |
| NYHA Class III/IV | 89 (49%)/20 (11%) | TAVI procedure | |
| DM | 152 (84%)/77 (42%) | SEP | 99 (54%) |
| Dyslipidemia/smoking | 137 (75%)/18 (10%) | CoreValve | 79 (43.4%) |
| CrCl <60 ml/minute | 117 (64%) | Engager | 1 (0.5%) |
| COPD | 44 (24%) | Symetis | 3 (1.6%) |
| Carotid Disease/PAD | 26 (14%)/24 (13%) | Lotus | 4 (2%) |
| Cerebrovascular Disease | 21 (12%) | BEP | 83 (46%) |
| AF | 49 (27%) | Edwards XT | 20 (11%) |
| CAD | 91 (50%) | Edwards Sapien 3 | 63 (35%) |
| Previous CABG/Coronary angioplasty | 26 (14%)/21 (12%) | Need for prosthesis repositioning: SEP/BEP | 4(2%)/1(0.5%) |
| Previous valvular replacement surgery | 21 (12%) | Vascular access | |
| Need for urgent aortic valvular intervention | 49 (27%) | Transfemoral | 162 (89%) |
| Risk evaluation: | Transapical | 12 (6%) | |
| EuroScore II | 5.7±4.9 | Transsubclavian | 5 (3%) |
| STS Mortality | 5.3±4.1 | Transaortic | 3 (2%) |
| STS Morbimortality | 24.3±12.3 | 30-Day Mortality | 0 |
Continuous variables reported as mean ± standard deviation. Categorical variables reported as counts and percentages. AF: atrial fibrillation·(paroxysmal or permanent); BEP: balloon-expandable prosthesis; CABG: coronary artery bypass graft; CAD: coronary artery disease; COPD: chronic obstructive pulmonary disease; CrCl: creatinine clearance; DM: diabetes mellitus; LVEF: Left ventricular ejection fraction; NYHA: New York Heart Association heart failure classification; PAD: peripheral arterial disease; SEP: self-expanding prosthesis; TAVI: transcatheter aortic valve implantation.
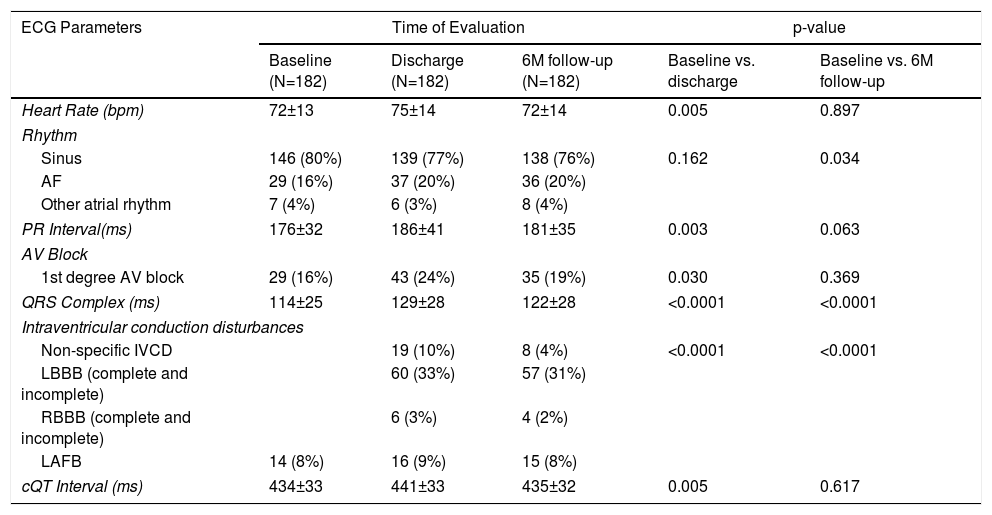
Table 2 provides detailed information on the electrocardiogram parameters recorded at baseline, at hospital discharge and at 6-month follow-up.
Electrocardiographic parameters: Before the procedure, at hospital discharge and at six-month follow-up.
| ECG Parameters | Time of Evaluation | p-value | |||
|---|---|---|---|---|---|
| Baseline (N=182) | Discharge (N=182) | 6M follow-up (N=182) | Baseline vs. discharge | Baseline vs. 6M follow-up | |
| Heart Rate (bpm) | 72±13 | 75±14 | 72±14 | 0.005 | 0.897 |
| Rhythm | |||||
| Sinus | 146 (80%) | 139 (77%) | 138 (76%) | 0.162 | 0.034 |
| AF | 29 (16%) | 37 (20%) | 36 (20%) | ||
| Other atrial rhythm | 7 (4%) | 6 (3%) | 8 (4%) | ||
| PR Interval(ms) | 176±32 | 186±41 | 181±35 | 0.003 | 0.063 |
| AV Block | |||||
| 1st degree AV block | 29 (16%) | 43 (24%) | 35 (19%) | 0.030 | 0.369 |
| QRS Complex (ms) | 114±25 | 129±28 | 122±28 | <0.0001 | <0.0001 |
| Intraventricular conduction disturbances | |||||
| Non-specific IVCD | 19 (10%) | 8 (4%) | <0.0001 | <0.0001 | |
| LBBB (complete and incomplete) | 60 (33%) | 57 (31%) | |||
| RBBB (complete and incomplete) | 6 (3%) | 4 (2%) | |||
| LAFB | 14 (8%) | 16 (9%) | 15 (8%) | ||
| cQT Interval (ms) | 434±33 | 441±33 | 435±32 | 0.005 | 0.617 |
Continuous variables were reported as mean ± standard error and were analyzed using the Wilcoxon test. Categorical variables were reported as counts and percentages and were analyzed using Friedman test. Other supraventricular rhythm: atrial rhythm, atrial flutter and atrial tachycardia.
AF: atrial fibrillation; AV block: atrioventricular block; IVCD: intraventricular conduction disturbances; LAFB: left anterior fascicular block; LBBB: left bundle branch block; RBBB: right bundle branch block; cQT interval: corrected QT interval.
At baseline, most patients (80%) were in sinus rhythm. Although 27% of the patients had a previous history of atrial fibrillation (AF), only 16% were in AF at baseline (Table 2). New-onset AF was observed in 11% at discharge and 10% at 6-month follow-up.
After TAVI, we observed a significant increase in the PR interval (186±41 ms vs. 176±32 ms at baseline, p=0.003), which was no longer significant at the six month follow-up (181±35 ms, p=0.06), as detailed in Figure 2. At discharge, 14 patients (8%) had new-onset first-degree AV block.

There was a significant increase in QRS duration which persisted at the 6 months follow-up (114±25 ms at baseline, 129±28 ms at discharge and 122±28 ms at follow-up, p for trend <0.001), as shown in Figure 3. At discharge, 60 patients (33%) had LBBB, with new-onset in 45 patients (25%). At the six month follow-up, 57 patients (31%) had LBBB, with new-onset in five patients (3%).

Regarding the cQT interval, there was a significant increase at discharge (baseline 434±33 ms vs. discharge 441±33ms, p<0.005), contrary to the follow-up (435±32 ms, p=0.61), as detailed in Figure 4.

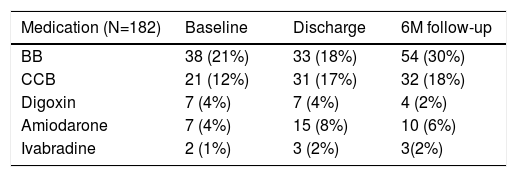
The most common chronotropic negative drugs were beta-blockers, as shown in Table 3. This drug was discontinued in five patients (3%) at discharge. At the six month follow-up, 54 patients (30%) were under beta-blocker therapy.
Medication use among the study population.
| Medication (N=182) | Baseline | Discharge | 6M follow-up |
|---|---|---|---|
| BB | 38 (21%) | 33 (18%) | 54 (30%) |
| CCB | 21 (12%) | 31 (17%) | 32 (18%) |
| Digoxin | 7 (4%) | 7 (4%) | 4 (2%) |
| Amiodarone | 7 (4%) | 15 (8%) | 10 (6%) |
| Ivabradine | 2 (1%) | 3 (2%) | 3(2%) |
BB: beta blockers; CCB: calcium channel blockers.
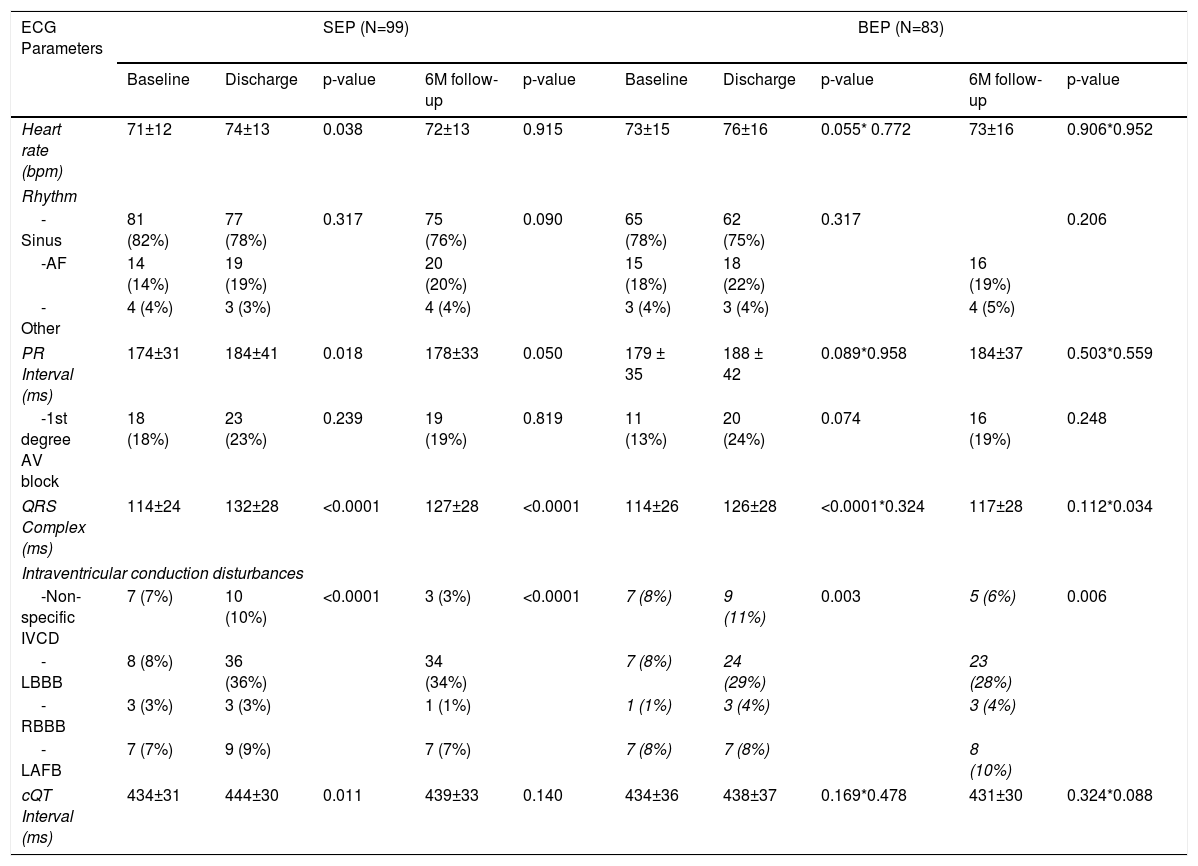
Table 4 shows the electrocardiogram parameters according to the types of prostheses (SEP and BEP) and the comparative analysis of the differences observed.
Electrocardiographic parameters according to the type of aortic prosthesis: before the procedure, at discharge and at six-month follow-up.
| ECG Parameters | SEP (N=99) | BEP (N=83) | ||||||||
|---|---|---|---|---|---|---|---|---|---|---|
| Baseline | Discharge | p-value | 6M follow-up | p-value | Baseline | Discharge | p-value | 6M follow-up | p-value | |
| Heart rate (bpm) | 71±12 | 74±13 | 0.038 | 72±13 | 0.915 | 73±15 | 76±16 | 0.055* 0.772 | 73±16 | 0.906*0.952 |
| Rhythm | ||||||||||
| -Sinus | 81 (82%) | 77 (78%) | 0.317 | 75 (76%) | 0.090 | 65 (78%) | 62 (75%) | 0.317 | 0.206 | |
| -AF | 14 (14%) | 19 (19%) | 20 (20%) | 15 (18%) | 18 (22%) | 16 (19%) | ||||
| -Other | 4 (4%) | 3 (3%) | 4 (4%) | 3 (4%) | 3 (4%) | 4 (5%) | ||||
| PR Interval (ms) | 174±31 | 184±41 | 0.018 | 178±33 | 0.050 | 179 ± 35 | 188 ± 42 | 0.089*0.958 | 184±37 | 0.503*0.559 |
| -1st degree AV block | 18 (18%) | 23 (23%) | 0.239 | 19 (19%) | 0.819 | 11 (13%) | 20 (24%) | 0.074 | 16 (19%) | 0.248 |
| QRS Complex (ms) | 114±24 | 132±28 | <0.0001 | 127±28 | <0.0001 | 114±26 | 126±28 | <0.0001*0.324 | 117±28 | 0.112*0.034 |
| Intraventricular conduction disturbances | ||||||||||
| -Non-specific IVCD | 7 (7%) | 10 (10%) | <0.0001 | 3 (3%) | <0.0001 | 7 (8%) | 9 (11%) | 0.003 | 5 (6%) | 0.006 |
| -LBBB | 8 (8%) | 36 (36%) | 34 (34%) | 7 (8%) | 24 (29%) | 23 (28%) | ||||
| -RBBB | 3 (3%) | 3 (3%) | 1 (1%) | 1 (1%) | 3 (4%) | 3 (4%) | ||||
| -LAFB | 7 (7%) | 9 (9%) | 7 (7%) | 7 (8%) | 7 (8%) | 8 (10%) | ||||
| cQT Interval (ms) | 434±31 | 444±30 | 0.011 | 439±33 | 0.140 | 434±36 | 438±37 | 0.169*0.478 | 431±30 | 0.324*0.088 |
Continuous variables were reported as mean ± standard error and were analyzed using the Wilcoxon test.
Categorical variables were reported as counts and percentages and were analyzed using Friedman test.
AF: atrial fibrillation; AV: atrioventricular; BEP: balloon-expandable prosthesis; IVCD: intraventricular conduction disturbances; LAFB: left anterior fascicular block; LBBB: left bundle branch block; RBBB: right bundle branch block; cQT interval: corrected QT interval; SEP: Self-expanding prosthesis.
At discharge, there was a significant increase in the PR interval in patients with SEP (baseline 174±31 ms vs. discharge 184±41 ms, p=0.01) which did not continue at follow up (178±33 ms, p=0.05). PR interval was not significantly different before and after BEP implantation.
There was a widening of the QRS duration in both groups after TAVI (Table 4). At discharge, SEP group presented higher QRS values (SEP 132±28 ms vs. BEP 126±28 ms, p=0.324) and a higher incidence of new-onset LBBB (16% SEP vs. 9% BEP, p<0.0001).
Although QRS values tended to improve at 6 months follow-up, the improvement was less pronounced in the SEP group (SEP 127±28 ms vs. BEP 117±28 ms, p=0.034).
In five patients (3%), there was a need for prosthesis repositioning; among these patients, one (0.5%) received a SEP and developed new LBBB at discharge, which persisted at the 6-month follow-up.
At discharge, there was a significant increase in the cQT interval in patients with SEP (baseline 434±31 vs. discharge 444±30 ms, p=0.01) which did not persist at follow-up (439±33, p=0.140). cQT interval changes after TAVI with BEP were not statistically significant.
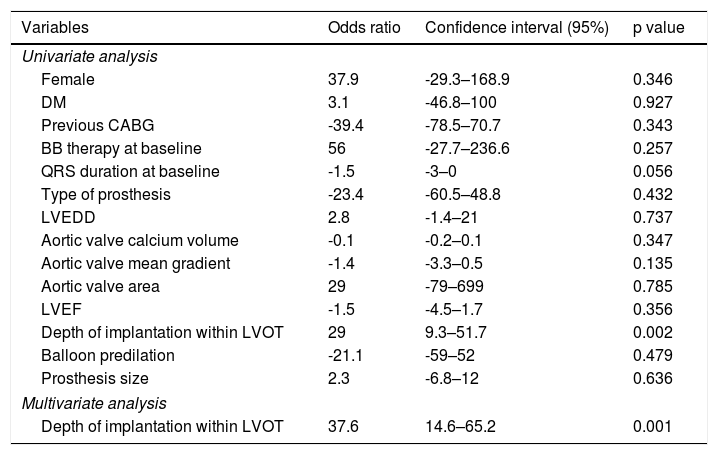
Predictors of electrical disturbancesTable 5 shows analysis of predictors of LBBB at discharge after TAVI.
Univariate and multivariate regression of predictors of LBBB at discharge after TAVI.
| Variables | Odds ratio | Confidence interval (95%) | p value |
|---|---|---|---|
| Univariate analysis | |||
| Female | 37.9 | -29.3–168.9 | 0.346 |
| DM | 3.1 | -46.8–100 | 0.927 |
| Previous CABG | -39.4 | -78.5–70.7 | 0.343 |
| BB therapy at baseline | 56 | -27.7–236.6 | 0.257 |
| QRS duration at baseline | -1.5 | -3–0 | 0.056 |
| Type of prosthesis | -23.4 | -60.5–48.8 | 0.432 |
| LVEDD | 2.8 | -1.4–21 | 0.737 |
| Aortic valve calcium volume | -0.1 | -0.2–0.1 | 0.347 |
| Aortic valve mean gradient | -1.4 | -3.3–0.5 | 0.135 |
| Aortic valve area | 29 | -79–699 | 0.785 |
| LVEF | -1.5 | -4.5–1.7 | 0.356 |
| Depth of implantation within LVOT | 29 | 9.3–51.7 | 0.002 |
| Balloon predilation | -21.1 | -59–52 | 0.479 |
| Prosthesis size | 2.3 | -6.8–12 | 0.636 |
| Multivariate analysis | |||
| Depth of implantation within LVOT | 37.6 | 14.6–65.2 | 0.001 |
BB: beta blocker; CABG: coronary artery bypass graft, DM: diabetes mellitus; LVEDD: left ventricular end-diastolic diameter, LVEF: left ventricular ejection fraction, LVOT: left ventricular outflow tract.
The depth of valve implantation within the LVOT was a predictor of new LBBB at discharge in univariate logistic regression (OR 29, 95% CI 9.3–51.7 per additional mm of implantation depth, p=0.002) and in the multivariate regression (OR 37.6, 95% CI 14.6–65.2, p=0.001; Hosmer-Lemeshow goodness-of-fit test p=0.65). This variable was also a predictor of new LBBB in the SEP group (OR 38, 95% CI 10.5–72.6, p=0.005) but not in the BEP group (OR 14, 95% CI 12.9–48.7, p=0.345). The remaining analysis of predictors of electric disturbances after TAVI was not statistically significant.
DiscussionIn this study of consecutive patients undergoing TAVI implantation, we observed that: 1) TAVI induces several cardiac electrical disturbances such as PR prolongation, increased QRS and prolongation of cQT interval; 2) these disturbances were more pronounced in patients undergoing SEP implantation, but tended to improve at mid-term follow-up; 3) new-onset LBBB was frequent after TAVI and the depth of valve implantation was the most important predictor of conduction disturbances.
Electrical disturbances after TAVIConsidering the proximity of the aortic valve to the conduction system, most of the electrical disturbances following TAVI result primarily from direct mechanical injury to the conduction system, which can result from edema and/or ischemia.17 In this study, the observation that conduction disturbances are more pronounced at discharge compared to follow-up further supports this theory.
It is well known that TAVI prolongs the atrial-His interval and may cause high-degree AV block,18,19 which is transitory in most of the patients without the need for pPM.20–22 In accordance with these observations, our study is one of the few studies20,22 that analyzes systematically AV conduction after TAVI in pPM-free patients and demonstrates generalized PR interval prolongation. Interestingly, we observed that these AV disturbances improve at 6 months follow-up, as also previously described.20,23
Regarding the intraventricular conduction disturbances, we observed that new-onset LBBB occurred in 25% of patients which is in accordance with previous studies that reported an incidence between 4%–65%.10,24–28 Nazif et al.29 analyzed disturbances following TAVI with BEP in 1151 patients without pPM and found an incidence of new LBBB of 10.5%. The variation in incidence of new LBBB can be explained by differences in the type of patients that were included in the studies, the timing of measurement, the type of prothesis that was implanted and the duration of follow-up.
The main rhythm disturbance associated with TAVI implantation is AF, although ventricular arrhythmias can also occur.30,31 We found an incidence of new-onset AF of 11% at discharge and 10% at 6 months. Similar results were reported in a meta-analysis that included sixty-five studies (43 506 patients), which found an incidence of new-onset AF after TAVI of 11% in-hospital and 14% at 1-year follow-up.31 It is known that the prevalence of new-onset AF after surgical aortic valve replacement (SAVR) is much higher, between 15–45%.32,33 The pathophysiological mechanisms of AF after TAVI are still unclear. In severe AS, left atrial dysfunction predicts post-SAVR new-onset AF even in patients with nondilated left atria, as previously described.34 These observations support the theory that post-TAVI AF may be related to underlying left atrium disease and systemic inflammatory response.
The cQT interval represents ventricular repolarization and its increase is associated with the risk of cardiac death.35 Previous studies reported a decrease in QT interval after TAVI,35–37 which is thought to be possibly related to reduction in afterload, increase in coronary flow and early left ventricular mass regression. In the present study, there was an increase of cQT interval at discharge, particularly in patients with SEP. The divergent QT evolution results after TAVI may be related to different methodologies among studies and the significant incidence of ventricular electrical disturbances found in our study. Moreover, other factors such as autonomic neuropathy, electrolyte imbalance and medication, can also lead to QT interval changes.
Regarding the medication used by the study population, beta-blockers were the most common drug. Although many patients presented electrical disturbances, chronotropic negative therapy was continued at discharge and at the six month follow-up, possibly due to the significant prevalence of comorbidities, such as hypertension, heart failure, coronary artery disease and AF.
Electrical disturbances according to the type of prosthesis (SEP versus BEP)The risk of electrical disturbances for SEP and BEP can be different.28 We found a higher incidence of electrical disturbances in the SEP group with no recovery from QRS widening at six months, contrary to the observations in the BEP group. In addition, the risk of new-onset LBBB at discharge was two times more frequent after SEP than BEP. The different design and deployment system associated with the gradual radial force exerted by SEP on the LVOT can contribute to a higher frequency of disturbances.
Most of the previous studies that assessed the influence of prosthesis type on electrocardiogram disturbances did not consider the differences between SEP and BEP38–43 or reported indirect comparisons of studies with different designs.10,28 However, there are two studies which compared the incidence of LBBB according to the type of prosthesis. Franzoni et al. reported similar results to our study, with a 26.5% incidence of LBBB and a higher rate of LBBB persistence at discharge (32.2%) with SEP.26 Houthuizen et al. also reported a more frequent LBBB occurrence and poorer recovery with SEP, although there was a slightly higher incidence of LBBB, 36.8%.27 Our study was performed on a single-center, included more SEP than the CoreValve trial and was conducted in the same European population, while the study from Houthuizen et al. included participants from multiple countries.
Predictors of ECG disturbances following TAVIFemale gender, diabetes, previous coronary bypass grafting and baseline QRS duration were described as predictors of new LBBB.24,44–46 However, in the present series, these variables were not significant.
In our cohort, the depth of valve implantation was an independent predictor of new-onset LBBB at discharge, particularly in the SEP group. This result is in accordance with previous studies, which also reported right bundle branch block, first-degree AV block at baseline, oversizing and eccentricity index as predictors of electrical disturbances after TAVI.44,47–50
It is known that anatomic variations in the AV node and the length of the nonpenetrating portion of the His bundle with respect to the membranous septum were associated with a higher risk of disturbances.10 Multimodal imaging assessment, including echocardiography, angiography and cardiac CT is important for guiding TAVI and preventing electrical disturbances. It may provide information regarding the location of the AV conduction axis relative to the aortic root and the depth of prothesis implantation.51–55
Study limitationsThe main limitations of this study were its retrospective nature and the relatively short follow-up. Because we only analyzed the electrocardiograms before TAVI, at discharge and at the six month follow-up, it was not possible to assess accurately the exact point at which TAVI induces these electrical disturbances and intermittent changes. We also described a significant incidence of LBBB. It has been reported that growing operator experience and the new generation of transcatheter heart valves could reduce the rate of pPM implantation.56 These factors might also reduce electrical disturbances following TAVI.
ConclusionsThe main electrocardiographic disturbances following TAVI were PR prolongation, increased QRS and new-onset LBBB. These disturbances were more pronounced in patients undergoing SEP implantation and tended to improve at the six month follow-up. The depth of valve implantation was a predictor of conduction disturbances.
Conflicts of interestThe authors have no conflicts of interest to declare.
