


Type 1 diabetes (T1D) is a chronic disease with peak incidence in adolescence; it has a major impact on morbidity and mortality, especially cardiovascular. Diabetic cardiomyopathy is characterized by structural and functional lesions in the absence of other diseases and is involved in the progression to heart failure. Echocardiography has led to the identification of early cardiac lesions, despite controversial results in the literature in patients with T1D.
ObjectiveThe objective of this study is to assess cardiac changes in individuals with TD1 compared to the control group using conventional two-dimensional Doppler and advanced speckle tracking echocardiography.
MethodsThis is a case-control study with 40 asymptomatic, normotensive T1D patients aged 20 to 50 years and 40 healthy subjects. Two-dimensional echocardiography was performed to measure myocardial thickness and cardiac chambers. Tissue Doppler echocardiography was used for diastolic analysis and speckle tracking echocardiography to quantify ventricular systolic function.
ResultsThe mean age was 33 years in both groups, with an average T1D duration of 18 years; 20% of patients with T1D had diabetic retinopathy; 12.5% kidney injury; and 10% peripheral neuropathy. There were differences in the left ventricular diastolic function parameters (lateral E’, middle E’ and S/D ratio) and right ventricle (tricuspid E and tricuspid E’/A’ ratio). The mean value of the global longitudinal strain was -21.7% (+- 2.3) in the T1D group and -21.0% (+-2.0) in the control group (p=0.21).
ConclusionEchocardiography revealed a reduction in indices of diastolic function in T1D compared to the control group, which may be the initial cardiac lesion in diabetes.
Diabetes mellitus tipo 1 (DM1) é uma doença crônica com pico de incidência na adolescência. com grande impacto na morbimortalidade. principalmente cardiovascular. A cardiomiopatia diabética caracteriza-se por lesões estruturais e funcionais na ausência de outras doenças; e está implicada na progressão para insuficiência cardíaca. A ecocardiografia tem propiciado a identificação de lesões cardíacas precoces. apesar de resultados controversos na DM1.
ObjetivoAvaliar alterações cardíacas em indivíduos com DM1 em comparação ao controlo (pessoas sem comorbidades) através de ecocardiografia bidimensional convencional com Doppler e avançada com strain por speckle tracking.
MétodosEstudo caso-controlo com 40 pacientes com DM1 de 20 a 50 anos. assintomáticos. normotensos. e 40 controlos. Avaliação ecocardiográfica em modo bidimensional foi realizada para medida de espessura miocárdica e das câmaras cardíacas. uso de Doppler tecidular na análise diastólica e strain por speckle tracking para quantificar a função sistólica ventricular.
ResultadosIdade média foi de 33 anos em ambos os grupos. com duração média da DM1 de 18 anos. 20% dos pacientes com diabetes apresentaram retinopatia diabética; 12.5%. lesão renal; e 10%. neuropatia periférica. Houve diferenças na função diastólica do ventrículo esquerdo (E' lateral. E' médio e relação S/D) e do ventrículo direito (E' tricúspide e relação E'/A' tricúspide). O valor médio do strain global longitudinal foi -21.7% (±2.3) no grupo DM1 e -21.0% (±2.0) no controlo (p=0.21).
ConclusãoA avaliação ecocardiográfica identificou redução nos índices de função diastólica na DM1 em comparação ao controlo. que pode constituir a lesão cardíaca inicial na diabetes.
Diabetic cardiomyopathy is characterized by functional and/or structural changes in the absence of coronary artery disease, hypertension, or significant valvular disease, in individuals with diabetes.1 It is believed that factors such as cardiovascular autonomic neuropathy, activation of the renin-angiotensin-aldosterone system, interstitial myocardial fibrosis, microangiopathy, inflammatory cytokines, and metabolic changes, including hyperglycemia, increased circulating free fatty acids, and triacylglycerols. are involved in its etiopathogenesis. Technological advances have led to several diagnostic methods, especially imaging methods, being used to clarify factors contributing to type 1 diabetes (TD1) and type 2 diabetes (TD2).1–3
Early diagnosis of diabetic cardiomyopathy is clinically useful, since the initial lesions may be reversible.4,5 However, it is still a condition poorly recognized by clinicians, since it may require more sensitive tools for diagnosis, and because of the controversial results of previous studies with different assessment methods and heterogeneous samples.6
The assessment of diastolic dysfunction is essential to understand cardiac function. In simplified terms, it is determined by the change in left ventricular relaxation and increased myocardial stiffness. It is evidenced in cardiomyopathies and is associated with poorer prognosis including mortality and hospitalization for heart failure (HF).7 Diastolic dysfunction is viewed as the initial change in diabetic cardiomyopathy and occurs in 27-69% of asymptomatic patients with diabetes.8
Tissue Doppler is a sensitive method to assess diastolic function and can measure early diastolic velocity (e'). This is one of the main parameters in diastolic assessment as it has higher reproducibility and is associated more with cardiovascular outcomes.7 In TD1, E' velocities and the e'/A' ratio are lower compared to healthy controls.9–11
Although several studies have reported differences in diastolic function assessment parameters between individuals with TD1 and controls, in the long-term follow-up of individuals with TD1, the incidence of diastolic dysfunction in those without hypertension or coronary heart disease was no greater.12 Insulin replacement treatment is being discussed as a possible normalizer of metabolic derangements in hyperglycemia.6
As diabetic cardiomyopathy progresses, there is an increased risk of developing HF. In the context of TD1, there is an association, not only between DM1 and HF but also with glycemic control, age, and disease duration.13
It is argued that diabetic cardiomyopathy presents different phenotypes, one represented by diastolic dysfunction and the other by systolic dysfunction. Both of them lead to HF and are not simply different evolutionary stages.14
The incorporation of new techniques such as myocardial strain echocardiography aims to increase the diagnostic sensitivity of the method, especially in the case of subclinical myocardial dysfunction.15,16 The most commonly used parameter is global longitudinal strain, which refers to the average strain of the myocardial segments in a longitudinal direction. It is more reproducible; can identify subclinical left ventricular (LV) dysfunction, and is considered a better predictor of risk than LV ejection fraction (EF).17,18 Incipient systolic dysfunction has been demonstrated in TD1 by a decrease in the absolute value of myocardial strain.19–23 Other studies have, however, associated decreased myocardial strain values with glycemic control24,25 or the presence of complications such as diabetic nephropathy.26 The literature shows conflicting results for subclinical systolic dysfunction, which could be explained by the heterogeneity of the study population (the presence of comorbidities, glycemic control, sample size, and age).
The present study aims to identify early cardiac lesions secondary to TD1 with conventional two-dimensional Doppler echocardiography and advanced speckle tracking echocardiography.
MethodsThis study is an observational analytical, and case controlled. The sample comprised 42 patients diagnosed with TD1, aged over 18 years, who were in follow-up or had a history of consultation at the endocrinology outpatient clinic. As a control group, 42 individuals without diabetes and without chronic diseases, mostly health professionals and employees of the same hospital, selected based on their age and gender, were included. Participant selection began in July 2018 and ended in August 2019, in accordance with the inclusion and exclusion criteria. To meet ethical requirements, the study was submitted and approved by the ethics committee of the institution (Certificate of Submission for Ethical Appraisal: 24822114.5.0000.0121) as described in Brazilian Health Council Resolution 466/2012. All participants signed the informed consent form prior to their inclusion in the study. In total, there were 80 participants who met the exclusion criteria: (1) hypertension; (2) suspected or diagnosed coronary heart disease through clinical history (symptoms or history of coronary heart disease); (3) major valve injury (valve stenosis or insufficiency classified as mild or worse); (4) previous myocardial dysfunction or diagnosis of cardiomyopathy; (5) history of radio or chemotherapy; (6) alcoholism; (7) limited acoustic window (cases in which more than two myocardial segments could not be visualized); (8) refusal to participate in the study. In each group. two participants were excluded for limited acoustic window.
The clinical and demographic variables of the participants were obtained through the participants’ account of their medical history. This included the following data: age, age at TD1 diagnosis, hypoglycemia episodes per month, history of hospitalization for complications related to TD1, anthropometric data, lifestyle habits, comorbidities, complications of TD1, and use of medications.
The following laboratory tests were collected with an eight to twelve-hour fasting period: (1) hemoglobin (g/dl); (2) fasting glucose (mg/dl); (3) HbA1c (%); (4) creatinine (mg/dl); (5) microalbuminuria or albumin/creatinine ratio or protein/creatinine ratio in isolated urine sample (mg/g); (6) total cholesterol (mg/dl); (7) HDL (mg/dl); (8) triglycerides (mg/dl); (9) LDL (mg/dl); (10) TSH (µg). Creatinine clearance was calculated using the Chronic Kidney Disease Epidemiology Collaboration27 equation.
Echocardiographic evaluation of all patients was performed by a single echocardiographer (TRWS), following the recommendations for quantification of cardiac chambers by the American Society of Echocardiography and European Cardiovascular Imaging Association.28
The images were obtained in the left lateral decubitus position using the GE S6 equipment with a 1.5-3.6 MHz transducer, using the parasternal, apical, subcostal, and suprasternal echocardiographic windows and stored in digital media for future analysis and review.
From the parasternal longitudinal axis, the following measurements were obtained at the end of ventricular diastole: thickness of the interventricular septum (IVS) and LV posterior wall (LVPW). LV diastolic diameter (LVDD) and diameter of the aortic sinuses. Ventricular mass was calculated using the formula 0.8 × 1.04 × [(IVS + LVSD + LVEDD + LVEDD)3 - LVDD3] + 0.6 g. using the linear method with measurements obtained with two-dimensional echocardiography.
LV global systolic function was assessed by ejection fraction using the Simpson method in the apical windows of chambers four and two and peak systolic longitudinal strain two-dimensional speckle tracking echocardiography in the apical windows of chambers three, four and two, to obtain the LV global longitudinal strain (LVLSG). For image acquisition, image quality was optimized, with maximized frame rate (60-90 frames per second), minimized shortening, and the recording of at least three beats during apnea at the end of expiration. For LVLSG analysis, automated functional imaging (AFI) was used (Figure 1).

Global longitudinal strain calculation using two-dimensional speckle tracking, using AFI. In the figure, the global longitudinal strain of the left ventricle obtained was 23.5% in a patient with Type 1 diabetes.
GLPS_Avg: mean global longitudinal peak systolic strain; AVC: aortic valve closure time; HR: heart rate; AFI: automated imaging function.
Analysis of LV diastolic function included the early (E) and late (A) peak diastolic velocities of transmitral flow measured at the end of the mitral valve leaflets; the early (e') and late (a') diastolic velocities recorded by tissue Doppler in the septal and lateral mitral annulus; ratio between E/A velocities of mitral transvalvular flow, ratio between septal and lateral E' velocities/average value; E velocity deceleration time; isovolumetric relaxation interval; systolic (S) and diastolic (D) waves of pulmonary vein flow; left atrial volume indexed by body surface area (BSA) through the average of the volume in the apical 4-chamber and apical 2-chamber sections; S/D-wave ratio of the pulmonary vein flow and velocity of the tricuspid regurgitation jet, if present.
The right ventricle (RV) measurements were obtained in the apical four chamber view focusing on the right ventricle. The RV systolic function was assessed according to the following parameters: tricuspid annulus systolic excursion (TAPSE), systolic variation of RV areas (fractional area change), maximum velocity of the S' wave at tissue Doppler and RV global longitudinal strain with speckle tracking (Figure 2), using the average of the peak systolic longitudinal strain of the three segments of the RV free wall.

Global right ventricular longitudinal strain, obtained by averaging the strain of the three segments of the right ventricular free wall in a patient with type 1 diabetes. In this case, it was estimated at -30.6%. Note: The value shown in the figure considered the septal wall segments for strain calculation.
GLPS_Avg: mean global longitudinal peak systolic strain; AVC: aortic valve closure time; HR: heart rate; AFI: automated imaging function.
RV diastolic function was assessed by E/A ratio, E-wave deceleration time, E/e' ratio, and right atrial volume indexed by BSA.
Statistical analysisThe sample size was estimated at 28 individuals in each group so that a 1% difference in myocardial strain measured with speckle tracking could be detected, when compared to the control, considering a mean value of global longitudinal strain measured by speckle tracking -20.3% with standard deviation 2%.19 For two-tailed testing sample calculation, a significance of 5% and a statistical power of 95% were used.
The Shapiro-Wilk test was performed to assess the normality of the distribution of each variable. Continuous variables were described as mean with standard deviation and were compared using Student's t-test when normally distributed, or Mann-Whitney test when not normally distributed.
Categorical variables were described as percentage or frequency and compared with the chi-square test. The potential predictors of ventricular function were assessed by calculating the correlation coefficients (r2) using the Pearson or Spearman method. All data collected were stored and the statistical calculations were performed in the R-project for Windows, version 3.5.3 (R Foundation).
ResultsThe mean age of the TD1 group was 32.7 ± 8.5 years (20-50 years), and 32.8 ± 7.4 years (23-46 years) (p=0.89) in the control. Regarding gender, 55% of the participants in both groups were women.
Regarding anthropometric data, both groups presented a mean body mass index of 24.8 kg/m². In the TD1 group, 30% of the patients were overweight, and in the control, 37.5% (p=0.77). Obesity was observed in four individuals in each group (10%).
In the TD1 group, the mean age at which TD1 diagnosis occurred was 15±9.1 years (3-38 years) and mean duration of TD1 was 18±9.3 years (two to 38 years). Twenty percent had diabetic retinopathy. 12.5% had evidence of kidney damage due to T1D based on the presence of microalbuminuria or equivalent, and 10% had peripheral neuropathy. The occurrence of hypoglycemia per month was 9.3±10.8 episodes. None of the patients with TD1 were hospitalized in the last year for diabetes-related complications. Mean systolic blood pressure of the patients with TD1 was 109.7 mmHg and of the individuals in the control group 102.3 mmHg (p<0.001), mean diastolic pressure was 63.7 mmHg for the patients with TD1 and 68.6 mmHg in the controls (p=0.001).
Regarding lifestyle habits, of patients with diabetes smoked and 10% were former smokers; in the control group, almost 8% of controls smoked, the rest were non-smokers. Average physical activity was 135±161 minutes per week in the group with TD1 and 141±134 minutes per week in the control group (p=0.86).
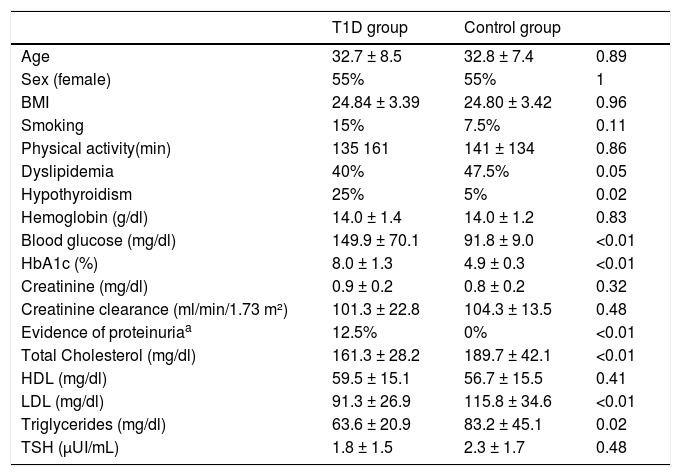
The clinical data and laboratory tests assessed in the study are described in Table 1.
Comparative clinical and laboratory data between the T1D and control group.
| T1D group | Control group | ||
|---|---|---|---|
| Age | 32.7 ± 8.5 | 32.8 ± 7.4 | 0.89 |
| Sex (female) | 55% | 55% | 1 |
| BMI | 24.84 ± 3.39 | 24.80 ± 3.42 | 0.96 |
| Smoking | 15% | 7.5% | 0.11 |
| Physical activity(min) | 135 161 | 141 ± 134 | 0.86 |
| Dyslipidemia | 40% | 47.5% | 0.05 |
| Hypothyroidism | 25% | 5% | 0.02 |
| Hemoglobin (g/dl) | 14.0 ± 1.4 | 14.0 ± 1.2 | 0.83 |
| Blood glucose (mg/dl) | 149.9 ± 70.1 | 91.8 ± 9.0 | <0.01 |
| HbA1c (%) | 8.0 ± 1.3 | 4.9 ± 0.3 | <0.01 |
| Creatinine (mg/dl) | 0.9 ± 0.2 | 0.8 ± 0.2 | 0.32 |
| Creatinine clearance (ml/min/1.73 m²) | 101.3 ± 22.8 | 104.3 ± 13.5 | 0.48 |
| Evidence of proteinuriaa | 12.5% | 0% | <0.01 |
| Total Cholesterol (mg/dl) | 161.3 ± 28.2 | 189.7 ± 42.1 | <0.01 |
| HDL (mg/dl) | 59.5 ± 15.1 | 56.7 ± 15.5 | 0.41 |
| LDL (mg/dl) | 91.3 ± 26.9 | 115.8 ± 34.6 | <0.01 |
| Triglycerides (mg/dl) | 63.6 ± 20.9 | 83.2 ± 45.1 | 0.02 |
| TSH (µUI/mL) | 1.8 ± 1.5 | 2.3 ± 1.7 | 0.48 |
Values presented as mean and respective standard deviation (±) or absolute percentage. Physical activity described in minutes per week (self-reported).
SD: standard deviation; HDL: high density lipoprotein; LDL: low density lipoprotein; TSH: thyroid-stimulating hormone.
Two-dimensional echocardiography demonstrated similar sized heart chambers, with no difference in ventricular mass index and systolic function using the Simpson method. There were no differences in cardiac performance indices such as systolic volume and cardiac output between the groups.
The use of tissue Doppler to assess LV diastolic function showed a reduction in early diastolic velocity (lateral E') and in the mean value of early diastolic velocities (mean E'), and longer deceleration time for E velocity in the TD1 group. Another parameter related to LV diastolic function which differed between the groups (lower in the TD1 group) was the S/D ratio. Indices of RV diastolic function such as tricuspid E' and E'/A' ratio were reduced in the TD1 group compared to control.
The speckle tracking method for quantification of myocardial strain in the LV showed no differences in LV longitudinal global strain between the groups. In the right ventricle, the mean longitudinal global strain was similar in both groups.
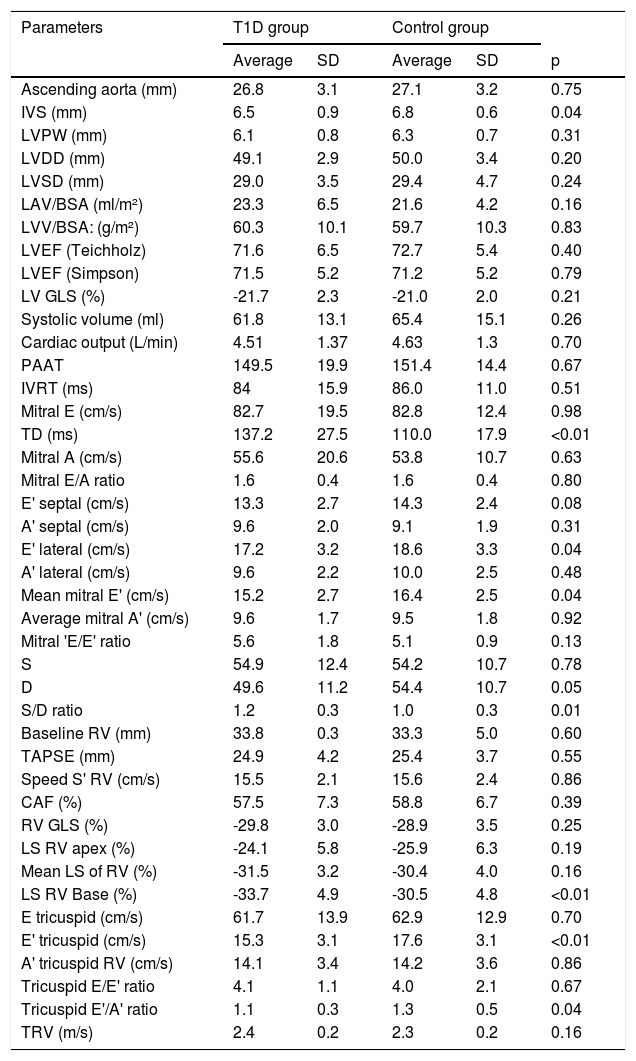
Other echocardiography data collected in the study are described in Table 2.
Echocardiographic data. comparative between T1D and control group.
| Parameters | T1D group | Control group | |||
|---|---|---|---|---|---|
| Average | SD | Average | SD | p | |
| Ascending aorta (mm) | 26.8 | 3.1 | 27.1 | 3.2 | 0.75 |
| IVS (mm) | 6.5 | 0.9 | 6.8 | 0.6 | 0.04 |
| LVPW (mm) | 6.1 | 0.8 | 6.3 | 0.7 | 0.31 |
| LVDD (mm) | 49.1 | 2.9 | 50.0 | 3.4 | 0.20 |
| LVSD (mm) | 29.0 | 3.5 | 29.4 | 4.7 | 0.24 |
| LAV/BSA (ml/m²) | 23.3 | 6.5 | 21.6 | 4.2 | 0.16 |
| LVV/BSA: (g/m²) | 60.3 | 10.1 | 59.7 | 10.3 | 0.83 |
| LVEF (Teichholz) | 71.6 | 6.5 | 72.7 | 5.4 | 0.40 |
| LVEF (Simpson) | 71.5 | 5.2 | 71.2 | 5.2 | 0.79 |
| LV GLS (%) | -21.7 | 2.3 | -21.0 | 2.0 | 0.21 |
| Systolic volume (ml) | 61.8 | 13.1 | 65.4 | 15.1 | 0.26 |
| Cardiac output (L/min) | 4.51 | 1.37 | 4.63 | 1.3 | 0.70 |
| PAAT | 149.5 | 19.9 | 151.4 | 14.4 | 0.67 |
| IVRT (ms) | 84 | 15.9 | 86.0 | 11.0 | 0.51 |
| Mitral E (cm/s) | 82.7 | 19.5 | 82.8 | 12.4 | 0.98 |
| TD (ms) | 137.2 | 27.5 | 110.0 | 17.9 | <0.01 |
| Mitral A (cm/s) | 55.6 | 20.6 | 53.8 | 10.7 | 0.63 |
| Mitral E/A ratio | 1.6 | 0.4 | 1.6 | 0.4 | 0.80 |
| E' septal (cm/s) | 13.3 | 2.7 | 14.3 | 2.4 | 0.08 |
| A' septal (cm/s) | 9.6 | 2.0 | 9.1 | 1.9 | 0.31 |
| E' lateral (cm/s) | 17.2 | 3.2 | 18.6 | 3.3 | 0.04 |
| A' lateral (cm/s) | 9.6 | 2.2 | 10.0 | 2.5 | 0.48 |
| Mean mitral E' (cm/s) | 15.2 | 2.7 | 16.4 | 2.5 | 0.04 |
| Average mitral A' (cm/s) | 9.6 | 1.7 | 9.5 | 1.8 | 0.92 |
| Mitral 'E/E' ratio | 5.6 | 1.8 | 5.1 | 0.9 | 0.13 |
| S | 54.9 | 12.4 | 54.2 | 10.7 | 0.78 |
| D | 49.6 | 11.2 | 54.4 | 10.7 | 0.05 |
| S/D ratio | 1.2 | 0.3 | 1.0 | 0.3 | 0.01 |
| Baseline RV (mm) | 33.8 | 0.3 | 33.3 | 5.0 | 0.60 |
| TAPSE (mm) | 24.9 | 4.2 | 25.4 | 3.7 | 0.55 |
| Speed S' RV (cm/s) | 15.5 | 2.1 | 15.6 | 2.4 | 0.86 |
| CAF (%) | 57.5 | 7.3 | 58.8 | 6.7 | 0.39 |
| RV GLS (%) | -29.8 | 3.0 | -28.9 | 3.5 | 0.25 |
| LS RV apex (%) | -24.1 | 5.8 | -25.9 | 6.3 | 0.19 |
| Mean LS of RV (%) | -31.5 | 3.2 | -30.4 | 4.0 | 0.16 |
| LS RV Base (%) | -33.7 | 4.9 | -30.5 | 4.8 | <0.01 |
| E tricuspid (cm/s) | 61.7 | 13.9 | 62.9 | 12.9 | 0.70 |
| E' tricuspid (cm/s) | 15.3 | 3.1 | 17.6 | 3.1 | <0.01 |
| A' tricuspid RV (cm/s) | 14.1 | 3.4 | 14.2 | 3.6 | 0.86 |
| Tricuspid E/E' ratio | 4.1 | 1.1 | 4.0 | 2.1 | 0.67 |
| Tricuspid E'/A' ratio | 1.1 | 0.3 | 1.3 | 0.5 | 0.04 |
| TRV (m/s) | 2.4 | 0.2 | 2.3 | 0.2 | 0.16 |
SD: standard deviation; A': late diastolic velocity; E': early diastolic velocity; LV GLS: left ventricular global longitudinal strain; GLS: global longitudinal strain; LVPW: left ventricular posterior wall; LAV/BSA: left atrium volume indexed to body surface area; LVDD: left ventricular diastolic diameter; LVSD: left ventricular systolic diameter; SAC: systolic variation of RV areas; LVEF: left ventricular ejection fraction; LVV/BSA: left ventricular volume to body surface area; LS: longitudinal strain; IVS: interventricular septum; PAAT: pulmonary artery acceleration time; TAPSE: tricuspid annular plane systolic excursion; IVRT: isovolumetric relaxation time; RV: right ventricle; TRV: tricuspid regurgitation velocity.
The diastolic function parameter e' mean showed a correlation with HbA1c values and DM duration time (r=-0.33 and -0.41; respectively; p<0.01), and deceleration time, with HbA1c values (r=0.51; p<0.01). There was no correlation between systolic function indices and clinical or laboratory variables.
DiscussionThe use of new imaging techniques for diagnosing diabetic cardiomyopathy has led to more knowledge being gained, due to the identification of lesions earlier, although there results are conflicting,23,26 possibly due to the heterogeneity of the population studied (demographics and their comorbidities).
The purpose of this study was to study the structural and functional cardiac changes associated with diabetic cardiomyopathy, without the interference of other comorbidities that are known to cause cardiac lesions, such as systemic arterial hypertension.18 Also, there were no hospitalizations for diabetes complications in the last year, which could influence the cardiac assessment.
The selected groups were comparable, since they had similar general characteristics: mean age, male and female gender proportion, and body mass index; conditions that determine differences in myocardial strain values.29,30
Regarding microvascular complications, the prevalence of retinopathy was lower than expected for this average TD1 duration.31 This may be explained by the fact that hypertension was a study exclusion criterion and given that the prevalence of retinopathy is related not only to the duration of TD1, but also to glycemic control and blood pressure levels.32 Independently, no association was observed between diabetic retinopathy and the development of cardiovascular disease.33 Regarding kidney injury, defined by evidence of proteinuria, there was a prevalence similar to that described in the literature.34
Echocardiography revealed a reduction in mitral E' values of both the lateral wall and the mean value of E' between the septum and lateral wall, which represents one of the most robust variables in the analysis of LV diastolic function.7 This finding has been observed in other studies.19 There were no cases of LV diastolic dysfunction (using the current algorithm),35 nor was the value outside the normal range for the age range for individuals. However, the reduction in this variable in the TD1 group leads to an assumption of reduction in myocardial relaxation capacity, just as these values also decrease with age.35
There was a difference between two other variables used in the analysis of diastolic function: E-wave deceleration time and the ratio between S (systolic) and D (diastolic) waves. The E-wave deceleration time is related to LV relaxation and distensibility, one of the determining components of LV diastolic function. S-wave velocity is related to left atrial pressure, left atrial contractility, and right ventricular contractility. d-wave velocity is mainly influenced by early LV diastolic filling. Differences in these variables between the TD1 and control groups are a further indication of subclinical LV diastolic dysfunction.7,35 In fact, there was no difference in left atrial volume indexed to BSA between the groups. The latter, a marker of the severity of diastolic dysfunction,36 reflects the cumulative effect of filling pressures over time.37 It is hypothesized that other variables, such as left atrial strain, which is closely associated with left atrial pressure and is being studied in myocardiopathies,38 could contribute to the assessment of these patients.
The mean global LV longitudinal strain found in the control group (-21% ± 2) was similar to the normal values (-21.5% ± 2) presented in the literature when the same software was used.28,39 Another finding consistent with the literature was the difference in the value of the LV global longitudinal strain according to gender, being more negative in females compared to males.29,39 There was no difference in the overall longitudinal strain value between the groups for both LV and RV. With regard to the LV, the absence of differences in ventricular systolic function may be related to the absence of hypertension and other comorbidities such as history of coronary disease in the study population, which may have been a confounding factor in previous studies.8,26 One should also consider that few patients with TD1 had elevated glycemic levels, which could reduce the manifestation of diabetic cardiomyopathy in patients with TD1.24,25
However, a greater longitudinal peak systolic strain was observed in the basal RV segment compared to the control group. This finding was not found in the other right ventricular segments, nor was there a difference in the mean right ventricular myocardial strain (RV global longitudinal strain).
Regarding the right ventricle, a reduction in tricuspid E' waves was demonstrated, which infers a reduction in the right ventricular myocardial relaxation capacity, a parameter used in the assessment of RV diastolic function.40
LimitationsAll echocardiographic examinations were performed only once, so intra- and inter-operator variability could not be assessed; however, good reproducibility of the method is described in the literature, thus permitting the application of these results.41
Although the sample size was adequate to demonstrate the desired difference in both systolic and diastolic function, it would be of interest to assess a larger number of patients to confirm these results. Moreover, there was no follow-up of patients to infer the clinical and echocardiographic evolution, especially of the parameters under study. Another limitation of our study is that despite having been previously determined in the research method, multiple comparisons were performed, increasing the likelihood that some of the differences found were random.
ConclusionEven when comparing asymptomatic people with TD1, there is a difference in the parameters for assessing biventricular diastolic function compared to controls, which may denote a subtle reduction in cardiac function in these patients and possible incipient diabetic cardiomyopathy. However, as for the systolic function of both ventricles, there was no difference between the two groups using speckle tracking.
Funding sourcesThis work was funded by the institution's research education management to pay for the laboratory tests of the control group subjects.
Conflict of interestThe authors declare that they have no conflicts of interest.
Please cite this article as: Weber TR, Silva RLd, Cossul S, Lofrano Alves MS, Lee SVdS, Brum Marques JL. Avaliação ecocardiográfica na diabetes mellitus tipo 1. Rev Port Cardiol. 2021;40:757–765.
