Metabolic syndrome (MS) is an independent predictor of acute cardiovascular events. However, few studies have addressed the relationship between MS and stable angiographic coronary artery disease (CAD), which has a different pathophysiological mechanism. We aimed to study the independent predictors for significant CAD, and to analyze the impact of MS (by the AHA/NHLBI definition) on CAD.
MethodsWe prospectively included 300 patients, mean age 64±9 years, 59% male, admitted for elective coronary angiography (suspected ischemic heart disease), excluding patients with known cardiac disease. All patients underwent assessment of demographic, anthropometric, and laboratory data and risk factors, and subsequently underwent coronary angiography.
ResultsIn the study population, 23.0% were diabetic, 40.5% had MS (and no diabetes) and 36.7% had neither diagnosis. Significant CAD was present in 51.3% of patients. CAD patients were older and more frequently male and diabetic, with increased triglycerides and glucose and lower HDL cholesterol. Abdominal obesity was also less prevalent. MS was not associated with the presence of CAD (OR 0.94, 95% CI 0.59–1.48, p=0.778). Of the MS components, the most important predictors of CAD were increased glucose and triglycerides. Abdominal obesity was associated with a lower risk of CAD. In a multivariate logistic regression model for CAD, independent predictors of CAD were age, male gender, glucose and triglycerides. Body mass index had a protective effect.
ConclusionsAlthough MS is associated with cardiovascular events, the same was not found for stable angiographically proven CAD. Age, gender, diabetes and triglycerides are the most influential factors for CAD, with abdominal obesity as a protective factor.
A síndrome metabólica (SM) é um predizente independente de eventos cardiovasculares agudos. Contudo, pouco estudos analisaram a relação entre SM e doença arterial coronária angiográfica estável (DAC), que apresenta uma diferente mecanismo fisiopatológico. Procurámos identificar os factores predizentes independentes para DAC e analisar o impacto da presença de SM (pela definição da AHA/NHLBI) na DAC.
MétodosAnalisamos prospectivamente 300 indivíduos, com idade media de 64±9 anos, 59% do género masculino, admitidos para angiografia coronária eletiva por suspeita de cardiopatia isquémica, tendo sido excluídos os doentes com antecedentes de doença cardíaca. Todos os doentes foram submetidos a avaliação demográfica, antropométrica, fatores de risco e laboratorial e subsequentemente a coronariografia.
ResultadosNa população do estudo, 23,0% eram diabéticos, 40,5% tinha SM (sem diabetes) e 36,7% nenhum dos anteriores diagnósticos. Verificou-se DAC significativa em 51,3% dos doentes. Estes doentes tinham mais idade, mais do género masculino, diabéticos, com triglicéridos e glicemia aumentados e colesterol-HDL baixo. A obesidade abdominal era também menos prevalente. A SM não se associou com a presença de DAC (OR 0,94, IC 95% 0,59–1,48, p=0,778). Os factores predizentes mais importantes de DAC de entre os componentes de SM foram a glicemia e os triglicéridos aumentados. A obesidade abdominal mostrou menor risco de DAC. Num modelo de regressão logística multivariável para DAC, os factores predizentes independentes foram a idade, género masculino, glicemia, triglicéridos. O Indíce de Massa Corporal mostrou efeito «protector».
ConclusõesApesar da SM se associar a eventos cardiovasculares, o mesmo não se verifica relativamente a DAC angiográfica estável. A idade, género, diabetes e triglicéridos são os factores mais influentes para a presença de DAC, sendo a obesidade abdominal «protectora».
Obesity and metabolic syndrome are major epidemics of the 21st century worldwide.1,2 The best available evidence, from three consecutive large meta-analyses, consistently shows that individuals with metabolic syndrome are at increased risk of cardiovascular events (two-fold increase in cardiovascular outcomes – cardiovascular mortality, myocardial infarction and stroke – and a 1.5-fold increase in all-cause mortality).3–5 They also demonstrated that cardiovascular risk was still high in patients with the metabolic syndrome but without diabetes.
Although the association of metabolic syndrome with cardiovascular events is clear, the association with stable angiographic coronary artery disease (CAD) is less so, the few available studies being based on small samples and showing contradictory results.6–11 In the literature, some authors have assessed the association between metabolic syndrome, diabetes and severity of angiographic CAD in cross-sectional and longitudinal studies, but they either considered one gender or studied ethnicities other than Caucasian, or they did not compare diabetic and non-diabetic individuals. In a larger study of stable CAD patients, the presence of metabolic syndrome identified increased risk of death or myocardial infarction but did not have independent prognostic significance after adjustment for its constituent components. Hypertension, low HDL cholesterol and elevated glucose most strongly predicted events.12
The aim of the present study was to assess the association between metabolic syndrome and angiographic CAD. We also compared individuals with metabolic syndrome and those with diabetes (in whom the association with CAD is clearly established and for some authors is responsible for the metabolic syndrome's impact on cardiovascular outcomes) and with a control group with neither diagnosis (“Normal” group).
MethodsThis was an observational cross-sectional study, with prospective inclusion of patients admitted for elective coronary angiography with suspected CAD (stable angina and/or ischemia documented by non-invasive tests). All patients were aged ≥18 years. Patients with previous acute coronary syndrome, myocardial revascularization procedure, valvular heart disease, congenital heart disease or cardiomyopathy were excluded from the study. All patients gave their written informed consent and the study protocol conforms to the ethical guidelines of the 1975 Declaration of Helsinki as reflected in prior approval by the local institutional ethics committee.
Anthropometric data were obtained after a 12-hour fast, with the subject in light clothing and barefoot. Body weight was measured to the nearest kilogram using a digital scale, and height to the nearest centimeter in the standing position. Body mass index (BMI) was calculated as weight in kilograms divided by height in meters squared. Waist circumference (WC) was measured to the nearest centimeter, with the subject standing, using a flexible non-stretch tape measure, midway between the lower edge of the rib cage and the iliac crest. Obesity was defined as BMI ≥30kg/m2, overweight as BMI 25–29.9kg/m2, and normal as BMI <25kg/m2.
Blood pressure was measured on several occasions during hospital stay, hypertension being defined by a previous diagnosis of hypertension or the presence of systolic blood pressure ≥140mmHg or diastolic blood pressure ≥90mmHg (mean of two consecutive measurements). Patients who self-reported as having smoked during the previous six months were classified as smokers.
A venous blood sample was drawn after a 12-hour overnight fast. All the samples were analyzed at the hospital's central laboratory. Serum glucose, total cholesterol and triglycerides were determined using standard automatic enzymatic methods. HDL cholesterol was determined after specific precipitation and LDL cholesterol was determined by the Friedewald formula. Blood insulin was determined by electrochemiluminescence.
The metabolic syndrome was defined by the most recent definition from the American Heart Association/National Heart, Lung and Blood Institute (AHA/NHLBI), consisting of ≥3 of the following criteria: fasting glucose ≥100mg/dl or antidiabetic treatment; blood pressure ≥130/85mmHg or antihypertensive medication; triglycerides ≥150mg/dl or specific treatment for this lipid abnormality; HDL cholesterol <50mg/dl in women and <40mg/dl in men or specific treatment for this lipid abnormality; WC ≥88cm in women and ≥102cm in men.13 Diabetes was recorded by the investigator based on patient history, increased glucose (fasting level ≥126mg/dl), or concomitant use of specific therapies.
Coronary angiography was performed by the standard Judkins technique. The coronary angiograms were analyzed using quantitative coronary angiography software, Cardiovascular Measurement System (QCA-CMS) version 6.0 (Medis Medical Imaging Systems, Leiden, The Netherlands) by a single operator blinded to the diagnosis. An automated edge detection algorithm determined vessel centerline and contour, and absolute reference vessel and minimum lumen diameters were determined using the calibration factor. Percentage stenosis was calculated from minimum lumen diameter and a normal reference value obtained as an extrapolation of the proximal and distal segments surrounding the stenosis. Obstructive CAD was defined as stenosis of 50% or more in any coronary vessel. The severity of CAD was assessed by the Gensini score, a previously validated method, which grades narrowing of the coronary artery lumen as: 1 for 1–25% narrowing, 2 for 26–50% narrowing, 4 for 51–75% narrowing, 8 for 76–90% narrowing, 16 for 91–99% narrowing and 32 for total occlusion.14 This score was then multiplied by a factor from 0.5 to 5 that takes into account the importance of the lesion's position in the coronary arterial tree.
The interclass correlation coefficients for intrareader reproducibility were 0.950 for Gensini score and 0.724 to 0.947 for vessel dimension (analyzed for different vessels), which suggests good agreement beyond chance.
Statistical analysisThe statistical analysis was conducted using PASW Statistics 18.0 (SPSS Inc, IL, Chicago, USA). A p-value <0.05 was considered statistically significant.
Quantitative variables were expressed as mean±standard deviation if normally distributed and as median and inter-quartile range otherwise. Qualitative variables are described as percentages. The Student's t test or the Mann–Whitney U-test were used for between-group comparisons of continuous variables (according to distribution characteristics). For comparisons of more than two groups, the one-way ANOVA test or the Kruskal–Wallis test was used, as appropriate. The chi-square test was used for between-group comparisons of categorical variables. For some continuous highly skewed variables a base 10 logarithmic transformation was performed that was used in the subsequent analysis. Blood glucose required a natural logarithmic transformation to improve normality. Bivariate logistic regression analysis was used to identify independent risk factors for CAD. Backward multivariate logistic regression analysis (with CAD as the outcome variable) was performed to determine independent predictors of CAD. All variables with a p-value <0.10 in bivariate analysis were included in the analysis.
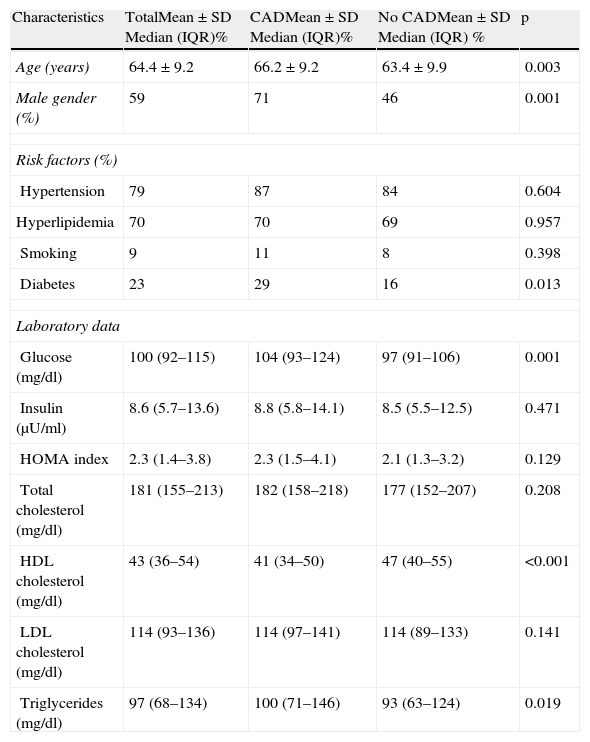
ResultsA total of 300 patients were included in the study, with a mean age of 64±9 years (aged 38–86 years), 59% male (Table 1). Significant coronary artery disease was present in 51.3% of patients, but was significantly less prevalent in women (35.8% vs. 62.1%, p<0.001). The Gensini score was also significantly higher in men: 9.5 (5.00–17.75) vs. 6.00 (3.00–10.00), p<0.001. Patients with significant CAD were older, more frequently male and diabetic, and had higher blood glucose and triglycerides and lower HDL cholesterol (Table 1).
Characteristics of the study population by presence of coronary artery disease.
| Characteristics | TotalMean±SD Median (IQR)% | CADMean±SD Median (IQR)% | No CADMean±SD Median (IQR) % | p |
| Age (years) | 64.4±9.2 | 66.2±9.2 | 63.4±9.9 | 0.003 |
| Male gender (%) | 59 | 71 | 46 | 0.001 |
| Risk factors (%) | ||||
| Hypertension | 79 | 87 | 84 | 0.604 |
| Hyperlipidemia | 70 | 70 | 69 | 0.957 |
| Smoking | 9 | 11 | 8 | 0.398 |
| Diabetes | 23 | 29 | 16 | 0.013 |
| Laboratory data | ||||
| Glucose (mg/dl) | 100 (92–115) | 104 (93–124) | 97 (91–106) | 0.001 |
| Insulin (μU/ml) | 8.6 (5.7–13.6) | 8.8 (5.8–14.1) | 8.5 (5.5–12.5) | 0.471 |
| HOMA index | 2.3 (1.4–3.8) | 2.3 (1.5–4.1) | 2.1 (1.3–3.2) | 0.129 |
| Total cholesterol (mg/dl) | 181 (155–213) | 182 (158–218) | 177 (152–207) | 0.208 |
| HDL cholesterol (mg/dl) | 43 (36–54) | 41 (34–50) | 47 (40–55) | <0.001 |
| LDL cholesterol (mg/dl) | 114 (93–136) | 114 (97–141) | 114 (89–133) | 0.141 |
| Triglycerides (mg/dl) | 97 (68–134) | 100 (71–146) | 93 (63–124) | 0.019 |
CAD: coronary artery disease; HOMA: homeostasis model assessment; IQR: interquartile range; SD: standard deviation.
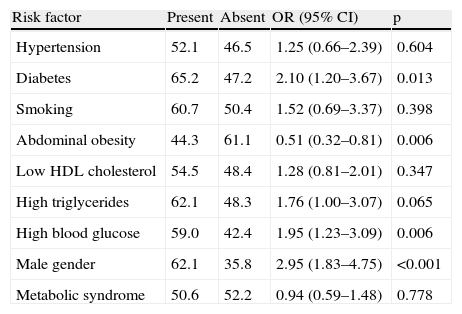
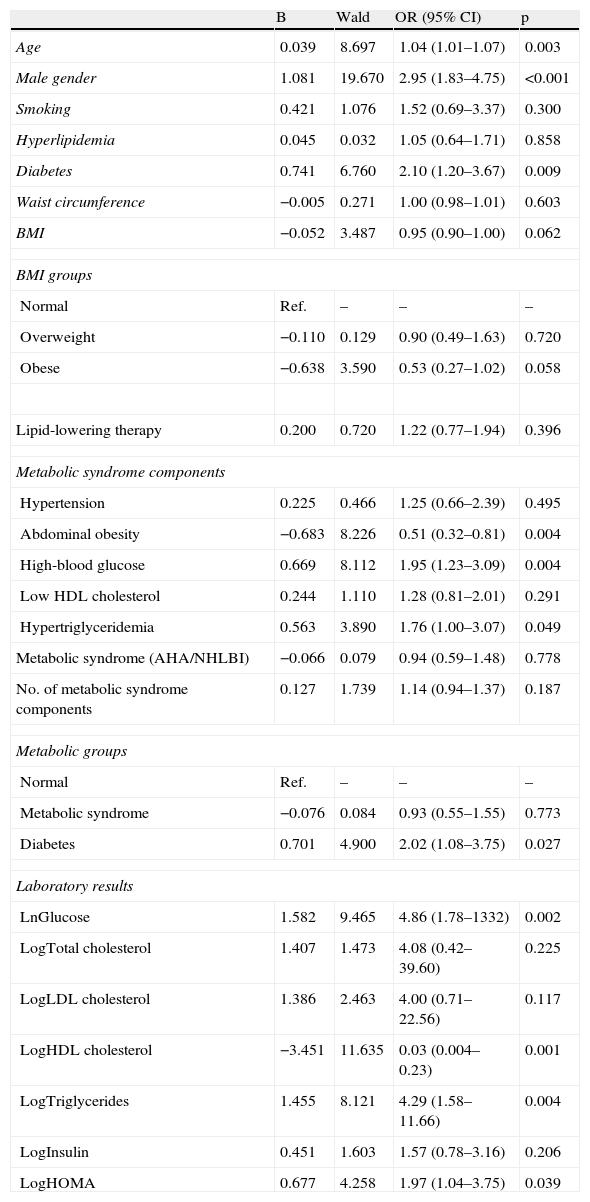
The prevalence of the metabolic syndrome by the AHA/NHLBI definition in the present population was 55.3%. The presence of CAD was associated with diabetes, male gender, older age and increased triglycerides and glucose (Tables 2 and 3). On the other hand, patients with abdominal obesity and increased HDL cholesterol were less likely to have CAD. Lipid-lowering therapy was not associated with lower CAD prevalence. Patients with metabolic syndrome did not have an increased risk of significant CAD. Analyzing the relationship between metabolic syndrome components and CAD prevalence, as well as with Gensini score, we found a non-linear association, because patients with no component present had the lowest prevalence as well as the lowest Gensini score, and patients with five components had the highest values, but no significant difference was found in the intermediate groups (Figures 1 and 2).
Prevalence of coronary artery disease by risk factor.
| Risk factor | Present | Absent | OR (95% CI) | p |
| Hypertension | 52.1 | 46.5 | 1.25 (0.66–2.39) | 0.604 |
| Diabetes | 65.2 | 47.2 | 2.10 (1.20–3.67) | 0.013 |
| Smoking | 60.7 | 50.4 | 1.52 (0.69–3.37) | 0.398 |
| Abdominal obesity | 44.3 | 61.1 | 0.51 (0.32–0.81) | 0.006 |
| Low HDL cholesterol | 54.5 | 48.4 | 1.28 (0.81–2.01) | 0.347 |
| High triglycerides | 62.1 | 48.3 | 1.76 (1.00–3.07) | 0.065 |
| High blood glucose | 59.0 | 42.4 | 1.95 (1.23–3.09) | 0.006 |
| Male gender | 62.1 | 35.8 | 2.95 (1.83–4.75) | <0.001 |
| Metabolic syndrome | 50.6 | 52.2 | 0.94 (0.59–1.48) | 0.778 |
CI: confidence interval; OR: odds ratio.
Bivariate analysis for significant coronary artery disease.
| B | Wald | OR (95% CI) | p | |
| Age | 0.039 | 8.697 | 1.04 (1.01–1.07) | 0.003 |
| Male gender | 1.081 | 19.670 | 2.95 (1.83–4.75) | <0.001 |
| Smoking | 0.421 | 1.076 | 1.52 (0.69–3.37) | 0.300 |
| Hyperlipidemia | 0.045 | 0.032 | 1.05 (0.64–1.71) | 0.858 |
| Diabetes | 0.741 | 6.760 | 2.10 (1.20–3.67) | 0.009 |
| Waist circumference | −0.005 | 0.271 | 1.00 (0.98–1.01) | 0.603 |
| BMI | −0.052 | 3.487 | 0.95 (0.90–1.00) | 0.062 |
| BMI groups | ||||
| Normal | Ref. | – | – | – |
| Overweight | −0.110 | 0.129 | 0.90 (0.49–1.63) | 0.720 |
| Obese | −0.638 | 3.590 | 0.53 (0.27–1.02) | 0.058 |
| Lipid-lowering therapy | 0.200 | 0.720 | 1.22 (0.77–1.94) | 0.396 |
| Metabolic syndrome components | ||||
| Hypertension | 0.225 | 0.466 | 1.25 (0.66–2.39) | 0.495 |
| Abdominal obesity | −0.683 | 8.226 | 0.51 (0.32–0.81) | 0.004 |
| High-blood glucose | 0.669 | 8.112 | 1.95 (1.23–3.09) | 0.004 |
| Low HDL cholesterol | 0.244 | 1.110 | 1.28 (0.81–2.01) | 0.291 |
| Hypertriglyceridemia | 0.563 | 3.890 | 1.76 (1.00–3.07) | 0.049 |
| Metabolic syndrome (AHA/NHLBI) | −0.066 | 0.079 | 0.94 (0.59–1.48) | 0.778 |
| No. of metabolic syndrome components | 0.127 | 1.739 | 1.14 (0.94–1.37) | 0.187 |
| Metabolic groups | ||||
| Normal | Ref. | – | – | – |
| Metabolic syndrome | −0.076 | 0.084 | 0.93 (0.55–1.55) | 0.773 |
| Diabetes | 0.701 | 4.900 | 2.02 (1.08–3.75) | 0.027 |
| Laboratory results | ||||
| LnGlucose | 1.582 | 9.465 | 4.86 (1.78–1332) | 0.002 |
| LogTotal cholesterol | 1.407 | 1.473 | 4.08 (0.42–39.60) | 0.225 |
| LogLDL cholesterol | 1.386 | 2.463 | 4.00 (0.71–22.56) | 0.117 |
| LogHDL cholesterol | −3.451 | 11.635 | 0.03 (0.004–0.23) | 0.001 |
| LogTriglycerides | 1.455 | 8.121 | 4.29 (1.58–11.66) | 0.004 |
| LogInsulin | 0.451 | 1.603 | 1.57 (0.78–3.16) | 0.206 |
| LogHOMA | 0.677 | 4.258 | 1.97 (1.04–3.75) | 0.039 |
BMI: body mass index; CI: confidence interval; HOMA: homeostasis model assessment; Ln: natural logarithmic transformation; Log: base 10 logarithmic transformation; OR: odds ratio; Ref.: reference.
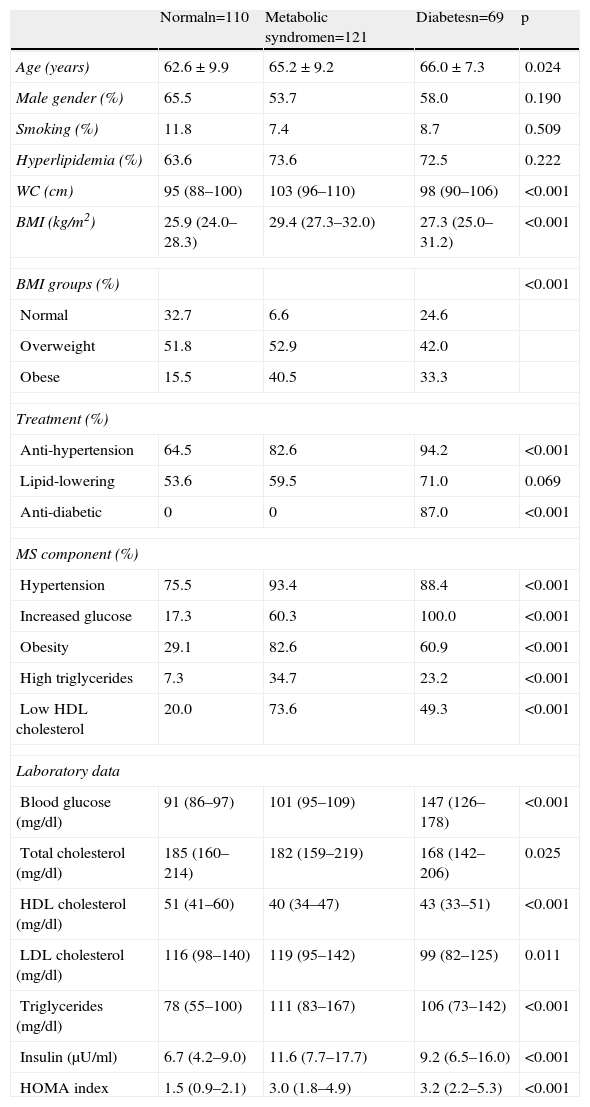
Overall, the prevalence of diabetes was 23.0%, metabolic syndrome (in non-diabetic patients) 40.5%, and 36.7% had neither diagnosis (Table 4). CAD prevalence was 65.2% in the diabetic group, 46.3% in the metabolic syndrome group and 48.2% in the group with neither diagnosis (p=0.003), with the only significant differences between diabetic patients and the other two groups. Even after inclusion of diabetic patients with metabolic syndrome in the metabolic syndrome group, there was no significant increase of CAD prevalence in this group compared to diabetics alone (50.6% vs. 70.8%, p=0.127).
Patient characteristics by metabolic group.
| Normaln=110 | Metabolic syndromen=121 | Diabetesn=69 | p | |
| Age (years) | 62.6±9.9 | 65.2±9.2 | 66.0±7.3 | 0.024 |
| Male gender (%) | 65.5 | 53.7 | 58.0 | 0.190 |
| Smoking (%) | 11.8 | 7.4 | 8.7 | 0.509 |
| Hyperlipidemia (%) | 63.6 | 73.6 | 72.5 | 0.222 |
| WC (cm) | 95 (88–100) | 103 (96–110) | 98 (90–106) | <0.001 |
| BMI (kg/m2) | 25.9 (24.0–28.3) | 29.4 (27.3–32.0) | 27.3 (25.0–31.2) | <0.001 |
| BMI groups (%) | <0.001 | |||
| Normal | 32.7 | 6.6 | 24.6 | |
| Overweight | 51.8 | 52.9 | 42.0 | |
| Obese | 15.5 | 40.5 | 33.3 | |
| Treatment (%) | ||||
| Anti-hypertension | 64.5 | 82.6 | 94.2 | <0.001 |
| Lipid-lowering | 53.6 | 59.5 | 71.0 | 0.069 |
| Anti-diabetic | 0 | 0 | 87.0 | <0.001 |
| MS component (%) | ||||
| Hypertension | 75.5 | 93.4 | 88.4 | <0.001 |
| Increased glucose | 17.3 | 60.3 | 100.0 | <0.001 |
| Obesity | 29.1 | 82.6 | 60.9 | <0.001 |
| High triglycerides | 7.3 | 34.7 | 23.2 | <0.001 |
| Low HDL cholesterol | 20.0 | 73.6 | 49.3 | <0.001 |
| Laboratory data | ||||
| Blood glucose (mg/dl) | 91 (86–97) | 101 (95–109) | 147 (126–178) | <0.001 |
| Total cholesterol (mg/dl) | 185 (160–214) | 182 (159–219) | 168 (142–206) | 0.025 |
| HDL cholesterol (mg/dl) | 51 (41–60) | 40 (34–47) | 43 (33–51) | <0.001 |
| LDL cholesterol (mg/dl) | 116 (98–140) | 119 (95–142) | 99 (82–125) | 0.011 |
| Triglycerides (mg/dl) | 78 (55–100) | 111 (83–167) | 106 (73–142) | <0.001 |
| Insulin (μU/ml) | 6.7 (4.2–9.0) | 11.6 (7.7–17.7) | 9.2 (6.5–16.0) | <0.001 |
| HOMA index | 1.5 (0.9–2.1) | 3.0 (1.8–4.9) | 3.2 (2.2–5.3) | <0.001 |
BMI: body mass index; HOMA: homeostasis model assessment; MS: metabolic syndrome; WC: waist circumference.
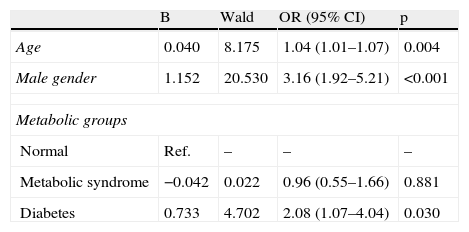
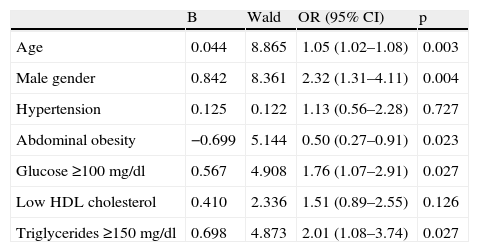
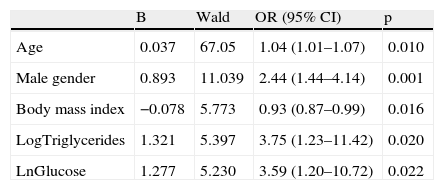
After adjustment for age and gender, only diabetes was associated with CAD, not metabolic syndrome (Table 5). The most important metabolic syndrome components associated with CAD were increased glucose and triglycerides, while abdominal obesity showed a protective effect (Table 6). Independent predictors of CAD were age, male gender, diabetes (and increased glucose) and increased triglycerides. BMI was a protective factor (Table 7).
Predictive ability for coronary artery disease in each metabolic group, adjusted for age and gender.
| B | Wald | OR (95% CI) | p | |
| Age | 0.040 | 8.175 | 1.04 (1.01–1.07) | 0.004 |
| Male gender | 1.152 | 20.530 | 3.16 (1.92–5.21) | <0.001 |
| Metabolic groups | ||||
| Normal | Ref. | – | – | – |
| Metabolic syndrome | −0.042 | 0.022 | 0.96 (0.55–1.66) | 0.881 |
| Diabetes | 0.733 | 4.702 | 2.08 (1.07–4.04) | 0.030 |
CI: confidence interval; OR: odds ratio; Ref.: reference group.
Predictive ability for coronary artery disease of each metabolic syndrome component, adjusted for age and gender.
| B | Wald | OR (95% CI) | p | |
| Age | 0.044 | 8.865 | 1.05 (1.02–1.08) | 0.003 |
| Male gender | 0.842 | 8.361 | 2.32 (1.31–4.11) | 0.004 |
| Hypertension | 0.125 | 0.122 | 1.13 (0.56–2.28) | 0.727 |
| Abdominal obesity | −0.699 | 5.144 | 0.50 (0.27–0.91) | 0.023 |
| Glucose ≥100 mg/dl | 0.567 | 4.908 | 1.76 (1.07–2.91) | 0.027 |
| Low HDL cholesterol | 0.410 | 2.336 | 1.51 (0.89–2.55) | 0.126 |
| Triglycerides ≥150 mg/dl | 0.698 | 4.873 | 2.01 (1.08–3.74) | 0.027 |
CI: confidence interval; OR: odds ratio.
Independent predictors for significant coronary artery disease.
| B | Wald | OR (95% CI) | p | |
| Age | 0.037 | 67.05 | 1.04 (1.01–1.07) | 0.010 |
| Male gender | 0.893 | 11.039 | 2.44 (1.44–4.14) | 0.001 |
| Body mass index | −0.078 | 5.773 | 0.93 (0.87–0.99) | 0.016 |
| LogTriglycerides | 1.321 | 5.397 | 3.75 (1.23–11.42) | 0.020 |
| LnGlucose | 1.277 | 5.230 | 3.59 (1.20–10.72) | 0.022 |
CI: confidence interval; Ln: natural logarithmic transformation; Log: base 10 logarithmic transformation; OR: odds ratio; Ref.: reference group.
Variables in the analysis: age, gender, diabetes, body mass index, LnGlucose, LogHDL cholesterol, LogTriglycerides.
In our population, 88% of the patients had a non-invasive test positive for myocardial ischemia. The others underwent coronary angiography without a previous non-invasive test for ischemia. In the group with a positive treadmill stress test, only 49.3% had significant angiographic coronary artery disease. In the group with positive cardiac scintigraphy, 54.3% had significant coronary artery disease. In patients with a positive functional test for ischemia, 49.0% of the group without metabolic disorder, 45.7% of patients with metabolic syndrome and 65.6% of diabetic patients had significant angiographic coronary artery disease (p=0.039).
DiscussionWe found in our study that metabolic syndrome prevalence is not associated with the prevalence of significant angiographic CAD. On the other hand, diabetes was highly correlated with CAD. The most important components of metabolic syndrome to predict CAD are increased glucose and triglycerides, with abdominal obesity being protective. The independent predictors for significant CAD in this high-risk population are age, male gender, high glucose, and high triglycerides. Increased BMI was protective against CAD. Unexpectedly, total cholesterol and LDL cholesterol showed no association.
Since the first description of the metabolic syndrome by Raven in 1988, several definitions have been published, including those of the World Health Organization, the National Cholesterol Education Program (NCEP) and the International Diabetes Federation.15–18 Of these, the NCEP definition has emerged as the most widely used, primarily because it provides a relatively simple approach for diagnosing metabolic syndrome by employing easily measurable risk factors. This definition has been updated by the AHA/NHLBI by lowering the threshold for fasting glucose in accordance with the American Diabetes Association; the new definition includes patients being treated for dyslipidemia, hyperglycemia, or systemic hypertension.13,19
Two meta-analyses investigating metabolic syndrome prior to 2005, not including the new definition,3,4 showed that metabolic syndrome was associated with higher cardiovascular risk, particularly in women. A recent meta-analysis including studies with the AHA/NHLBI definition showed that overall, the metabolic syndrome was associated with a two-fold increase in risk of cardiovascular disease, cardiovascular mortality, and stroke, and a 1.5-fold increase in risk of all-cause mortality.5 Thus, patients with metabolic syndrome are at higher risk for cardiovascular outcomes than for all-cause mortality. Even in the absence of type 2 diabetes, the metabolic syndrome was still associated with an increased risk of cardiovascular endpoints, which goes against the argument that the impact of metabolic syndrome derives from its frequent association with diabetes. Cardiovascular risk with the AHA/NHLBI definition was also similar to that with the NCEP definition. Although the pathophysiological mechanism by which the metabolic syndrome increases cardiovascular risk remains the subject of debate, insulin resistance is often put forward as the underlying component.20,21 Insulin resistance is associated with lipid imbalances and with prothrombotic and proinflammatory states.20,22 More recent definitions emphasize central obesity as the underlying component, which is associated with adiponectin/leptin imbalances and consequent insulin resistance.13,17,18
The prognostic importance of the metabolic syndrome compared to that of the sum of its individual components has repeatedly been challenged. In a cohort study, the risk of cardiovascular mortality associated with metabolic syndrome was similar to the risk associated with impaired fasting glucose and systemic hypertension.23 Furthermore, in a systematic review of seven clinical trials, the metabolic syndrome by the NCEP definition was no longer an independent predictor of atherosclerotic plaque progression after adjustment for its individual components.24 However, most published reports appear to indicate that the syndrome predicts cardiovascular events and/or diabetes independently of other cardiovascular risk factors.
In the MESYAS study, conducted among Spanish workers and thus similar to Portuguese populations, except for the significant male predominance in the Spanish study, it was demonstrated that metabolic syndrome is associated with a substantial increase in the risk of developing CAD.25 However, the metabolic syndrome components confer very different intensities of independent risk, from the high independent risk of hypertriglyceridemia (long known but overlooked) to the almost complete absence of an independent effect of overweight (even appearing to be protective, which seems contradictory). In the absence of obesity, three other higher risk criteria are required for the diagnosis. As a result, there is heterogeneity of risk among patients with metabolic syndrome, depending on the particular criteria used for a diagnosis. The cardiovascular disease burden derived from obesity is probably mediated by the presence of the other known metabolic risk factors, which cluster more often in the presence of obesity. Similar results were obtained in our study and this might also explain some discrepancies in the results between studies according to the predominant type of clusters in a specific population.
However, our results are different from the previously mentioned large meta-analysis with regard to the association between metabolic syndrome and coronary disease. Ours is an angiographic study that provides different information from that obtained in epidemiological studies that analyze cardiovascular events. Acute cardiovascular events have different pathophysiological mechanisms from those in stable coronary atherosclerotic plaque. Vulnerable plaques are generally characterized as having a thin inflamed fibrous cap over a large lipid core with activated macrophages near the cap.26 In previous studies, the strongest independent predictor of coronary plaque rupture was the presence of metabolic syndrome, as well as positive remodeling at the culprit lesion and an elastic membrane cross-sectional area ≥14mm2.26 Among the components of metabolic syndrome, abdominal obesity and low serum HDL cholesterol were significant independent predictors for culprit coronary plaque rupture. Thus, vulnerable coronary plaque rupture is associated with metabolic syndrome, especially with abdominal obesity and low HDL cholesterol. These results might explain the association of metabolic syndrome with cardiovascular events; stable coronary atherosclerotic plaques have a different physiopathological substrate.
A Turkish angiographic study in 184 patients showed that diabetic patients had significantly higher Gensini scores.6 However, metabolic syndrome patients (by the NCEP definition) did not have significantly different Gensini scores. Also when evaluating diabetic and non-diabetic patients separately, non-diabetic patients with metabolic syndrome had slightly higher scores, but without statistical significance. Neither any single metabolic syndrome component nor gender revealed a significant relationship with coronary disease severity.
A study by Bayturan et al. in the USA with intravascular ultrasound imaging revealed that a diagnosis of diabetes was associated with a greater burden and progression of coronary atherosclerosis, despite the presence of fewer individual cardiovascular risk factors, than a diagnosis of metabolic syndrome, underscoring the importance of diabetes and its impact on the atherosclerotic process occurring within the arterial wall.27 This reinforces the atherogenicity concept of diabetes, which may exert deleterious proatherogenic effects by glycation, inflammation, and oxidative stress. Furthermore, diabetes was accompanied by vascular constriction and small lumen volumes, despite the presence of more extensive atheroma burden. In the same study, metabolic syndrome was associated with larger vessel dimensions and no greater disease burden (compared to patients with neither condition), suggesting different effects on remodeling. This highlights clear differences between metabolic syndrome and diabetes with regard to how the vessel wall responds to plaque accumulation. Another study in women showed that women with diabetes had more severe angiographic disease than those without diabetes, while no association was found between angiographic scores and metabolic syndrome. In multivariate analysis, high triglycerides and low HDL were predictors of angiographically proven CAD.8 In our study, we also observed a direct relationship between diabetes and CAD and no relationship with metabolic syndrome. We also confirmed the importance of triglycerides as a predictor of CAD.
The absence of association between total cholesterol and LDL cholesterol with CAD may be explained by the high rate of lipid-lowering therapy use in our population, which was 60% (56.6% with statins, 1.7% with fibrates and 1.7% with both). This may explain the relatively low levels of total cholesterol and LDL cholesterol; almost 75% of the study population had LDL cholesterol <130mg/dl. However, lipid-lowering therapy by itself was not associated with CAD. A recent study demonstrated that in patients with low levels of LDL cholesterol (<130mg/dl), the lipid abnormalities with highest impact in cardiovascular events are indeed HDL cholesterol and triglycerides, as our results show.28
Obesity had a protective effect for CAD. Other authors have explained this inverse relationship, described as the obesity paradox, as a result of bias caused by different baseline characteristics, since these patients are usually younger.29,30 However, in our population, obese patients had similar ages (65±9 years) to overweight (64±9 years) and normal BMI patients (65±10 years, p=NS). Multivariate analysis also adjusted the results for age. The comorbidities usually associated with low and high BMI are also suggested as an explanation for the better outcome observed in overweight patients after acute coronary syndromes. However, in our study, obese patients showed a trend to lower CAD prevalence, but not overweight patients. This may be explained by the fact that, as previously shown, BMI is directly related to coronary vessel diameter.31 This leads us to conclude that to cause 50% stenosis, the atherosclerotic plaque needs to be significantly thicker in high BMI patients than in low BMI patients.
The relationship between metabolic syndrome and functional tests for ischemia is also interesting. In our population, a large number of patients had a previous functional test documenting the presence of myocardial ischemia. It would be expected that the increased use of non-invasive testing to rule out ischemia prior to the procedure should have resulted in more effective risk stratification, enabling identification of patients who would be more likely to benefit from cardiac catheterization and ideally reducing the use of invasive procedures in those who do not have obstructive disease. However, this was not the case; only half of these patients had significant angiographic CAD. Patients with chest pain and normal or non-obstructive coronary angiograms are predominately women, and many have a prognosis that is not as benign as previously thought.32 Recent data suggest that ST-segment changes and reversible myocardial perfusion defects in patients with “normal” coronary arteries may reflect true myocardial ischemia likely related to atherosclerotic disease of the more distal coronary circulation and not a false positive result.32 Assessment of endothelial function could help identify patients at risk for future cardiac events. In patients with metabolic syndrome, the association between the results of functional testing and of coronary angiography were similar to “normal” patients. Only in diabetic patients was this association stronger. This suggests a stronger association of diabetes with epicardial CAD, confirming the previous conclusions of Bayturan et al. using intravascular ultrasound.27
In conclusion, as opposed to previous epidemiological studies on prediction of cardiovascular events, metabolic syndrome is not a predictor of angiographic CAD. Diabetes (and blood glucose) remained among the most important predictors, as well as age, male gender and triglycerides. BMI appeared to be protective of CAD.
LimitationsThis was a cross-sectional study, and as such, it is not possible to establish a causal relationship since no information from follow-up was analyzed and subjects only underwent a single coronary angiogram.
The sample is relatively small, although it is larger than in other studies and was calculated for a precision of 5% and a power of 80%.
Our results are only applicable to populations similar to ours. In this population, 60% of patients were under lipid-lowering therapy and almost 75% had LDL cholesterol <130mg/dl. We also excluded patients with known heart disease.
This was an angiographic study and as such, coronary plaque morphology was not directly assessed. Intravascular ultrasound enables cross-sectional imaging of coronary arteries and provides more comprehensive assessment of atherosclerotic plaque in vivo; it is considered the gold standard technique. With quantitative coronary angiography analysis, we measured reference diameter and percentage diameter stenosis. However, it has been reported that this measurement can be misleading, because patients with similar measurements on angiography might have different vessel and plaque volume when assessed by intravascular ultrasound. In fact, in some patients, vessels might have compensatory enlargement to prevent building atheroma from encroaching into the lumen, thereby concealing the presence of a lesion when angiography is performed.10
Ethical disclosuresProtection of human and animal subjectsThe authors declare that the procedures followed were in accordance with the regulations of the responsible Clinical Research Ethics Committee and in accordance with those of the Helsinki Declaration of the World Medical Association.
Confidentiality of dataThe authors declare that they have followed the protocols of their work center on the publication of patient data and that all the patients included in the study received sufficient information and gave their written informed consent to participate in the study.
Right to privacy and informed consentThe authors have obtained the informed consent of the patients and/or subjects mentioned in the article. The corresponding author is in possession of this document.
Conflicts of interestThe authors have no conflicts of interest to declare.


