
Several studies comparing optical coherence tomography (OCT) and intravascular ultrasound (IVUS) have revealed that OCT consistently provides smaller area and diameter measurements. However, comparative assessment in clinical practice is difficult. Three-dimensional (3D) printing offers a unique opportunity to assess intravascular imaging modalities.
We aim to compare intravascular imaging modalities using a 3D-printed coronary artery in a realistic simulator and to assess whether OCT underestimates intravascular dimensions, exploring potential corrections.
MethodsA standard realistic left main anatomy with an ostial left anterior descending artery lesion was replicated using 3D printing. After provisional stenting and optimization, IVI was obtained. Modalities included 20 MHz digital IVUS, 60 MHz rotational IVUS (HD-IVUS) and OCT. We assessed luminal area and diameters at standard locations.
ResultsConsidering all coregistered measurements, OCT significantly underestimated area, minimal diameter and maximal diameter measurements in comparison to IVUS and HD-IVUS (p<0.001). No significant differences were found between IVUS and HD-IVUS.
A significant systematic dimensional error was found in OCT auto-calibration by comparing known reference diameter of guiding catheter (1.8 mm) to measured mean diameter (1.68 mm±0.04 mm). By applying a correction factor based on the reference guiding catheter area to OCT, the luminal areas and diameters were not significantly different compared to IVUS and HD-IVUS.
ConclusionOur findings suggest that automatic spectral calibration method for OCT is inaccurate, with a systematic underestimation of luminal dimensions. When guiding catheter correction is applied the performance of OCT is significantly improved. These results may be clinically relevant and need to be validated.
Vários estudos de comparação da tomografia de coerência óptica (OCT) com a ecografia intracoronária (IVUS) demonstraram que os valores de diâmetros e áreas medidos por OCT são sistematicamente inferiores. No entanto, esta comparação do ponto de vista clínico é complexa. Os modelos de impressão 3D constituem uma oportunidade para avaliar as modalidades de imagem intravascular.
Assim, pretendemos comparar as modalidades de imagem intravascular utilizando modelos 3D de artérias coronárias e avaliar se as medidas por OCT são subestimadas, explorando eventuais correções.
MétodosReplicou-se, através de impressão 3D, a anatomia do tronco comum com lesão ostial da descendente anterior. Depois da colocação de stent e otimização do mesmo, foram obtidas imagens com IVUS digital (20 MHz), IVUS rotacional (60 MHz, HD-IVUS) e OCT. Foram avaliadas as áreas luminais e os diâmetros.
ResultadosNa avaliação de todas as medidas, o OCT subestimou significativamente as áreas e os diâmetros, comparativamente com o IVUS e o HD-IVUS. Um erro de medida significativo e sistemático foi encontrado na autocalibração do OCT, ao comparar o diâmetro de referência do catéter-guia (1,8 mm) com o diâmetro médio medido (1,68 mm±0,04 mm). Ao aplicar um fator de correção baseado na área do catéter-guia, as medidas obtidas deixaram de ter uma diferença significativa quando comparados com o IVUS e HD-IVUS.
ConclusõesEstes resultados sugerem que o método de calibração automática do OCT é pouco preciso. Quando se aplica uma correção baseada no catéter-guia, a performance do OCT melhora significativamente. Estes resultados podem ser clinicamente relevantes e necessitam de validação.
Percutaneous coronary intervention (PCI) is most commonly guided by angiography alone.1 In the past three decades, intravascular imaging including intravascular ultrasound (IVUS) and, more recently, optical coherence tomography (OCT) has been increasingly used to guide PCI procedures.2,3
Intravascular imaging modalities provide critical information about coronary artery morphology and facilitate comprehensive assessment of lumen dimensions and plaque burden.1,2 Both OCT and IVUS significantly improve stent deployment, procedural results and clinical outcomes, especially in cases of challenging anatomy or left main disease.1 They improve the results of angioplasty in several ways: (1) by providing information on the need for lesion preparation; (2) by guiding appropriate stent sizing to maximize the final stent area and minimize malapposition; (3) by selecting the optimal stent length to cover residual disease, thus minimizing geographic miss; (4) by guiding optimal stent expansion; (5) by identifying acute complications (e.g., edge dissection, stent malapposition, tissue protrusion); and (6) by clarifying the mechanism of late stent failure (e.g., stent thrombosis, neointimal hyperplasia, stent underexpansion, stent fracture, neoatherosclerosis).3–5
Accuracy and reproducibility in the assessment of coronary anatomy by intravascular imaging are critical factors when guiding intervention procedures and are dependent on the chosen modality.4,5 Each technique has distinct advantages and disadvantages.4,5 On the one hand, IVUS enables more complete vessel and plaque visualization in exchange for relatively coarse resolution.4,5 While OCT provides distinctively higher image resolution, at the expense of a limited visibility range of the vessel surface.4–7 Furthermore, IVUS imaging catheters may use different technology leading to an impact on resolution and ease of use.8 Solid state IVUS are highly deliverable and plug-and-play, eliminate the wire artifact by housing the guide wire central to its transducer element. They do, however, have limited resolution due to the use of 20 MHz ultrasound frequency.8 High-definition intravascular ultrasound (HD-IVUS), which uses 60 MHz transducers in a rotating design, offers the highest resolution with this imaging modality.8
OCT has a significantly lower tissue penetration depth (1–2.5 mm), thus leading to limited visualization of the entire vessel wall. Lumen values obtained by OCT are lower than those provided by IVUS and minimal lumen area (MLA) measurements have been found to be consistently smaller.9,10 IVUS is believed to provide more accurate vessel sizing, resulting more frequently in stent postdilatation, leading to larger minimal stent area (MSA) and lower rates of geographic miss.9,10 Although both imaging modalities have been shown to be clinically useful for guiding procedures, the impact and the reasons for the discrepancies in sizing have not yet been fully explained.1,3,4
A head-to-head comparative assessment in clinical practice is difficult due to anatomical variability, so 3D-printing phantom models of coronary arteries provide a good opportunity for assessing differences in the performance of intravascular imaging devices currently used in clinical practice.11 They enable the creation of anatomically correct models that have an appropriate elastic response and obey geometric scaling law.12 By incorporating the 3D-printing coronary models, simulation of real procedures in the cath lab environment, offers the opportunity of using clinical imaging tools in the same consistent anatomic setting.12
ObjectivesWe aim to compare the diagnostic performance of intravascular imaging modalities using a standard 3D-printed coronary artery in a pulsatile flow realistic simulator. We will assess whether OCT underestimates intravascular dimensions against digital and rotational IVUS modalities and explore potential causes and corrections.
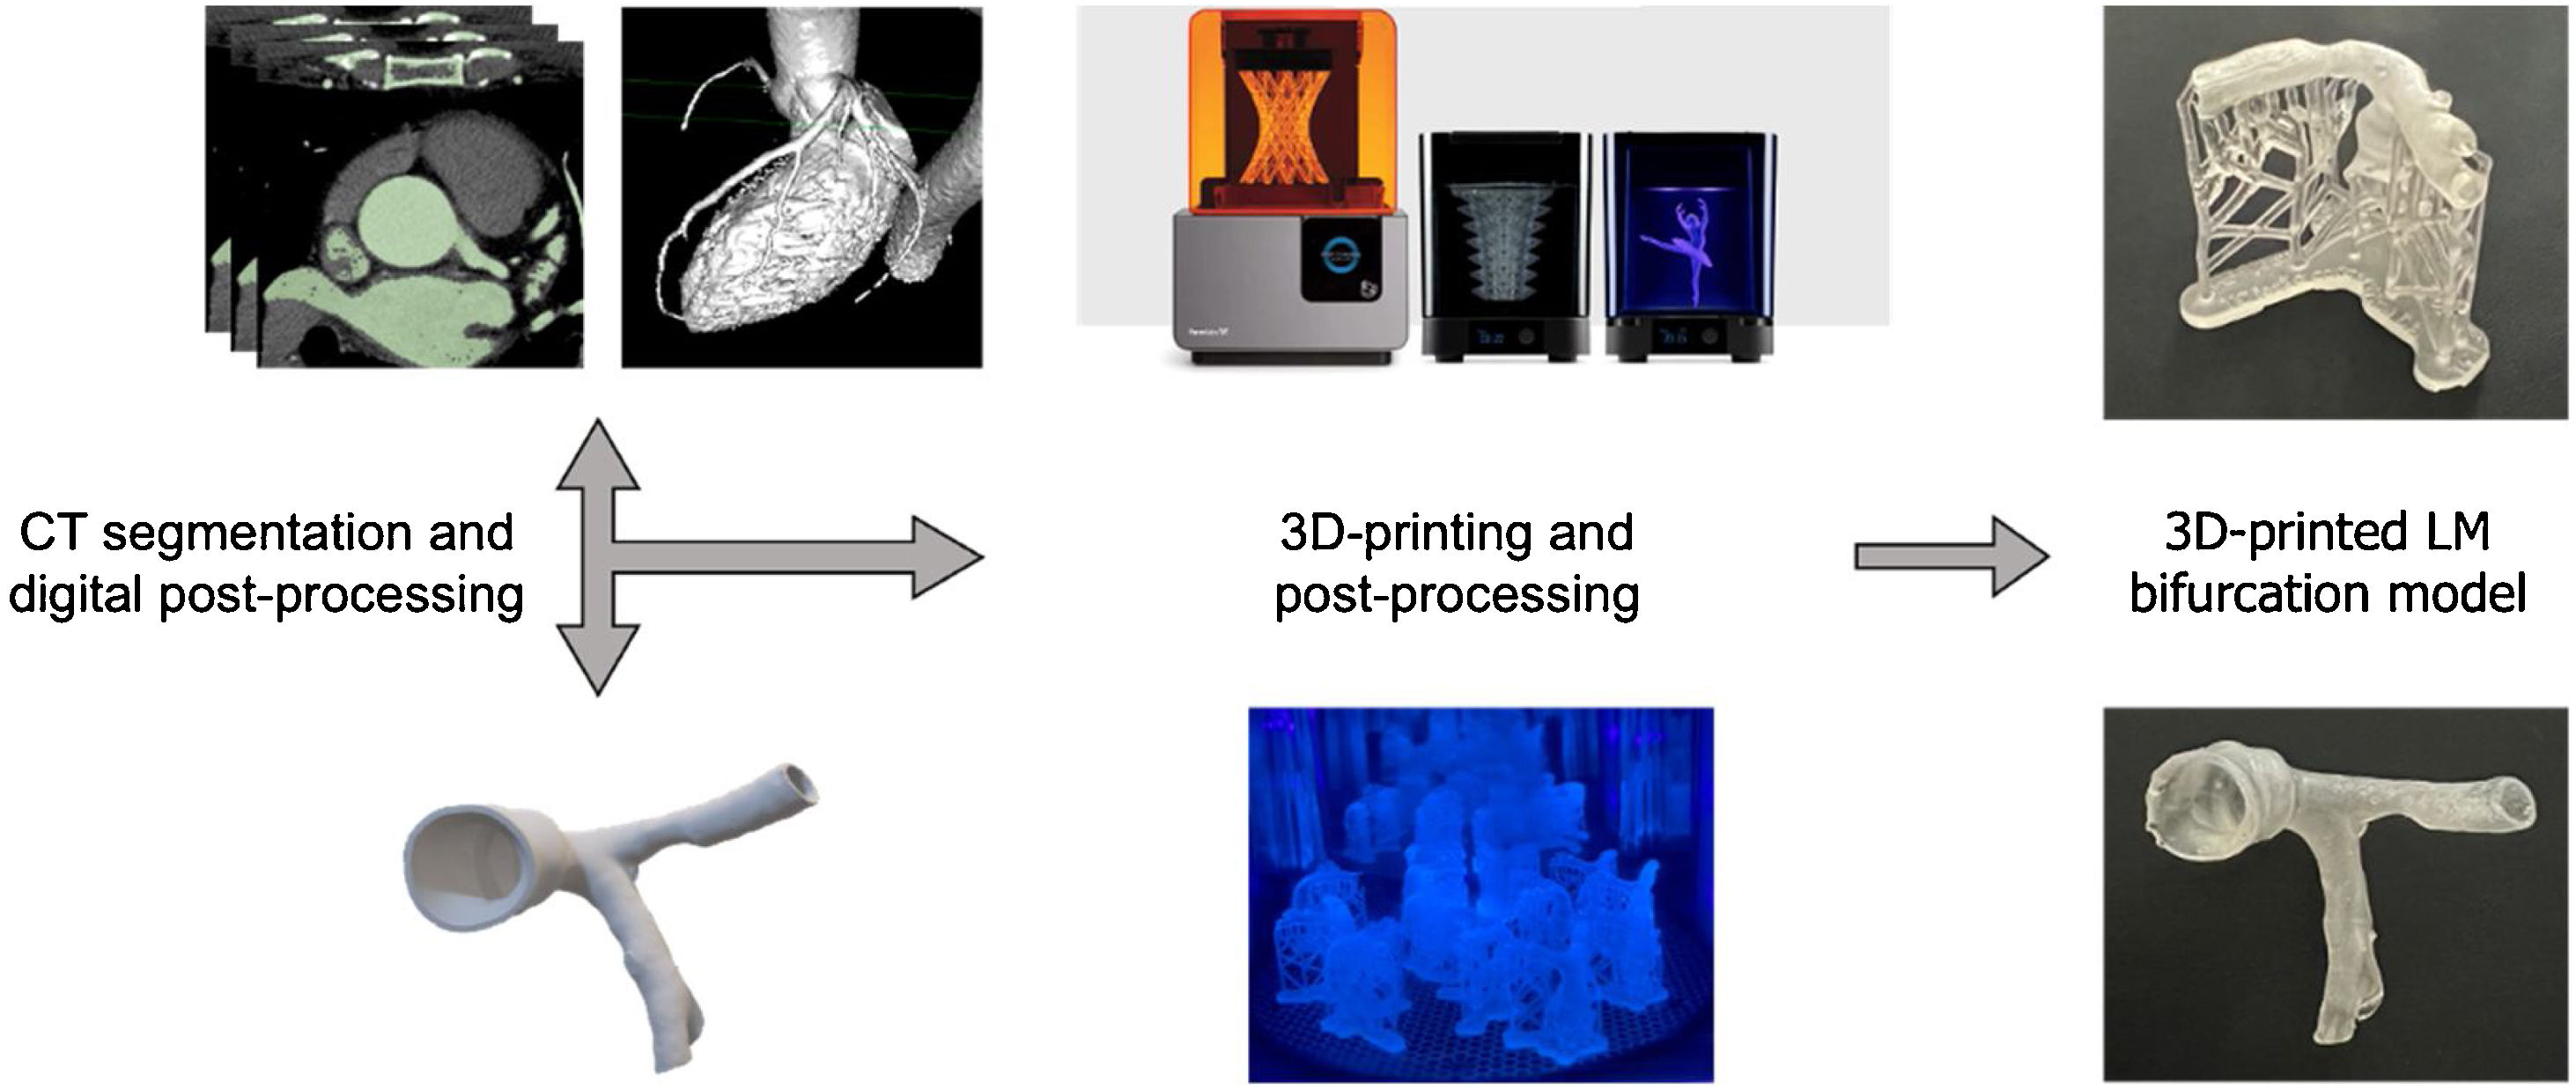
MethodsThree-dimensional printed coronary phantoms and simulationA standard realistic left main (LM) anatomy with an eccentric ostial left anterior descending artery (LAD) lesion was replicated using 3D-printing and connected to a realistic pulsatile flow simulator that was used in the cath lab.11 Briefly, we used computer tomography (CT) data to obtain 3D volume data depicting the proximal left coronary artery including LM, LAD and proximal circumflex (LCx). The realistic 3D anatomy was digitally manipulated to include an eccentric ostial LAD lesion, 0.5 mm wall thickness and a proximal connector in order to attach the anatomy into the simulator (Figure 1). The coronary anatomy was then 3D printed using elastic resin in a stereolithography Formlabs Form 2 printer (Somerville, MA, USA). Post-processing included washing resin residues using isopropyl alcohol, curing for 20 min at 60°C using Formlabs FormCure (Somerville, MA, USA) and removing supports.

Workflow of 3D models of LM bifurcation. CT images of normal coronary arteries were segmented creating a digital model of the coronary arteries. Then, an eccentric stenosis was created in ostial LAD and a connector to the simulator aorta was added. Wall thickness of 0.5 mm was used and supports were added for 3D printing with elastic resin using stereolithography. Five identical 3D prints of LM bifurcation were obtained after post-processing.
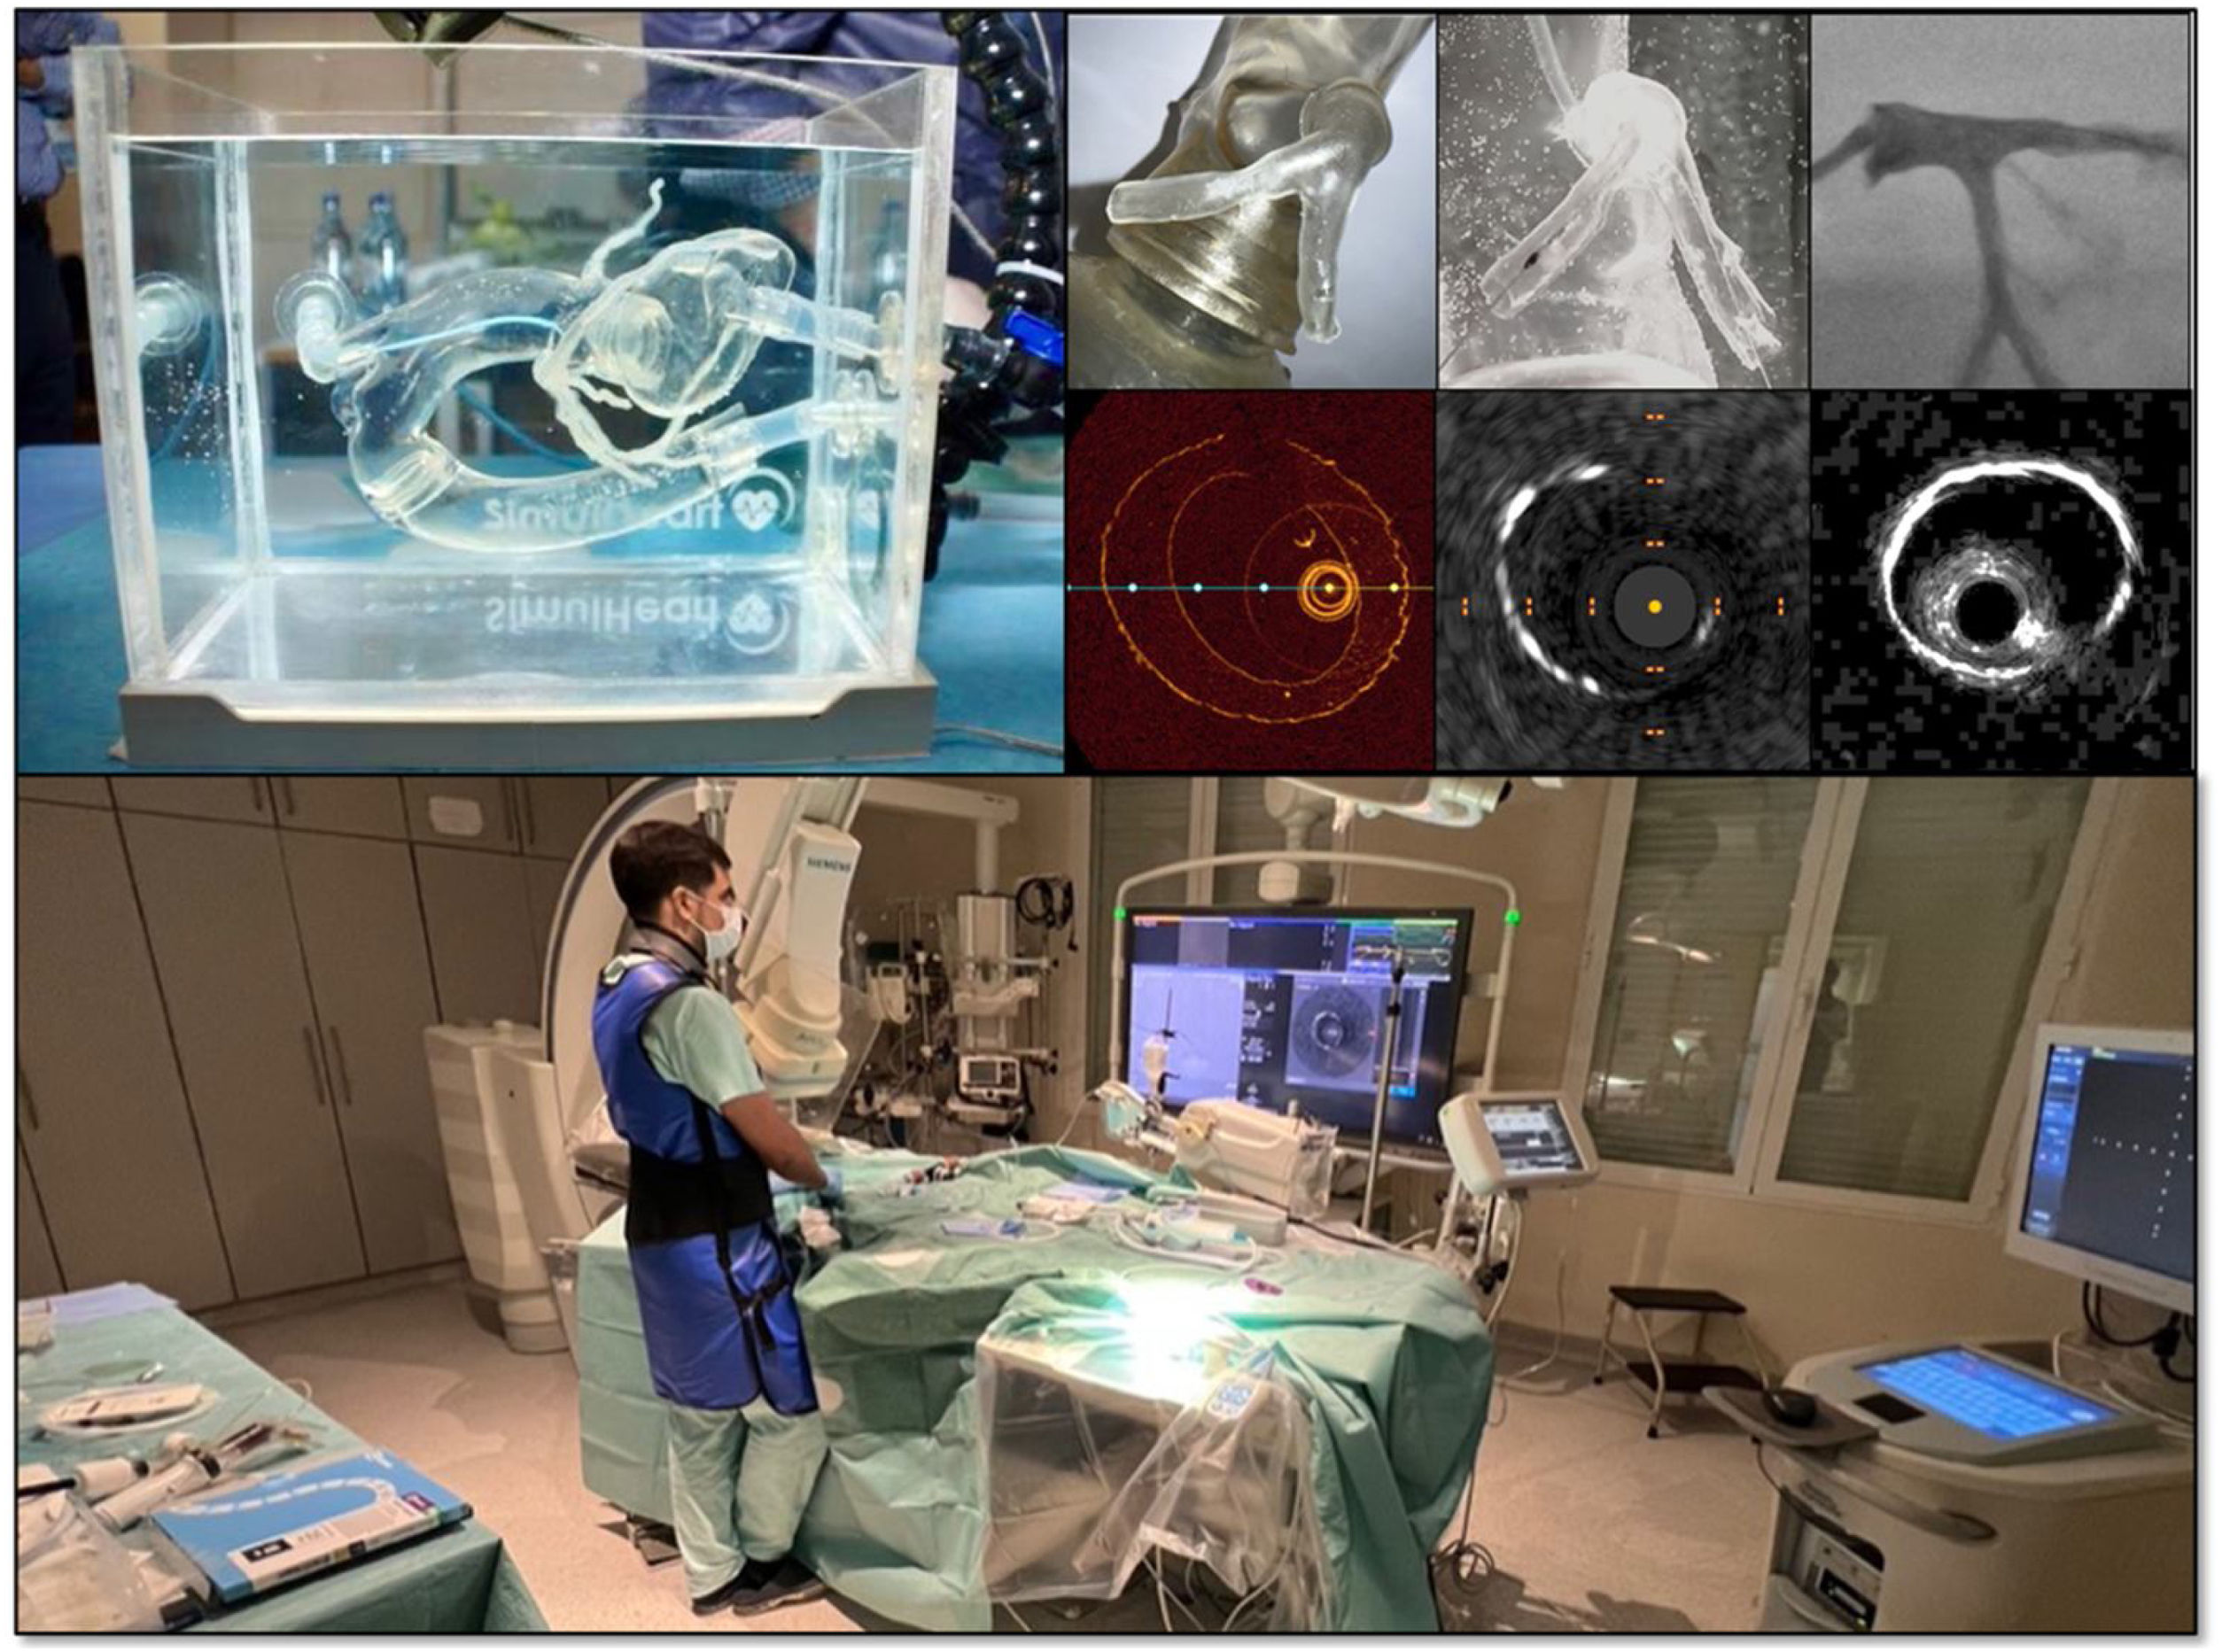
Five similar coronary arteries were reproduced using this standardized approach and were subsequently used in the simulator (Figure 2). We used the SimulHeart (Coimbra, Portugal) simulator for undergoing the interventional and diagnostic protocol in a cath lab. SimulHeart is an interventional cardiology simulator with realistic 3D-printed vascular anatomy, radial and femoral access sites and pulsatile flow that enables the use of real diagnostic and interventional devices with realistic haptic feedback.
 and the procedures were undertaken under video camera visualization, fluoroscopy and using OCT, IVUS and IVUS HD intravascular imaging (top right panels). The procedures were done in a real catheterization laboratory using real interventional devices and clinical used consoles (bottom panel).")
Workflow of simulated interventional and intravascular imaging procedure. The 3D printed LM anatomies were connected to SimulHeart interventional cardiology simulator (top left panel) and the procedures were undertaken under video camera visualization, fluoroscopy and using OCT, IVUS and IVUS HD intravascular imaging (top right panels). The procedures were done in a real catheterization laboratory using real interventional devices and clinical used consoles (bottom panel).
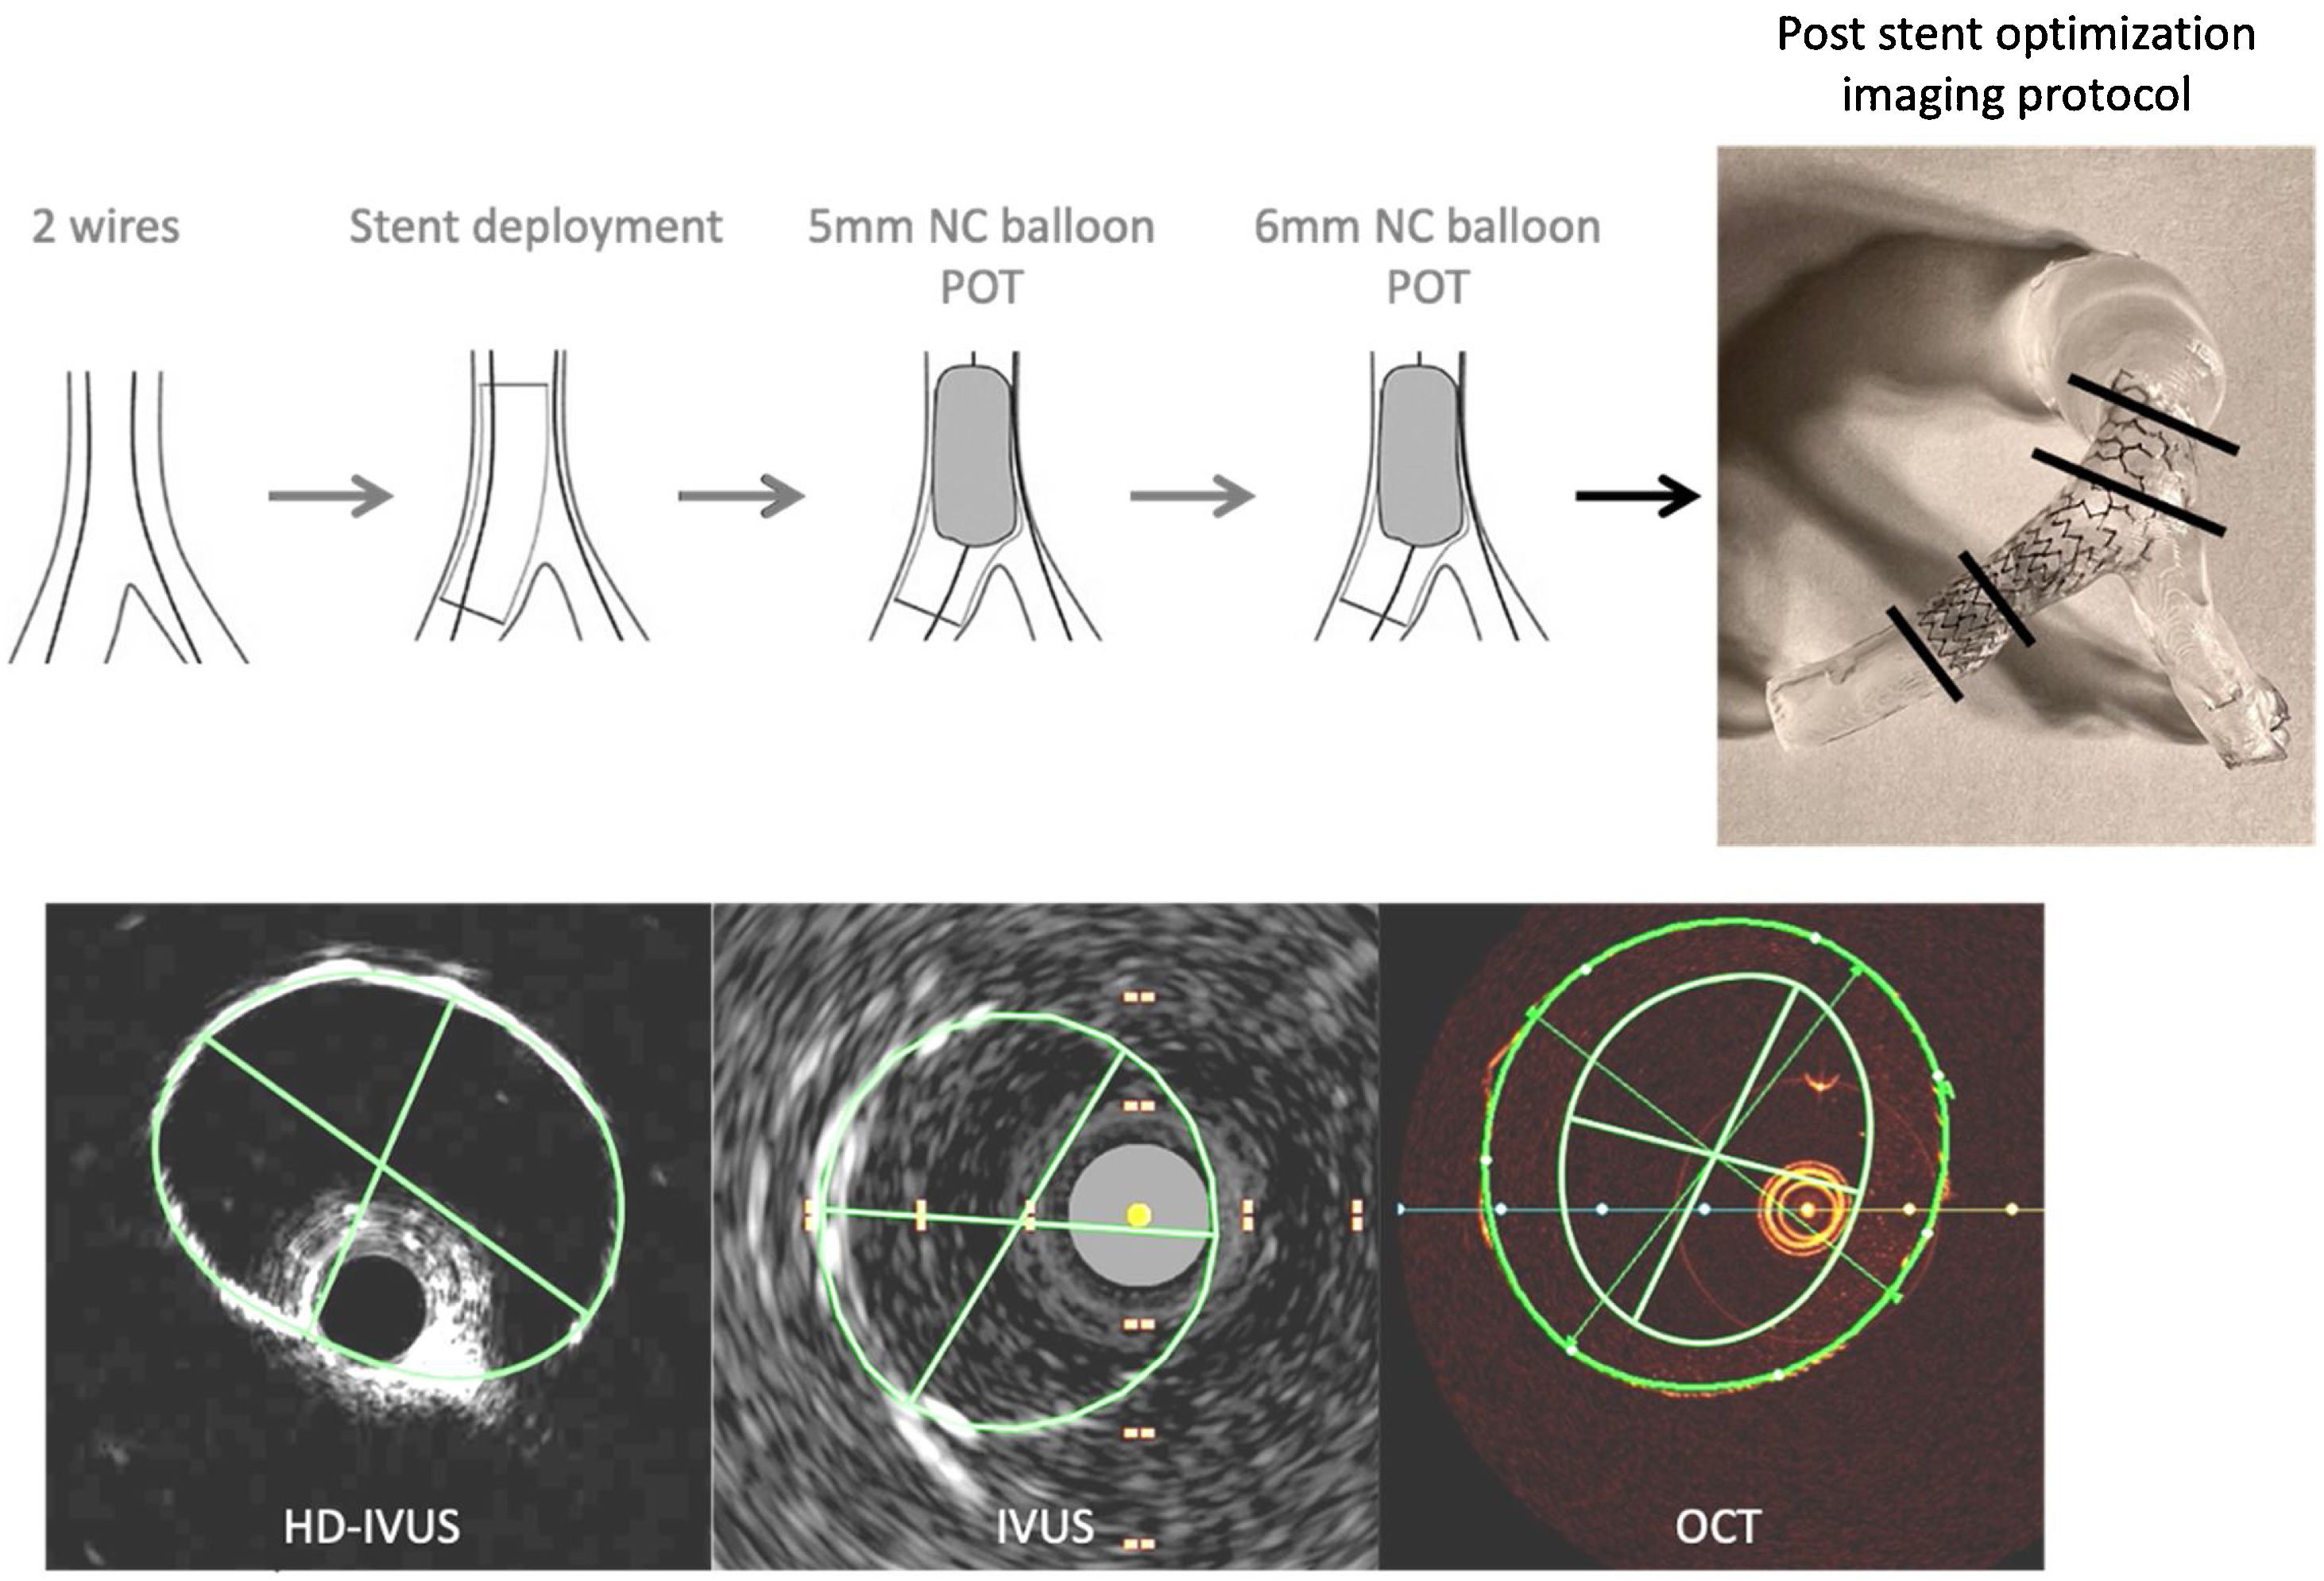
Intravascular imaging protocol (Figure 3) was performed using a JL5 6Fr guiding catheter through a simulated radial access and using workhorse Terumo Runthrough wires (Japan) in simulated LAD and LCx, after implantation of a stent using a provisional approach from LAD to LM and a standardized protocol. This included the use of proximal optimization technique. In each evaluation the imaging catheters were positioned distally to the 3D model under fluoroscopy and direct visualization, and were then pulled back to the guiding catheter, thus providing a complete visualization of the 3D printed anatomy.
, phased-array digital IVUS (IVUS) and OCT. The intravascular imaging modalities were sequentially done in five 3d-printed anatomies after stent implantation and optimization in the simulator. The black lines in the top right show the location of the images that were chosen for coregistration.")
Imaging protocol included high definition IVUS (HD-IVUS), phased-array digital IVUS (IVUS) and OCT. The intravascular imaging modalities were sequentially done in five 3d-printed anatomies after stent implantation and optimization in the simulator. The black lines in the top right show the location of the images that were chosen for coregistration.
Rotational HD-IVUS acquisition was performed standardly using automated motorized pullback (0.5 mm/s) with a commercially available imaging system (60-MHz Opticross HD catheter and iLab system cart, Boston Scientific Corp, Natick, MA). Digital 20 MHz IVUS images were obtained using a commercially available system (Eagle Eye Platinum Catheter and Core System, Philips, Netherlands). Manual pullback was used.
Optical coherence tomography images were obtained with Dragonfly Optis catheter and Optis system running Ultreon v1.0 software (Abbott Vascular, Santa Clara, CA, USA). There was no need for flush of contrast because the 3D printed anatomies were under saline in the simulator. Monitored OCT pullback imaging was performed for a length of 54 mm acquiring 10 frames/mm. We used the automatically adjusted Z-offset calibration provided by the Ultreon software at the beginning of each OCT run.
DICOM images were exported from the dedicated user consoles and analyzed offline by an experienced interventional cardiologist using Osyrix MD software v 13.0.1 (Bernex, Switzerland). Cross-sectional areas and diameters (minimum, maximum and mean) were obtained by manually review and tracing the luminal contour of the frames of interest in each imaging modality for the five coronary phantoms, after simulated intervention. Anatomic landmarks were used for coregistration and comparative assessment (Figure 3). The first frame distal to the implanted stent in the LAD (distal LAD); the frame with minimal luminal area in the LAD stenosis (MLA); the first frame proximal to LAD/Cx bifurcation (distal LM); and first frame in proximal LM with visible circumferential stent struts (proximal LM) were used for measurements. Also, guiding catheter area and diameters were obtained from OCT runs in a proximal frame without eccentric contour for correction of luminal dimensions given known reference values (diameter 1.8 mm; cross-sectional area 2.54 mm2). The ratios between measured catheter area and reference catheter area were used as correction factor for OCT (cOCT).
Statistical analysisContinuous variables were described by the mean and standard deviation for normally distributed data or median and interquartile range for non-normally distributed data and were compared in relation to the intravascular imaging method with Wilcoxon Mann-Whitney or Friedman analysis. Correlation between measures performed with the different intravascular imaging methods and cOCT was performed with the Pearson correlation test. Measurements presenting a significant correlation were investigated using simple regression analysis. The agreements between the measurements were expressed in Bland–Altman plots.
All analyses were two-sided and a p-value <0.05 was considered statistically significant. Statistical analyses were performed using SPSS 26.0 (SPSS, Inc., Chicago, IL, USA).
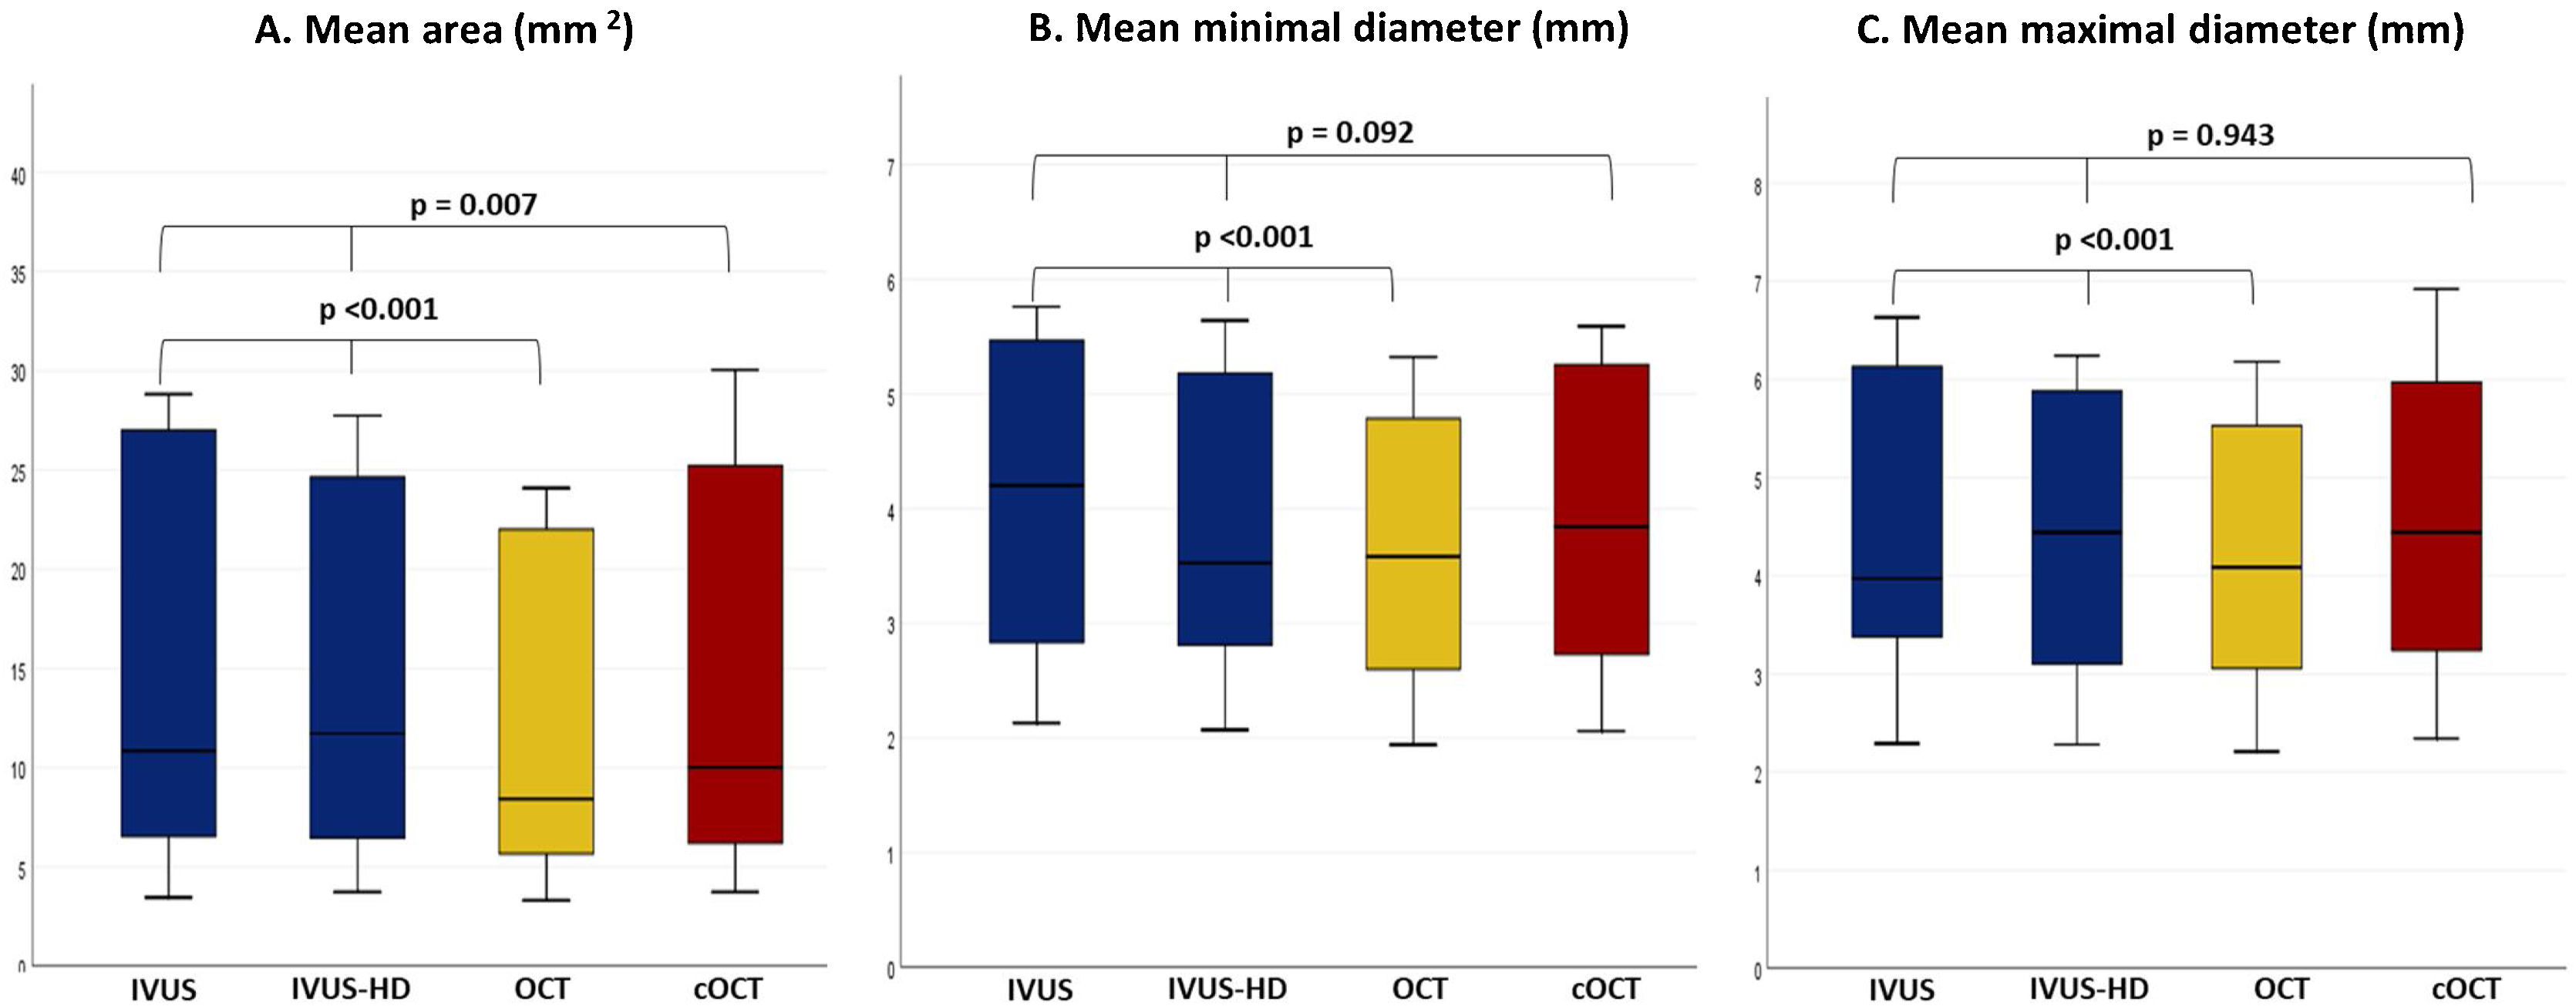
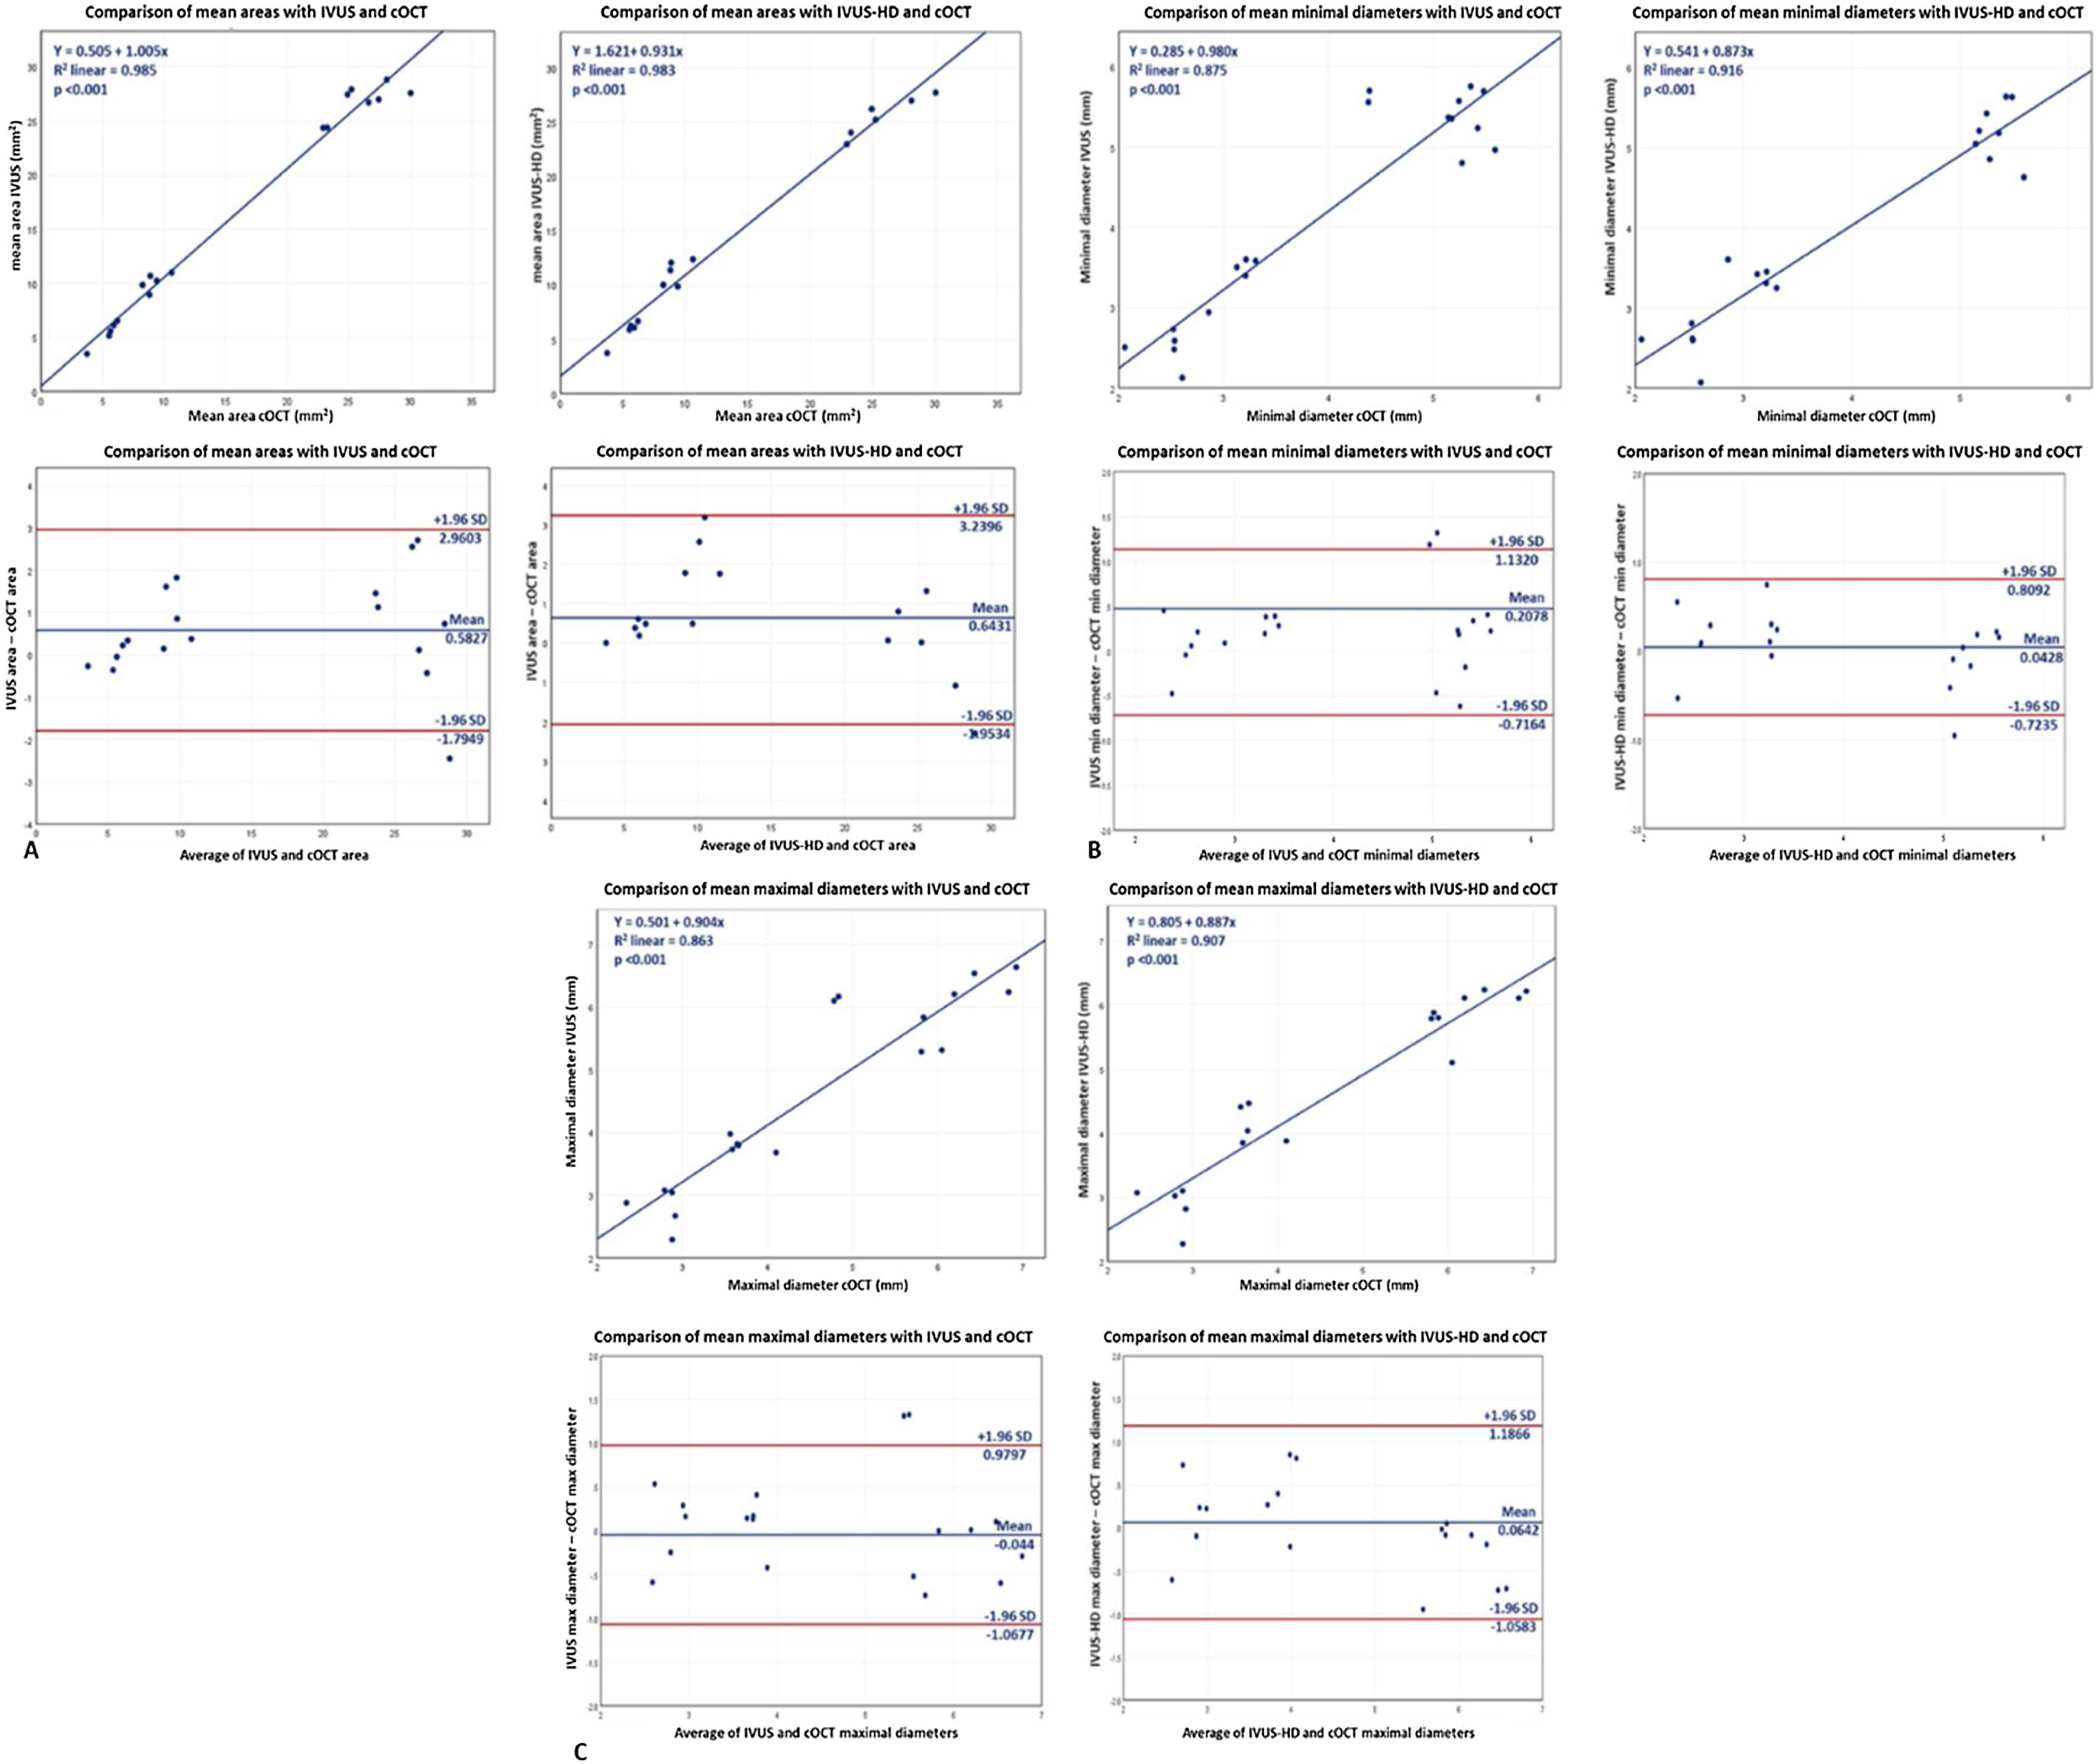
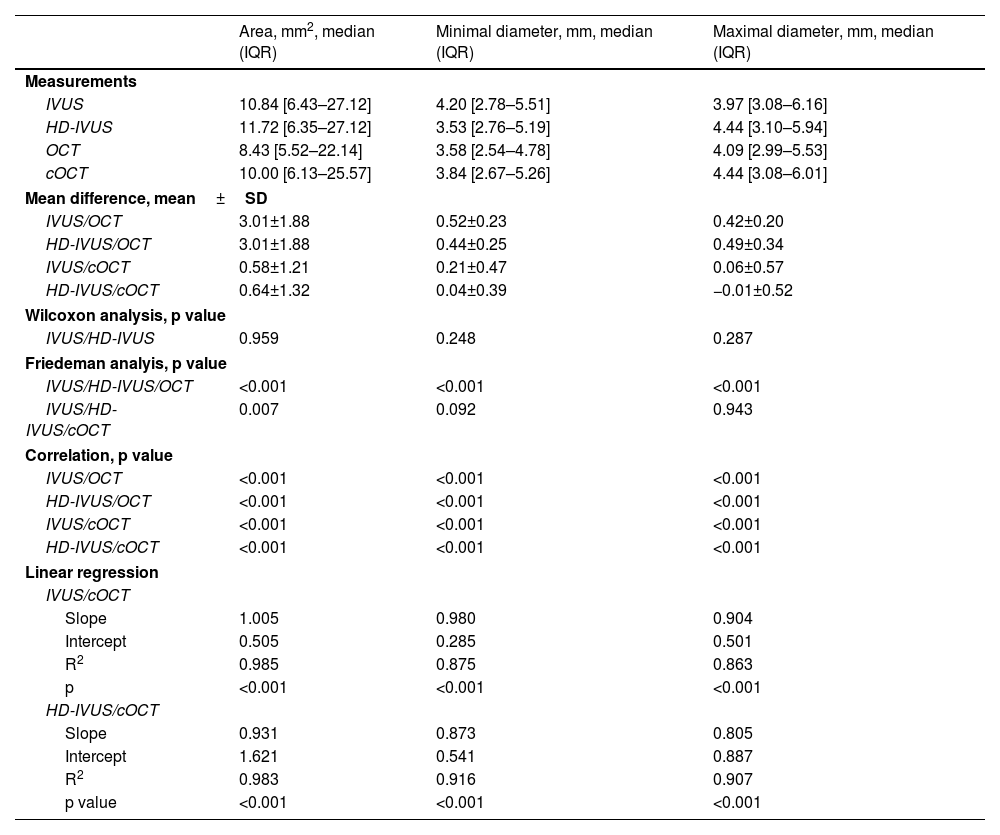
ResultsA total of 2700 frames of OCT, 6230 frames of IVUS and 14390 frames of HD-IVUS were reviewed offline after a total of 15 runs of intravascular imaging in the simulator. Coregistered images were considered of sufficient quality for interpretation in 83% of the frames (50 out of 60 frames). The 10 frames where the lumen could not be traced were in the proximal (n=5) and distal left main (n=5). Median luminal area was 11.7 mm2 in HD-IVUS, 10.8 mm2 in IVUS and 8.43 mm2 in OCT. Detailed comparison between the imaging modalities can be found in Table 1. No significant differences were found in measurements assessed either with IVUS or HD-IVUS (p=NS) in all locations and regarding areas, minimal or maximal diameters. The single exception was observed in maximal LAD diameter, although this difference was small and of no clinical impact (IVUS: 3.79 mm2 [3.70–3.89]; HD-IVUS: 4.04 mm2 [3.87–4.44], p=0.043). Considering all coregistered measurements, OCT significantly underestimated area, minimal diameter and maximal diameter measurements in comparison to IVUS and HD-IVUS (p<0.001) (Figure 4). Of note are the median difference of measured diameters between OCT and both IVUS modalities, which ranged from 0.42 to 0.52 mm.
Comparison of areas, minimal and maximal diameter according to IVUS, HD-IVUS and OCT.
| Area, mm2, median (IQR) | Minimal diameter, mm, median (IQR) | Maximal diameter, mm, median (IQR) | |
|---|---|---|---|
| Measurements | |||
| IVUS | 10.84 [6.43–27.12] | 4.20 [2.78–5.51] | 3.97 [3.08–6.16] |
| HD-IVUS | 11.72 [6.35–27.12] | 3.53 [2.76–5.19] | 4.44 [3.10–5.94] |
| OCT | 8.43 [5.52–22.14] | 3.58 [2.54–4.78] | 4.09 [2.99–5.53] |
| cOCT | 10.00 [6.13–25.57] | 3.84 [2.67–5.26] | 4.44 [3.08–6.01] |
| Mean difference, mean±SD | |||
| IVUS/OCT | 3.01±1.88 | 0.52±0.23 | 0.42±0.20 |
| HD-IVUS/OCT | 3.01±1.88 | 0.44±0.25 | 0.49±0.34 |
| IVUS/cOCT | 0.58±1.21 | 0.21±0.47 | 0.06±0.57 |
| HD-IVUS/cOCT | 0.64±1.32 | 0.04±0.39 | −0.01±0.52 |
| Wilcoxon analysis, p value | |||
| IVUS/HD-IVUS | 0.959 | 0.248 | 0.287 |
| Friedeman analyis, p value | |||
| IVUS/HD-IVUS/OCT | <0.001 | <0.001 | <0.001 |
| IVUS/HD-IVUS/cOCT | 0.007 | 0.092 | 0.943 |
| Correlation, p value | |||
| IVUS/OCT | <0.001 | <0.001 | <0.001 |
| HD-IVUS/OCT | <0.001 | <0.001 | <0.001 |
| IVUS/cOCT | <0.001 | <0.001 | <0.001 |
| HD-IVUS/cOCT | <0.001 | <0.001 | <0.001 |
| Linear regression | |||
| IVUS/cOCT | |||
| Slope | 1.005 | 0.980 | 0.904 |
| Intercept | 0.505 | 0.285 | 0.501 |
| R2 | 0.985 | 0.875 | 0.863 |
| p | <0.001 | <0.001 | <0.001 |
| HD-IVUS/cOCT | |||
| Slope | 0.931 | 0.873 | 0.805 |
| Intercept | 1.621 | 0.541 | 0.887 |
| R2 | 0.983 | 0.916 | 0.907 |
| p value | <0.001 | <0.001 | <0.001 |
cOCT: corrected optical coherence tomography; HD-IVUS: high definition intravascular ultrasound; IQR: interquartile range; IVUS: intravascular ultrasound; LAD: left anterior descending artery; LM: left main; MLA: minimal luminal area; NS: non-significant; OCT: optical coherence tomography; SD: standard deviation.
, minimal diameter (B) and maximal diameter (C) in all coregistered locations with IVUS, HD-IVUS, OCT and cOCT.")
As prespecified, we measured the diameters and area inside the catheter and used the correction factor obtained in each run for obtaining cOCT measurements. The median correction factor used was 1.13 [1.09–1.16]. By performing the OCT correction both minimal and maximal diameters became non significantly different to IVUS and HD-IVUS (p=0.092 and p=0.943 respectively). Corrected OCT areas remained significantly different from IVUS measurements, although the absolute difference was small (mean difference IVUS/OCT: 3.01±1.88 mm2 vs. mean difference IVUS/cOCT: 0.58±1.21 mm2). The values obtained with cOCT demonstrated an excellent correlation with those of IVUS or HD-IVUS on regression analysis (with R2 varying from 0.863 to 0.985, p<0.001). A good agreement between measurements was demonstrated with Bland–Altman analysis (Figure 5).
, minimal diameters (B) and maximal dimeters (C) with IVUS and HD-IVUS compared to cOCT.")
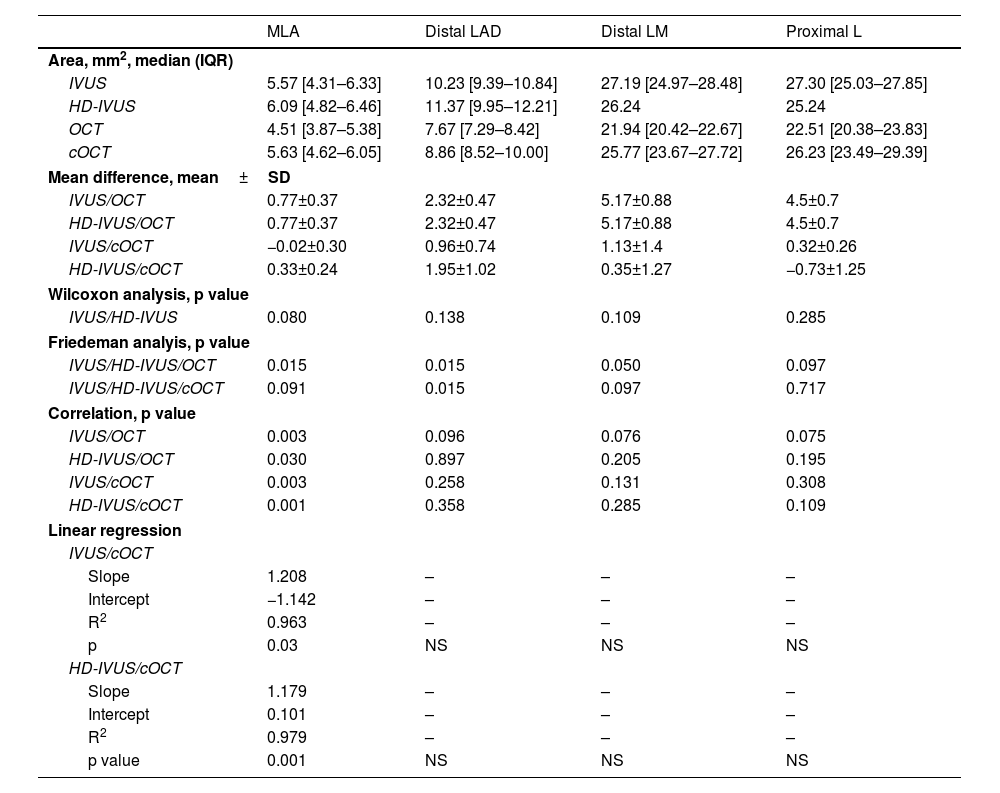
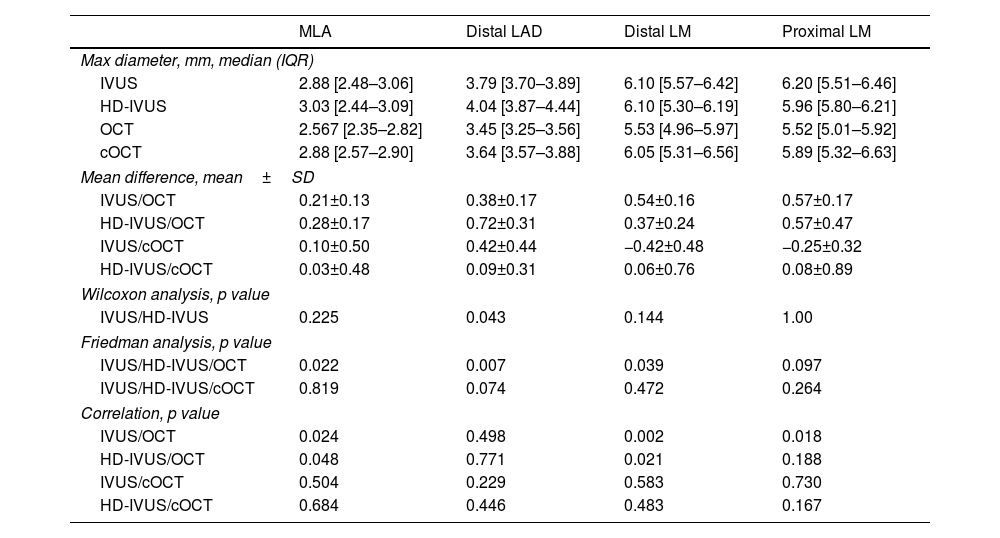
In a per location analysis, OCT significantly underestimated all dimensions except for measurements performed in the proximal LM. Although measurements at this site did not reach statistical significance, a clinically relevant undersizing of the vessels and lesion was observed, with a mean absolute difference area above 4.5 mm2 (p=0.097) and mean minimal and maximal diameter absolute difference around 0.5 mm (p=0.105 and p=0.097, respectively) (Tables 2–4).
Comparison of areas assessed in different locations according to IVUS, HD-IVUS and OCT.
| MLA | Distal LAD | Distal LM | Proximal L | |
|---|---|---|---|---|
| Area, mm2, median (IQR) | ||||
| IVUS | 5.57 [4.31–6.33] | 10.23 [9.39–10.84] | 27.19 [24.97–28.48] | 27.30 [25.03–27.85] |
| HD-IVUS | 6.09 [4.82–6.46] | 11.37 [9.95–12.21] | 26.24 | 25.24 |
| OCT | 4.51 [3.87–5.38] | 7.67 [7.29–8.42] | 21.94 [20.42–22.67] | 22.51 [20.38–23.83] |
| cOCT | 5.63 [4.62–6.05] | 8.86 [8.52–10.00] | 25.77 [23.67–27.72] | 26.23 [23.49–29.39] |
| Mean difference, mean±SD | ||||
| IVUS/OCT | 0.77±0.37 | 2.32±0.47 | 5.17±0.88 | 4.5±0.7 |
| HD-IVUS/OCT | 0.77±0.37 | 2.32±0.47 | 5.17±0.88 | 4.5±0.7 |
| IVUS/cOCT | −0.02±0.30 | 0.96±0.74 | 1.13±1.4 | 0.32±0.26 |
| HD-IVUS/cOCT | 0.33±0.24 | 1.95±1.02 | 0.35±1.27 | −0.73±1.25 |
| Wilcoxon analysis, p value | ||||
| IVUS/HD-IVUS | 0.080 | 0.138 | 0.109 | 0.285 |
| Friedeman analyis, p value | ||||
| IVUS/HD-IVUS/OCT | 0.015 | 0.015 | 0.050 | 0.097 |
| IVUS/HD-IVUS/cOCT | 0.091 | 0.015 | 0.097 | 0.717 |
| Correlation, p value | ||||
| IVUS/OCT | 0.003 | 0.096 | 0.076 | 0.075 |
| HD-IVUS/OCT | 0.030 | 0.897 | 0.205 | 0.195 |
| IVUS/cOCT | 0.003 | 0.258 | 0.131 | 0.308 |
| HD-IVUS/cOCT | 0.001 | 0.358 | 0.285 | 0.109 |
| Linear regression | ||||
| IVUS/cOCT | ||||
| Slope | 1.208 | – | – | – |
| Intercept | −1.142 | – | – | – |
| R2 | 0.963 | – | – | – |
| p | 0.03 | NS | NS | NS |
| HD-IVUS/cOCT | ||||
| Slope | 1.179 | – | – | – |
| Intercept | 0.101 | – | – | – |
| R2 | 0.979 | – | – | – |
| p value | 0.001 | NS | NS | NS |
cOCT: corrected optical coherence tomography; HD-IVUS: high definition intravascular ultrasound; IQR: interquartile range; IVUS: intravascular ultrasound; LAD: left anterior descending artery; LM: left main; MLA: minimal luminal area; NS: non-significant; OCT: optical coherence tomography; SD: standard deviation.
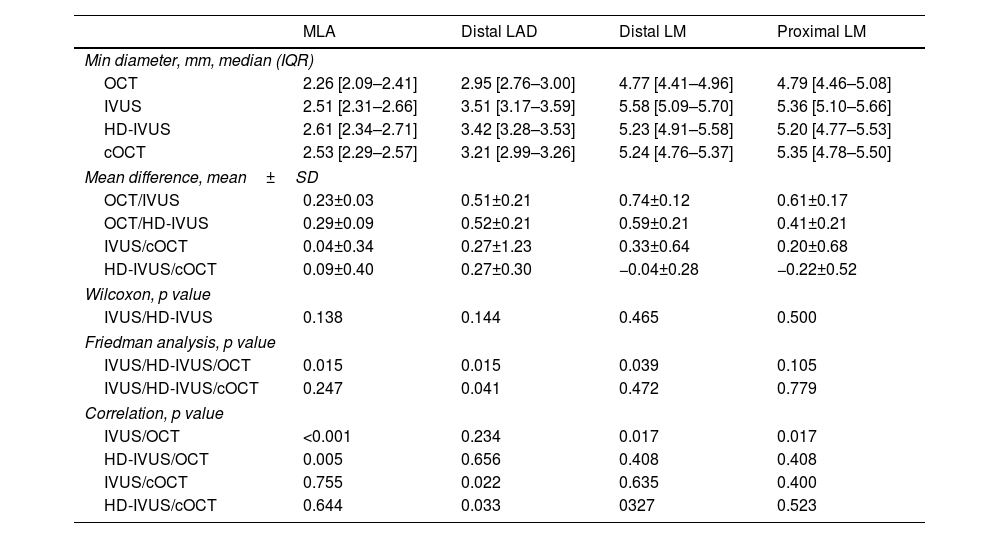
Comparison of minimal diameters according to IVUS, HD-IVUS and OCT measurements.
| MLA | Distal LAD | Distal LM | Proximal LM | |
|---|---|---|---|---|
| Min diameter, mm, median (IQR) | ||||
| OCT | 2.26 [2.09–2.41] | 2.95 [2.76–3.00] | 4.77 [4.41–4.96] | 4.79 [4.46–5.08] |
| IVUS | 2.51 [2.31–2.66] | 3.51 [3.17–3.59] | 5.58 [5.09–5.70] | 5.36 [5.10–5.66] |
| HD-IVUS | 2.61 [2.34–2.71] | 3.42 [3.28–3.53] | 5.23 [4.91–5.58] | 5.20 [4.77–5.53] |
| cOCT | 2.53 [2.29–2.57] | 3.21 [2.99–3.26] | 5.24 [4.76–5.37] | 5.35 [4.78–5.50] |
| Mean difference, mean±SD | ||||
| OCT/IVUS | 0.23±0.03 | 0.51±0.21 | 0.74±0.12 | 0.61±0.17 |
| OCT/HD-IVUS | 0.29±0.09 | 0.52±0.21 | 0.59±0.21 | 0.41±0.21 |
| IVUS/cOCT | 0.04±0.34 | 0.27±1.23 | 0.33±0.64 | 0.20±0.68 |
| HD-IVUS/cOCT | 0.09±0.40 | 0.27±0.30 | −0.04±0.28 | −0.22±0.52 |
| Wilcoxon, p value | ||||
| IVUS/HD-IVUS | 0.138 | 0.144 | 0.465 | 0.500 |
| Friedman analysis, p value | ||||
| IVUS/HD-IVUS/OCT | 0.015 | 0.015 | 0.039 | 0.105 |
| IVUS/HD-IVUS/cOCT | 0.247 | 0.041 | 0.472 | 0.779 |
| Correlation, p value | ||||
| IVUS/OCT | <0.001 | 0.234 | 0.017 | 0.017 |
| HD-IVUS/OCT | 0.005 | 0.656 | 0.408 | 0.408 |
| IVUS/cOCT | 0.755 | 0.022 | 0.635 | 0.400 |
| HD-IVUS/cOCT | 0.644 | 0.033 | 0327 | 0.523 |
cOCT: corrected optical coherence tomography; HD-IVUS: high definition intravascular ultrasound; IQR: interquartile range; IVUS: intravascular ultrasound; LAD: left anterior descending artery; LM: left main; Min: minimal; MLA: minimal luminal area; NS: non-significant; OCT: optical coherence tomography; SD: standard deviation.
Comparison of maximal diameters according to IVUS, HD-IVUS and OCT measurements.
| MLA | Distal LAD | Distal LM | Proximal LM | |
|---|---|---|---|---|
| Max diameter, mm, median (IQR) | ||||
| IVUS | 2.88 [2.48–3.06] | 3.79 [3.70–3.89] | 6.10 [5.57–6.42] | 6.20 [5.51–6.46] |
| HD-IVUS | 3.03 [2.44–3.09] | 4.04 [3.87–4.44] | 6.10 [5.30–6.19] | 5.96 [5.80–6.21] |
| OCT | 2.567 [2.35–2.82] | 3.45 [3.25–3.56] | 5.53 [4.96–5.97] | 5.52 [5.01–5.92] |
| cOCT | 2.88 [2.57–2.90] | 3.64 [3.57–3.88] | 6.05 [5.31–6.56] | 5.89 [5.32–6.63] |
| Mean difference, mean±SD | ||||
| IVUS/OCT | 0.21±0.13 | 0.38±0.17 | 0.54±0.16 | 0.57±0.17 |
| HD-IVUS/OCT | 0.28±0.17 | 0.72±0.31 | 0.37±0.24 | 0.57±0.47 |
| IVUS/cOCT | 0.10±0.50 | 0.42±0.44 | −0.42±0.48 | −0.25±0.32 |
| HD-IVUS/cOCT | 0.03±0.48 | 0.09±0.31 | 0.06±0.76 | 0.08±0.89 |
| Wilcoxon analysis, p value | ||||
| IVUS/HD-IVUS | 0.225 | 0.043 | 0.144 | 1.00 |
| Friedman analysis, p value | ||||
| IVUS/HD-IVUS/OCT | 0.022 | 0.007 | 0.039 | 0.097 |
| IVUS/HD-IVUS/cOCT | 0.819 | 0.074 | 0.472 | 0.264 |
| Correlation, p value | ||||
| IVUS/OCT | 0.024 | 0.498 | 0.002 | 0.018 |
| HD-IVUS/OCT | 0.048 | 0.771 | 0.021 | 0.188 |
| IVUS/cOCT | 0.504 | 0.229 | 0.583 | 0.730 |
| HD-IVUS/cOCT | 0.684 | 0.446 | 0.483 | 0.167 |
cOCT: corrected optical coherence tomography; HD-IVUS: high definition intravascular ultrasound; IQR: interquartile range; IVUS: intravascular ultrasound; LAD: left anterior descending artery; LM: left main; Max: maximal; MLA: minimal luminal area; NS: non-significant; OCT: optical coherence tomography; SD: standard deviation.
Optical coherence tomography correction on a per location analysis turned MLA and distal LM areas, minimal and maximal diameters non-significantly different from IVUS and HD-IVUS (Tables 2–4). Linear regression analysis demonstrated an excellent correlation for MLA comparing IVUS or HD-IVUS with cOCT (R2 from 0.90 to 0.97). Bland–Altman analysis showed good agreement between measurements comparing cOCT and IVUS.
DiscussionOur findings show that automatic Z-offset calibration method for OCT is inaccurate and results in a systematic and significant underestimation of luminal dimensions when compared to IVUS modalities in a standard 3D-printed coronary artery in a pulsatile flow realistic simulator. However, when the ratio between measured catheter area and reference catheter area was used for correcting OCT dimensions the performance of OCT estimation of phantom model dimensions was significantly improved. Good correlation was observed with IVUS modalities and without significant sizing differences. While HD-IVUS and digital 20 MHz IVUS showed good correlation in evaluating luminal dimensions with no statistically significant different measurements obtained.
Technical differences may justify at least, in part, the differences we observed in sizing with OCT and IVUS. The major advantage of IVUS when compared to OCT is its deep tissue penetration (5–6 mm), enabling full-thickness visualization of the vessel wall and enabling the usage of vessel size parameters, such as the external elastic membrane (EEM) diameter or reference lumen diameters for stent sizing.3,4,6,13 However, IVUS has a relatively low resolution, presenting limitations when it comes to the assessment of calcified plaque.1,4,5 OCT is an intravascular modality that uses infrared light (1–3 μm wave-length), which provides very high spatial resolution (axial 10–20 μm and lateral 20–90 μm), approximately ten times greater than that of IVUS.1,3–6,13 Therefore, OCT provides a more detailed evaluation of the superficial plaque and of the endoluminal surface of the vessel.1,4,5,7,13,14
Several in vivo studies have compared luminal measurements between OCT and IVUS.15–18 Kawase et al. performed measurements on stented pig arteries and demonstrated no differences in lumen areas and volumes between time domain OCT (TD-OCT) and IVUS.15 However, other studies consistently reported that lumen dimensions measured by OCT were significantly smaller than those by IVUS.16–19 In a clinical study by Yamaguchi et al., MLD and MLA measured by TD-OCT were significantly correlated with those measured by IVUS. The measurements using OCT were significantly smaller than those using IVUS.16 Capodanno et al. showed that lumen area measured by TD-OCT using a non-occlusive imaging technique was significantly smaller than that by IVUS.17 Also, Okamura et al. reported that MLA measured by a Terumo intravascular optical frequency domain imaging system (Terumo Corp., Tokyo, Japan) was smaller than that by IVUS (relative reference −6.7%).18 In a study of 70 patients with stable and unstable angina undergoing PCI, Habara et al., assessed the result using OCT and IVUS.19 This study showed that minimal stent area and mean stent area were smaller, and stent expansion was also reduced in the OCT group.19 Also, the frequency of significant residual reference segment stenosis at the proximal edge was higher in the OCT group (p<0.05).19 Our results build on to previous evidence that OCT may underestimate luminal dimensions. By using a controlled 3D-printed phantom model we were able to control some of the variables that may influence measurements in clinical practice.
More recently, head-to-head prospective comparative studies between IVUS and OCT-guided PCI have emerged, comparing angiographic results and clinical outcomes.5,9,10,20 In ILUMIEN III trial (Optical Coherence Tomograhy Compared With Intravascular Ultrasound and With Angiography to Guide Coronary Stent Implantation), a specific protocol to establish stent length, diameter, and expansion according to reference segment EEM measurements was used (similar to IVUS-guided PCI) to account for possible OCT underestimation of luminal dimensions.10 The comparative results in non-complex lesions did not show a statistical difference in clinical outcomes at 12-month follow-up between the two modalities regarding target lesion failure (2.0% OCT; 3.7% IVUS) and major adverse cardiovascular events (9.8% OCT; 9.1% IVUS).10 In the OPINION trial (Optical Frequency Domain Imaging vs. Intravascular Ultrasound in Percutaneous Coronary Intervention), the lumen diameter measurement for stent sizing with OCT resulted in a significantly smaller mean stent diameter than the IVUS (p=0.005).5 Also, there was a trend toward the use of longer stents in OCT-guided PCI.5 There was no statistically significant difference between the two modalities in the primary outcome (target vessel failure within 12 months 5.2% OCT; 4.9% IVUS, p=0.042 for non-inferiority testing).5 Considering the results of these clinical trials, OCT-guided PCI seems to be noninferior to IVUS guidance for both acute and long term outcomes.5,10 Nonetheless, chosen stent size is significantly smaller when OCT is the intravascular modality chosen,3,5 which may contribute to smaller stent implantation, as well as a higher frequency of post-dilatation.20 Indirect evidence shows that smaller stents relate to restenosis and thrombosis in long term follow-up.21
In the MISTIC trial (Comparison Between Optical Frequency Domain Imaging and Intravascular Ultrasound for Percutaneous Coronary Intervention Guidance in Biolimus A9-Eluting Stent Implantation), no significant differences in either mean stent diameter or postprocedural minimum stent area between OCT and IVUS groups were observed, presumably due to the lumen up-sizing protocol for stent sizing used in the OCT group.20 Angiographic and clinical outcomes were similar at eight months and three years, respectively.21
In the iSIGHT randomized trial (Optical Coherence Tomography Versus Intravascular Ultrasound and Angiography to Guide Percutaneous Coronary Interventions), stent expansion with OCT guidance using a dedicated external elastic membrane-based sizing strategy was also used, which explains that stent expansion with OCT guidance was noninferior to IVUS (p<0.001).9 The results achieved in OCT-guided PCI were noninferior to those achieved with IVUS and superior to an optimized angiographic strategy.9
Our results emphasize that OCT is consistently found to have smaller measurements (MLA and diameters) than those of IVUS and HD-IVUS. Measurements taken at the proximal LM were the only ones that did not show significant statistical difference between the two intravascular modalities. This area is, however, known to be difficult to image with OCT in clinical practice. Even though the difference was not statistically significant, it would be clinically relevant, as a mean minimal and maximal diameter absolute difference around 0.5 mm would have impact on stent sizing.
Several theories have emerged to justify the difference in sizing observed between OCT and IVUS.3,4,6,13 The most popular belief is that IVUS, because of lower spatial resolution, is not able to differentiate clearly between the intima and blood interface resulting in measurements that extend to media or external elastic lamina.3,4,6,13 However, by using a 3D-printed phantom model in which only the luminal interface could be evaluated using IVUS, we showed that OCT undersizing is systematic and possibly related to Z-offset calibration error. The Z-offset is an automatically or manually adjustable image calibration that is critical for accurate OCT measurements. When the sheath of the OCT catheter is aligned with the four yellow fiducials in the OCT image, the Z-offset is correctly adjusted. However, there may be several problems in that calibration. First, during image acquisition the optical fibers can stretch, resulting in possible changes in the size of the Z-offset. Secondly, by using a very small sheath for calibration, any small calibration error may be amplified. However, our results suggest that the calibration error is to consistently undersize dimensions. By including the guiding catheter in the acquired OCT frames, we can have a known reference for estimating dimensions. In fact, our study shows that, by applying a correction factor based on the expected/observed catheter dimensions, we can obtain luminal dimensions that are related and comparable to those obtained by IVUS. In order to perform an optimize PCI and achieve the best possible stent result, a protocol to correct OCT measurements is essential. We propose a guiding catheter correction strategy, which provides OCT measurements similar to those obtained with IVUS. This approach could be useful in clinical practice to correct for OCT undersizing when guiding interventional procedures and should be explored in subsequent clinical studies.
Our study is limited by relying on material characteristics that differ from real arteries. However, we controlled for most of the variables we could by using flexible 3D-printed material in a simulator using pulsatile flow. Also, a gold standard for true anatomical dimensions such as micro-computed tomography could be useful for further validation of the findings.
ConclusionIn conclusion, our findings suggest that automatic calibration for OCT is inaccurate and results in a systematic underestimation of luminal dimensions. Guiding catheter dimensions are easily and precisely known and can be used as reference for geometric calibration. When guiding catheter correction is applied the performance of OCT estimation of 3D-printed phantom model dimensions is significantly improved. These results may be clinically relevant and need to clinically validated clinically.
Conflicts of interestThe authors have no conflicts of interest to declare.
We thank for the stents and OCT/IVUS catheters, that were provided by the manufactures.
