Pulmonary embolism (PE) is a life-threatening condition, in which diagnostic uncertainty remains high given the lack of specificity in clinical presentation. It requires confirmation by computed tomography pulmonary angiography (CTPA). Electrocardiography (ECG) signals can be detected by artificial intelligence (AI) with precision. The purpose of this study was to develop an AI model for predicting PE using a 12-lead ECG.
MethodsWe extracted 1014 ECGs from patients admitted to the emergency department who underwent CTPA due to suspected PE: 911 ECGs were used for development of the AI model and 103 ECGs for validation. An AI algorithm based on an ensemble neural network was developed. The performance of the AI model was compared against the guideline recommended clinical prediction rules for PE (Wells and Geneva scores combined with a standard D-dimer cut-off of 500 ng/mL and an age-adjusted cut-off, PEGeD and YEARS algorithm).
ResultsThe AI model achieves greater specificity to detect PE than the commonly used clinical prediction rules. The AI model shown a specificity of 100% (95% confidence interval (CI): 94–100) and a sensitivity of 50% (95% CI: 33–67). The AI model performed significantly better than the other models (area under the curve 0.75; 95% CI 0.66–0.82; p<0.001), which had nearly no discriminative power. The incidence of typical PE ECG features was similar in patients with and without PE.
ConclusionWe developed and validated a deep learning-based AI model for PE diagnosis using a 12-lead ECG and it demonstrated high specificity.
O tromboembolismo pulmonar é uma condição com elevada mortalidade, cujo diagnóstico constitui um desafio devido à frequente apresentação com sintomatologia inespecífica, requerendo confirmação diagnóstica por exame de imagem. Os sinais deletrocardiográficos podem ser detetados por mecanismos de inteligência artificial com precisão. O objetivo deste estudo foi desenvolver um modelo de inteligência artificial (IA) capaz de predizer embolia pulmonar (EP) com base no eletrocardiograma (ECG) de 12 derivações.
MétodosForam extraídos 1014 ECGs de doentes admitidos no serviço de urgência e em que foi realizada tomografia computorizada (TC) por suspeita de EP: 911 ECGs foram usados para o desenvolvimento do modelo e 103 ECGs foram usados para validação. Foi desenvolvido um modelo de IA com base no ECG de 12 derivações. O desempenho do modelo de IA foi comparado com os modelos de predição clínica de EP atualmente recomendados (score de Wells e de Geneva em combinação com um cut-off de D-dimer standard e com um cut-off ajustado à idade, algoritmo de PEGeD e algoritmo de YEARS).
ResultadosO modelo de IA demonstrou uma especificidade de 100% [95% CI: 94-100] e uma sensibilidade de 50% [95% CI: 33-67] para a deteção de EP. O modelo de IA demonstrou uma performance global significativamente superior aos restantes modelos (AUC 0,75; 95% CI 0,66-0,82; p<0,001), os quais demonstraram praticamente não ter poder discriminativo. A incidência dos achados eletrocardiográficos típicos de EP foi similar nos doentes com e sem EP.
ConclusãoNeste estudo foi desenvolvido e validado um modelo de inteligência artificial para o diagnóstico de embolia pulmonar baseado no ECG de 12 derivações, que demonstrou elevada especificidade para o diagnóstico de embolia pulmonar em contexto de urgência.
Pulmonary embolism (PE) is a life-threatening condition that presents most of the time with non-specific signs and symptoms.1 It represents 2–9% of all causes of out-of-hospital cardiac arrest and it can be associated with an extremely unfavorable prognosis.2
In the absence of contraindications, systemic thrombolysis is the standard treatment for hemodynamically unstable PE patients, as it has been shown to improve survival.1 As the adverse effects of thrombolysis-related bleeding can be devastating, it should only be performed in patients with a high suspicion of or confirmed PE, whose risk/benefit profile favors thrombolytic therapy.1 However, given the lack of specificity in the clinical presentation of PE, the decision to perform fibrinolysis is challenging. Most clinicians may be highly resistant to recommending empirical fibrinolysis due to the uncertainty of the diagnosis.
Computed tomography pulmonary angiography (CTPA) is often required to establish the definitive diagnosis of acute PE.1 However, CTPA cannot be performed in hemodynamically unstable patients and it is not available in out-of-hospital settings and even in a hospital setting, it is not often readily available. Although echocardiography may be helpful in establishing the diagnosis, it is generally unavailable in an out-of-hospital setting, and only a few clinicians can perform a reliable examination to indicate empirical fibrinolysis. These constraints may explain why only a minority of hemodynamically unstable PE patients receive thrombolytic therapy.3 Thus, safely identifying patients with high-risk PE who may benefit from empirical thrombolysis is challenging but critical to delivering proper treatment, thus avoiding exposure to unnecessary bleeding risk.
An electrocardiogram (ECG) is a low-cost, rapid, and widely available test that cardiologists and non-cardiologists have used for decades. Previous studies that applied ECG scoring systems for acute PE diagnosis demonstrated a reasonable performance, but it is a time consuming process, requires expertise for ECG interpretation and is not routinely implemented in clinical practice.4,5
Artificial intelligence (AI) is increasingly being applied in various fields of cardiology, including ECG analysis.6–8 Several studies reported using AI to analyze ECG signals in order to detect cardiovascular conditions, such as arrhythmias, left ventricular dysfunction and hypertrophic cardiomyopathy.7–10 In this study, we aimed to develop and validate a deep learning-based AI model for detecting PE using a conventional 12-lead ECG and to compare the results of this model with the ones obtained with the traditional clinical prediction rules.
MethodsStudy design and populationThe single-center study was performed at a tertiary university hospital between 2017 and 2021. A total of 1414 patients were included for screening in the study. Considering that part of the study was carried out during the COVID-19 pandemic, 300 patients with SARS-COV2 infection diagnosis were excluded given the known impact of the SARS-COV2 infection on D-dimer levels, impacting the sensitivity and specificity of algorithms that comprises D-dimer measurements. In addition, 100 patients were excluded due to inconclusive CTPA or no D-dimer measurement. 1014 patients were included in the final analysis, and we retrospectively extracted the corresponding ECGs of patients admitted to the emergency department (ED) who underwent CTPA due to suspected PE. Of those, 911 ECGs were used for the development of the AI model (derivation cohort) and 103 ECGs were used for testing the PE prediction model (validation cohort).
Patient demographics and clinical and laboratory data were collected by an investigator blinded to the CTPA reports. A D-dimer assay (HemosIL® D-Dimer HS 500) measured plasma D-dimer levels with a reported cut-off value of 500 ng/mL. Only patients with a D-dimer measurement obtained within 12 hours before CTPA were included. Due to retrospective analysis of data, the need for informed consent was waived by our institution.
EndpointsThe primary endpoint was the presence of PE on CTPA. The second endpoint was to compare the performance of the AI model against the guideline-based recommended prediction rules for PE diagnosis based on clinical probability and D-dimer measurement: Wells and Geneva scores combined with a fixed D-dimer cut-off of 500 ng/mL and an age-adjusted D-dimer cut-off, YEARS and PEGeD algorithms.
Computed tomography protocolComputed tomography (CT) was performed with a 16-slice multi-detector CT (Siemens®) after intravenous injection of 60–90 mL of iodinated contrast agent. The CTPA scans were interpreted by the attending radiologist and reviewed at the time of inclusion in the study by a second radiologist, who was blinded to the clinical information. Diagnosis of PE was based on filling defects of the pulmonary artery in at least two consecutive axial sections.
Scores and model assessmentThe deep learning AI model performance was compared to the following guideline recommended clinical prediction rules.1
The Wells score classifies patients as having low, moderate or high pretest probability of PE (<4.0 points, 4.5–6.0 points, and ≥6.5 points, respectively), according to the following criteria: signs and symptoms of deep vein thrombosis (three points), PE as the first diagnosis or equally likely (three points), previous diagnosis of PE or deep vein thrombosis (1.5 points), heart rate >100 beats per minute (1.5 points), malignancy with treatment within six months or palliative (one point) and hemoptysis (one point).1
The revised Geneva score considers the following: pain on limb palpation and unilateral edema (four points), unilateral lower limb pain (three points), previous diagnosis of PE or deep vein thrombosis (three points), heart rate >95 or between 75 and 94 beats per minute (five and three points, respectively), active malignant condition (two points), hemoptysis (two points), surgery of fracture within one month (two points), and age >65 years (one point). Patients were categorized as having low, moderate or high clinical probability of PE according to the total points (0–3 points, 4–10 points and ≥11 points, respectively).1
For both Wells and Geneva-based prediction rules, patients classified as having high clinical probability are directly selected to perform CTPA, irrespective of D-dimer levels. Patients with low or moderate clinical probability perform CTPA if they have a D-dimer level >500 ng/mL in the standard strategy, or above their defined individual cut-off in the age-adjust approach.1 The age-adjusted individual D-dimer cut-off was defined by multiplying the patient's age by ten in patients >50.11
The YEARS algorithm comprises three clinical items: hemoptysis, signs of deep vein thrombosis, and whether PE is the most likely diagnosis.12 PE was excluded in patients with 0 items and a D-dimer level of less than 1000 ng/mL, or with one or more YEARS items and a D-dimer level less than 500 ng/mL. The remaining patients should perform CTPA.
The PEGeD algorithm is based on clinical pre-test probability, evaluated by Wells score, combined with D-dimer measurement.13 Pulmonary embolism was excluded in patients with low pretest probability and a D-dimer level less than 1000 ng/mL or with a moderate pretest probability and a D-dimer level of less than 500 ng/mL. All other patients, including those with high clinical pretest probability, perform CTPA.
Development of the attention-enhanced residual network for detecting pulmonary embolismBased on the known deep learning models developed for the diagnosis of arrhythmias,14,15 we decided to use a residual network architecture.16 This architecture includes skip connections that can more easily transmit information between network layers, making them easier to train and appropriate for ECG analysis. After several tests, we concluded that a multi-head attention layer added to the network before the output layer increases the network perception of small details on the ECG and improves specificity.17 This led to the attention-enhanced residual network architecture that obtained the best results.
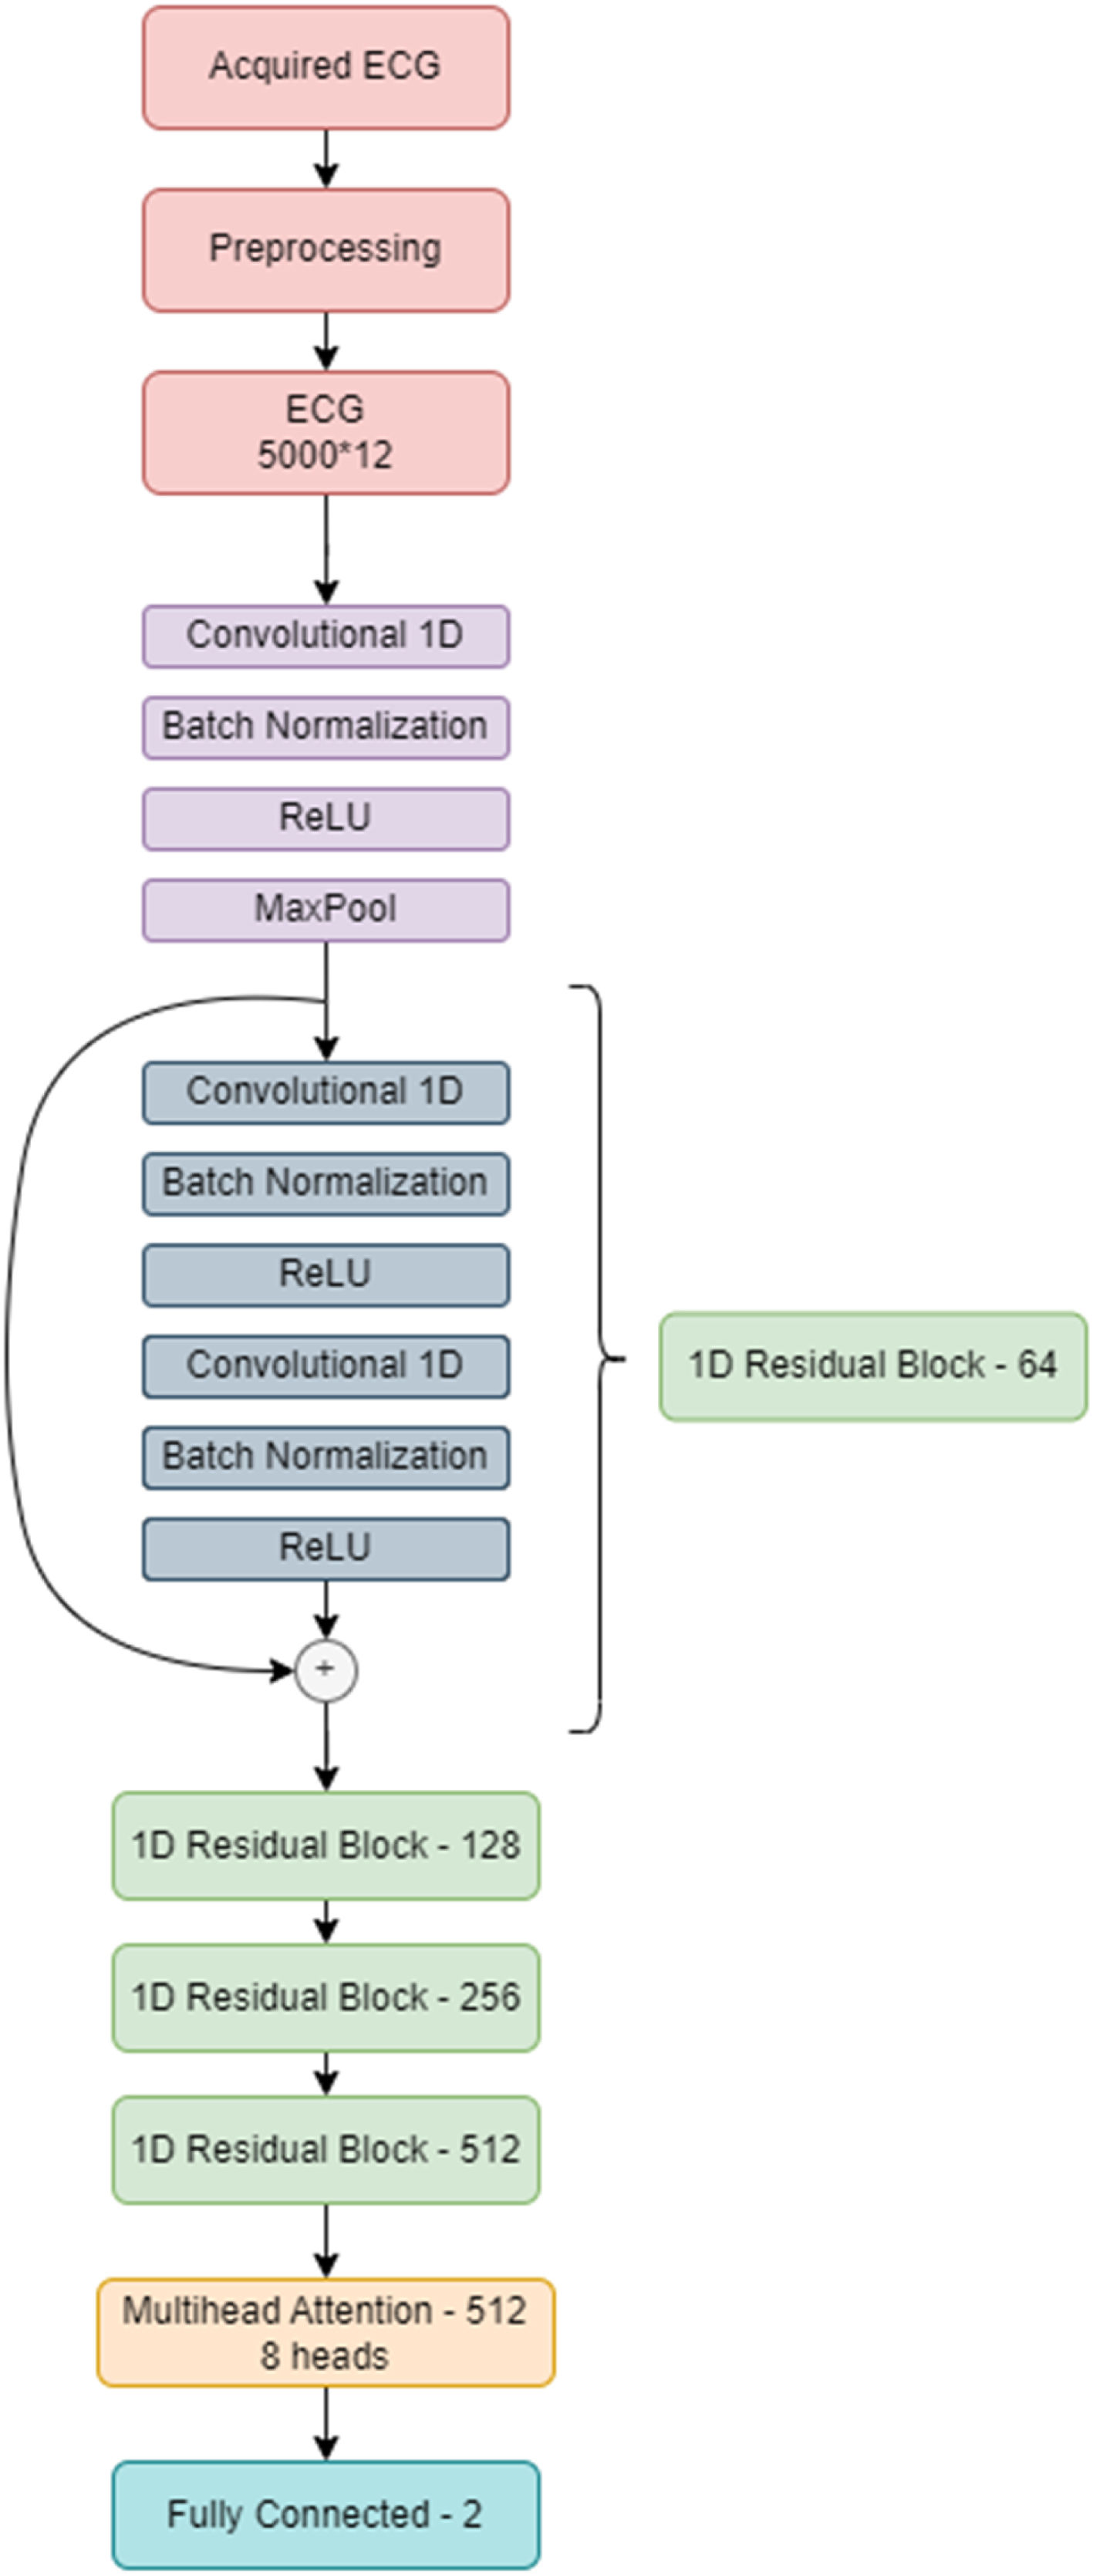
In this architecture, the input is the ECG, acquired from DotLogic software, a discrete signal with 12 leads, each one with 5000 samples acquired over 10 seconds. Before sending this ECG to the deep neural network, we applied pre-processing techniques to make it easier for the network to ignore the noise and focus on important details. This pre-processing step comprises a low pass filter to remove noise and a Z-score normalization to center the ECGs voltage around 0. ECGs with too much noise are removed from the training dataset. This pre-processed signal is then used as an input to the model. Each ECG has 5000×12 data points, and each lead was interpreted as an individual channel. The final model comprises a 1 dimensional (1D) ResNet 18, which is a standard residual network with two dimensional operations adapted to the 1D case scenario. Instead of performing an average pooling operation, the network performs a self-multi-head attention operation before sending all the learned information to the output layer. The model was developed on PyTorch and trained using a NVIDIA 32GB V100S installed in a DELL PowerEdge C41402 server.
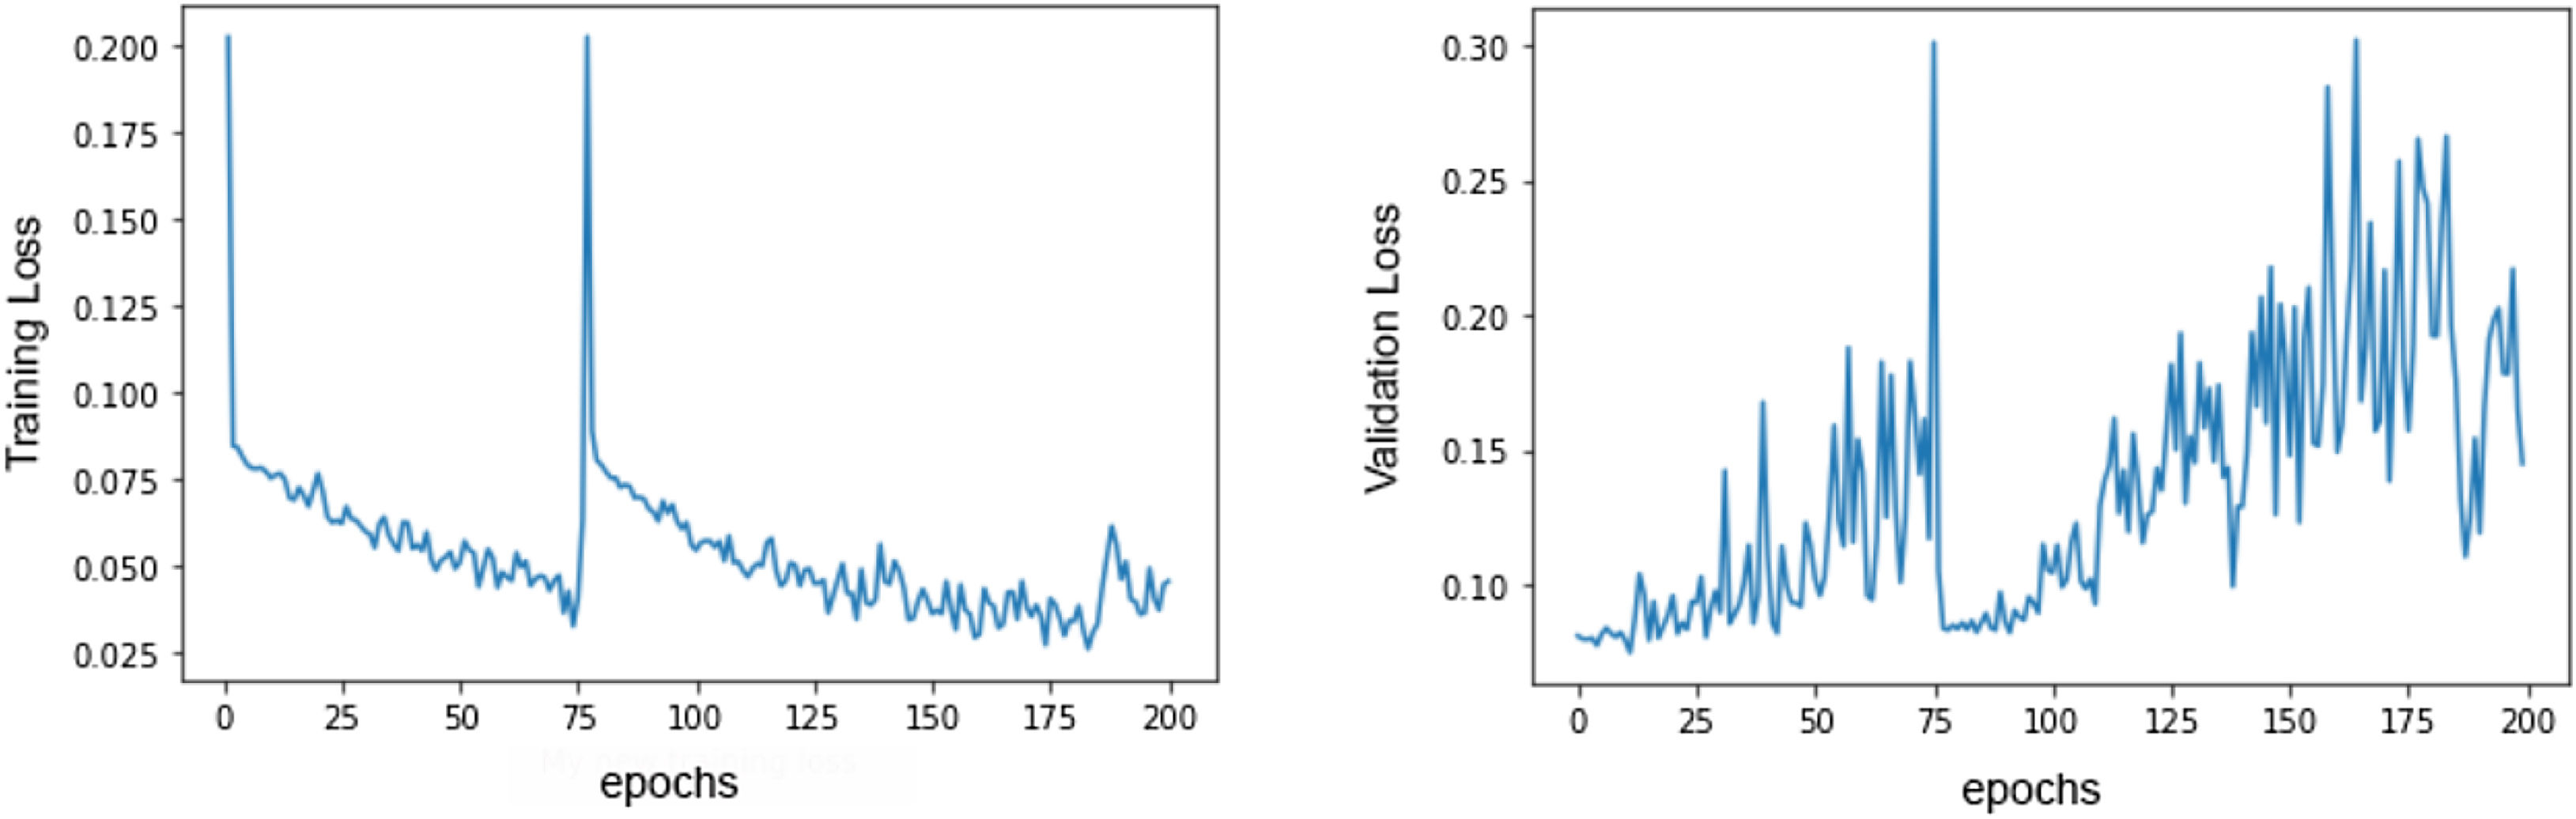
Several data augmentation techniques were applied to increase the model ability to generalize to previously unseen ECGs.18 These include: random drop (dropping a temporal segment of the signal to 0 voltage value; temporal shifts (just 4096 data points from each lead are used at a time, so 1-second time shifts can be performed); and signal addition (such as adding a sinusoidal function to the ECG). As the training dataset comprised 222 positive cases (corresponding to ECGs of patients with PE diagnosis) and 604 negative cases (corresponding to ECGs of patients without PE), it was easier for the network to focus on the negative class. To overcome this limitation, we applied a special loss function called focal loss,19 which made errors in diagnosing positive examples more costly than misclassifying the negative class, leading to an improvement of the network attention toward the positive class. Our model improves its performance by looking at the examples in the training set and trying to predict the corresponding class. Each time it misclassifies an example, a loss value is measured and then added to a global loss value. The network thus tries to minimize the global loss at each epoch (an epoch is looking at all the training samples once) and, as a consequence, become more accurate. Figure 1 illustrates the evolution in loss value. The best model was achieved around the epoch number 75, where the model's loss was at a minimum.

Figure 2 illustrates the neural network architecture and its different layers.
Statistical analysis
Continuous variables were presented as mean and standard deviation (SD) and were compared using the independent samples t-test or Mann–Whitney U test, according to whether the distribution was normal or not. Categorical variables were expressed as frequencies and percentages and were compared using the chi-square test or Fisher's exact test, as appropriate based on distribution. At each input of validation data, the deep learning model computed the probability of PE in the range of 0 (non-PE) to 1 (PE). AI model performance was tested against the four clinical prediction rules. Measurements of the diagnostic performance include sensitivity, specificity, positive predictive value, negative predictive value and area under the curve (AUC) of the receiver operating characteristic curve (ROC).
Receiver operating characteristic curves were compared using the De-Long method. All values were reported with a two-tailed 95% confidence interval. Statistical significance was defined as a p<0.05, except for comparisons of the diagnostic prediction rules in which the Bonferroni procedure was used to account for the 21 multiple comparisons with a p value of 0.002 or less considered to indicate statistical significance. Data were analyzed using SPSS® v.26 (IBM) for statistical analysis.
ResultsIn this study we included 1014 patients admitted to an ED who underwent CTPA due to suspected PE. Of those, data from 911 patients were used for the development of the deep learning model (derivation cohort) and 103 patients were used for testing and validation (validation cohort). As the development of the AI model was previously described, in the results section we focus on the performance of the AI model in the validation cohort.
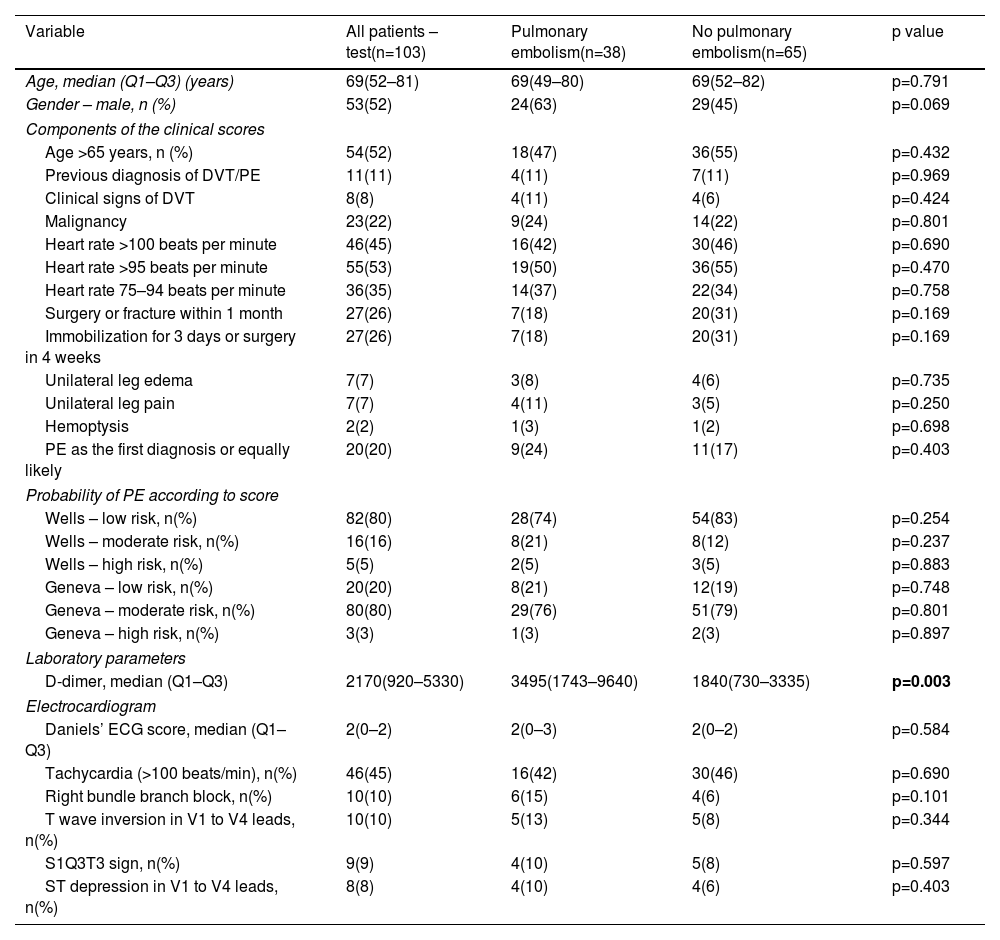
A total of 103 patients were included in the validation cohort: mean age 69 (IQR 52–81) years, 53% male. Of those, PE was confirmed by CTPA in 38 patients (37%). Regarding patients with PE, the vascular allocation of emboli showed a predominantly central distribution (n=34, 89%), affecting main and lobar arteries (47% and 42%, respectively). Bilateral involvement was documented in 16 patients (42%), and 22 patients (58%) had evidence of right heart strain. The prevalence of classical risk factors for venous thromboembolism in patients with and without PE is represented in Table 1.
Comparison of demographic and clinical features of patients with and without pulmonary embolism.
| Variable | All patients – test(n=103) | Pulmonary embolism(n=38) | No pulmonary embolism(n=65) | p value |
|---|---|---|---|---|
| Age, median (Q1–Q3) (years) | 69(52–81) | 69(49–80) | 69(52–82) | p=0.791 |
| Gender – male, n (%) | 53(52) | 24(63) | 29(45) | p=0.069 |
| Components of the clinical scores | ||||
| Age >65 years, n (%) | 54(52) | 18(47) | 36(55) | p=0.432 |
| Previous diagnosis of DVT/PE | 11(11) | 4(11) | 7(11) | p=0.969 |
| Clinical signs of DVT | 8(8) | 4(11) | 4(6) | p=0.424 |
| Malignancy | 23(22) | 9(24) | 14(22) | p=0.801 |
| Heart rate >100 beats per minute | 46(45) | 16(42) | 30(46) | p=0.690 |
| Heart rate >95 beats per minute | 55(53) | 19(50) | 36(55) | p=0.470 |
| Heart rate 75–94 beats per minute | 36(35) | 14(37) | 22(34) | p=0.758 |
| Surgery or fracture within 1 month | 27(26) | 7(18) | 20(31) | p=0.169 |
| Immobilization for 3 days or surgery in 4 weeks | 27(26) | 7(18) | 20(31) | p=0.169 |
| Unilateral leg edema | 7(7) | 3(8) | 4(6) | p=0.735 |
| Unilateral leg pain | 7(7) | 4(11) | 3(5) | p=0.250 |
| Hemoptysis | 2(2) | 1(3) | 1(2) | p=0.698 |
| PE as the first diagnosis or equally likely | 20(20) | 9(24) | 11(17) | p=0.403 |
| Probability of PE according to score | ||||
| Wells – low risk, n(%) | 82(80) | 28(74) | 54(83) | p=0.254 |
| Wells – moderate risk, n(%) | 16(16) | 8(21) | 8(12) | p=0.237 |
| Wells – high risk, n(%) | 5(5) | 2(5) | 3(5) | p=0.883 |
| Geneva – low risk, n(%) | 20(20) | 8(21) | 12(19) | p=0.748 |
| Geneva – moderate risk, n(%) | 80(80) | 29(76) | 51(79) | p=0.801 |
| Geneva – high risk, n(%) | 3(3) | 1(3) | 2(3) | p=0.897 |
| Laboratory parameters | ||||
| D-dimer, median (Q1–Q3) | 2170(920–5330) | 3495(1743–9640) | 1840(730–3335) | p=0.003 |
| Electrocardiogram | ||||
| Daniels’ ECG score, median (Q1–Q3) | 2(0–2) | 2(0–3) | 2(0–2) | p=0.584 |
| Tachycardia (>100 beats/min), n(%) | 46(45) | 16(42) | 30(46) | p=0.690 |
| Right bundle branch block, n(%) | 10(10) | 6(15) | 4(6) | p=0.101 |
| T wave inversion in V1 to V4 leads, n(%) | 10(10) | 5(13) | 5(8) | p=0.344 |
| S1Q3T3 sign, n(%) | 9(9) | 4(10) | 5(8) | p=0.597 |
| ST depression in V1 to V4 leads, n(%) | 8(8) | 4(10) | 4(6) | p=0.403 |
DVT: deep vein thrombosis; PE: pulmonary embolism.
In bold, significant p value (p<0.005).
There were no differences in pretest clinical probability evaluated by Wells and revised Geneva scores between both groups. Although elevated in all patients, those with PE had significantly higher D-dimer levels compared to those without PE (3495 (IQR 1743–9640) vs. 1804 (IQR 730–3335), p=0.003).
In addition, regarding typical electrocardiographic findings for PE, such as tachycardia, right bundle branch block, S1Q3T3, and T wave inversion or ST depression in V1 to V4 leads, no difference was found between patients with and without PE (p>0.05 for all). No difference was found in Daniels’ ECG score between patients with and without PE (median 2 (IQR 0–3) and median 2 (IQR 0–2), p=0.584).
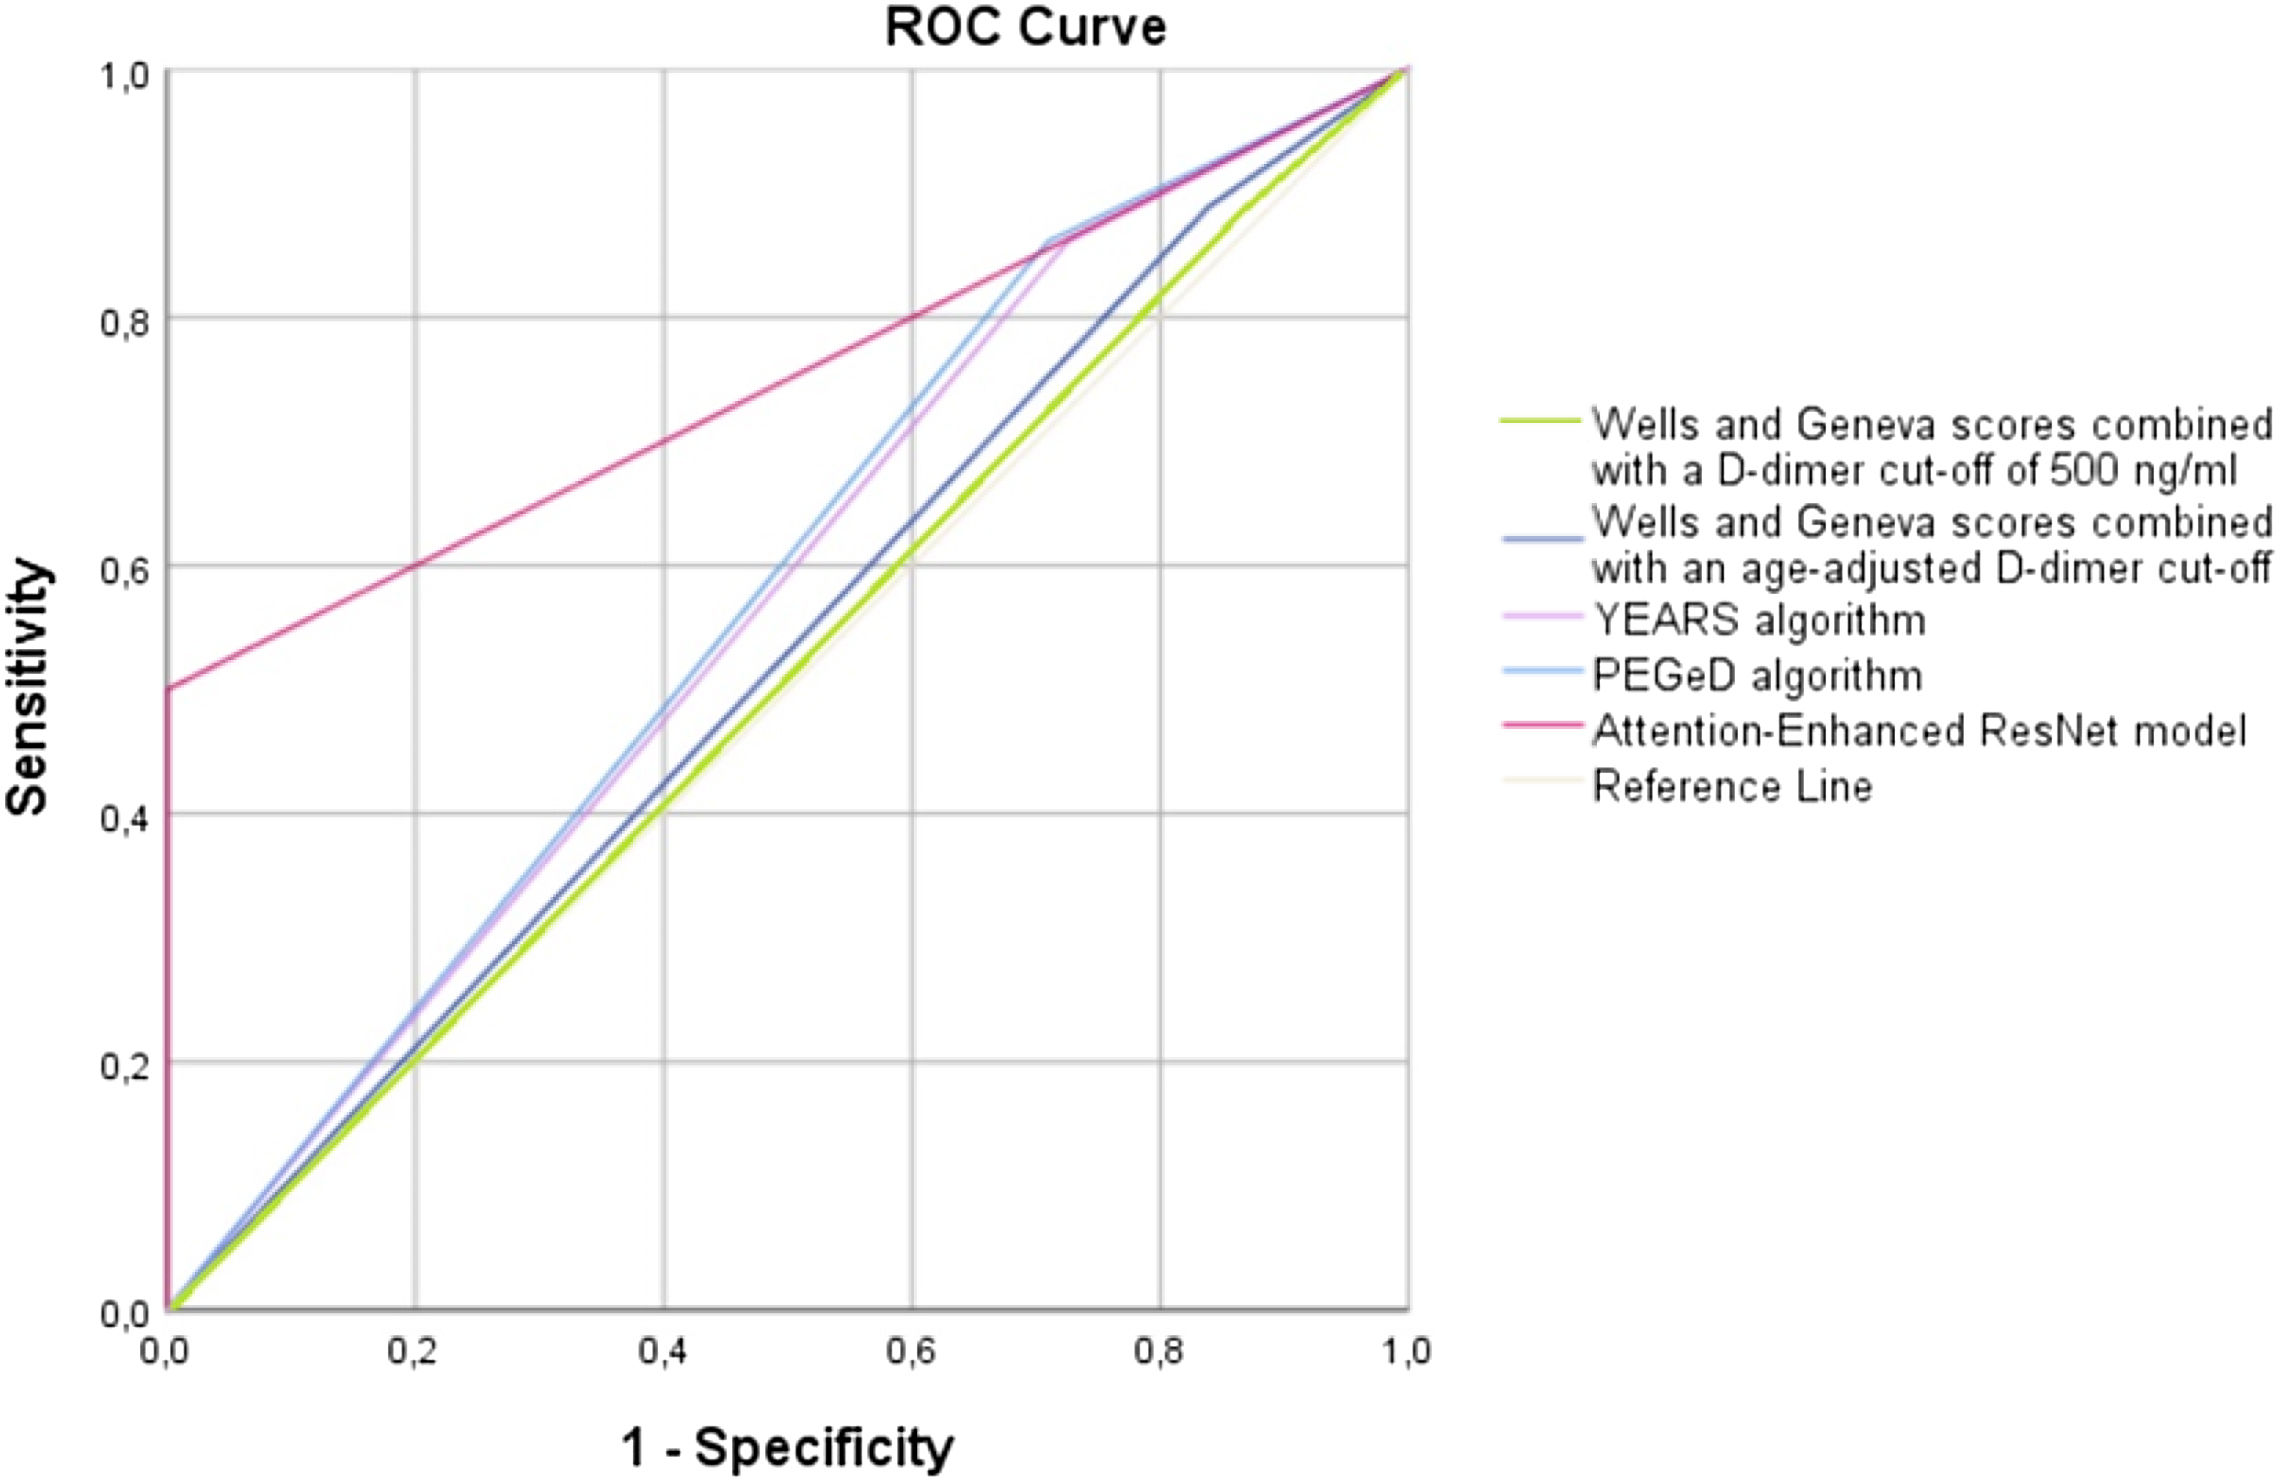
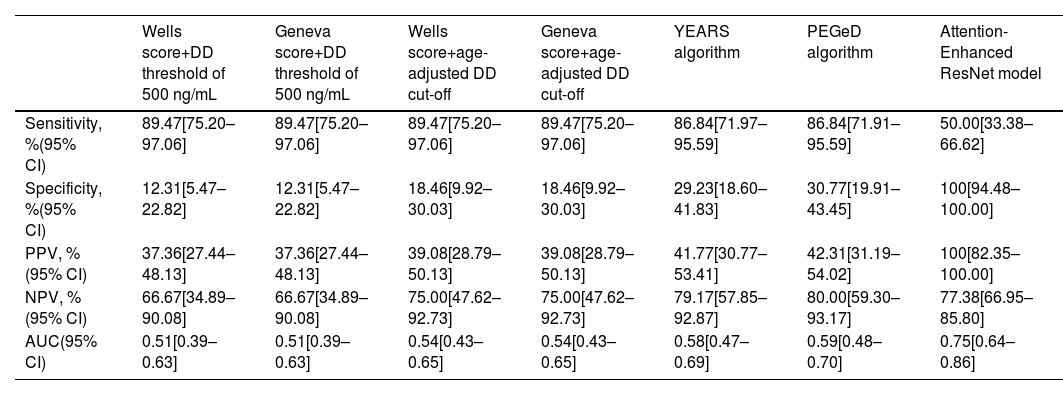
Table 2 shows the diagnostic performance of the different prediction rules for PE. In our cohort, we found that the use of a fixed D-dimer threshold of 500 ng/mL or an age-adjusted cut-off was associated with similar sensitivity, although the use of an age-adjusted cut-off was associated with non-statistically significant higher specificity for both Wells and Geneva scores (p=0.125). However, even considering the age-adjusted cut-off, the specificity remains low (18%). Globally, the AUC for both Wells and Geneva score combined with a cut-off of 500 ng/mL and an age-adjusted cut-off suggests nearly no discriminative power. The YEARS and PEGeD algorithms were both associated with a non-significant decrease in sensitivity compared to Wells and Geneva algorithms, with a significant increase in specificity (p=0.001 for both). However, even with the use of this algorithm, the specificity remains above 31%. The AI model was associated with a significantly decrease in sensitivity compared to the other models (p=0.003 for YEARS and PEGeD algorithms; p=0.001 for Wells and Geneva algorithms combined with fixed or an age-adjusted cut-off). The documented specificity for the diagnosis of acute PE of the AI model was 100%, which is significantly higher compared to the other models (p<0.002 for all of them). Use of the new deep learning model for the identification of acute PE among ED patients achieved an AUC of 0.75 (95% CI 0.66–0.82; p<0.001), performing significantly better than all other models (p<0.05 for Wells and Geneva score combined with fixed and age-adjusted cut-off, YEARS and PEGeD algorithms). A graphical representation of the ROC curves is shown in Figure 3.
Diagnostic accuracy of Wells and Geneva scores combined with a fixed and an age-adjusted cut-off, YEARS algorithm and PEGeD algorithm to predict pulmonary embolism.
| Wells score+DD threshold of 500 ng/mL | Geneva score+DD threshold of 500 ng/mL | Wells score+age-adjusted DD cut-off | Geneva score+age-adjusted DD cut-off | YEARS algorithm | PEGeD algorithm | Attention-Enhanced ResNet model | |
|---|---|---|---|---|---|---|---|
| Sensitivity, %(95% CI) | 89.47[75.20–97.06] | 89.47[75.20–97.06] | 89.47[75.20–97.06] | 89.47[75.20–97.06] | 86.84[71.97–95.59] | 86.84[71.91–95.59] | 50.00[33.38–66.62] |
| Specificity, %(95% CI) | 12.31[5.47–22.82] | 12.31[5.47–22.82] | 18.46[9.92–30.03] | 18.46[9.92–30.03] | 29.23[18.60–41.83] | 30.77[19.91–43.45] | 100[94.48–100.00] |
| PPV, %(95% CI) | 37.36[27.44–48.13] | 37.36[27.44–48.13] | 39.08[28.79–50.13] | 39.08[28.79–50.13] | 41.77[30.77–53.41] | 42.31[31.19–54.02] | 100[82.35–100.00] |
| NPV, %(95% CI) | 66.67[34.89–90.08] | 66.67[34.89–90.08] | 75.00[47.62–92.73] | 75.00[47.62–92.73] | 79.17[57.85–92.87] | 80.00[59.30–93.17] | 77.38[66.95–85.80] |
| AUC(95% CI) | 0.51[0.39–0.63] | 0.51[0.39–0.63] | 0.54[0.43–0.65] | 0.54[0.43–0.65] | 0.58[0.47–0.69] | 0.59[0.48–0.70] | 0.75[0.64–0.86] |
CTPA: computed tomography pulmonary angiography; DD: D-dimer; NPV: negative predictive value; PPV: positive predictive value.
 curve demonstrating the diagnostic performance of different decision rules to predict pulmonary embolism.")
In this study, we developed and validated a deep learning-based model for PE detection using a 12-lead ECG, which has the major advantage of 100% specificity. To our knowledge, this study is the first to develop a deep learning model for detecting acute PE based solely on ECG.
The management of PE in the ED is of critical importance to decrease mortality rate. Given the potential benefit of anticoagulation or systemic thrombolytic therapy, every effort should be made to diagnose acute PE quickly and accurately. However, clear medical history is often difficult to obtain in most patients, particularly those with hemodynamic instability, who benefit the most from thrombolytic therapy.
There are many diagnostic tools with high sensitivity for diagnosing PE.1 In our study, the combination of clinical prediction scores, such as the Geneva and Wells scores, with D-dimer measurement was associated with around 90% of sensitivity, similar to the previously documented.20,21 However, these strategies were associated with a lack of specificity,20,21 which can be as low as 12% in our study. Thus, besides being optimal for a triage test, no confident decision regarding reperfusion therapy or anticoagulation should be made based on these tests. Furthermore, CTPA availability is often delayed due to high demand in very busy EDs, absence of equipment in some hospitals (or out-of-hospital presentation) or hemodynamic instability. An empirical decision for anticoagulation or systemic thrombolysis is often necessary in all such cases.22,23 In a systematic review and meta-analysis, transthoracic echocardiography was demonstrated to have a specificity of 83% (95% CI, 74–90%) for the diagnosis of acute PE, making it potentially adequate as a rule-in test in patients unable to get confirmatory studies.24 However, considering the potential harm of antithrombotic therapy, a higher level of specificity would be desirable. In addition, several Portuguese hospitals do not have a 24-hour on-site attending cardiologist, which would enable the immediate performance of a comprehensive echocardiogram. Focused cardiac ultrasounds performed by emergency physicians have demonstrated good agreement for identifying right ventricular enlargement compared to those performed by a cardiologist (96%, k=0.86, 95% CI 0.82–0.90).25 However, less experienced operators may have a high level of uncertainty in indicating systemic thrombolysis.
Although several ECG abnormalities are commonly associated with PE, all of them are associated with low sensitivity and specificity.4,5 ECG scores combining several ECG criteria demonstrate better performance compared to single ECG criteria for the diagnosis of PE.4,5 The Daniel score comprises several ECG variables and demonstrated a specificity of 98% (95% CI 96–99%) but low sensitivity (24%; 95% CI 16–31%).4 In addition, ECG scores are time consuming, poorly validated and not routinely used in clinical practice.
Artificial intelligence has been applied in several healthcare applications in recent years. Considering the lack of specificity in clinical presentation and available non-imaging diagnostic tests, our focus in this study was to develop a deep learning model centered on high specificity for the diagnosis of acute PE based on a readily available 12-lead ECG. This is relevant considering that early identification of patients with acute PE is essential, particularly where confirmatory CTPA cannot be immediately performed. In these patients, early decision to initiate anticoagulation or systemic thrombolysis may be lifesaving.
In this study, we developed a deep learning model based only on ECG signals capable of detecting PE with high specificity, which is substantially higher compared to the commonly used clinical prediction scores combined with D-dimer measurement. Although the imaging tests, such as CTPA, are still the gold standard for the diagnosis of PE, a non-image-based easily available test with 100% specificity may support the decision for anticoagulation or systemic thrombolysis in patients with PE.
We demonstrated that the incidence of typical ECG features for PE (such as tachycardia, S1Q3T3, right bundle branch block and V1-V3 T wave inversion and ST depression) was similar between patients with and without PE. In our study, we found no difference in Daniels’ ECG score between patients with and without PE (median 2 (IQR 0–3) and median 2 (IQR 0–2), p=0.584). Thus, the deep learning model provides information beyond these findings and can improve PE prediction.
We found that embeddings from raw ECG data significantly contributed to model prediction and are acquired through multiple convolution operations over the raw data ECG values, representing nonobvious features. The most relevant characteristics of the signal are selected by the model using attention mechanisms, which provide information beyond what is contained in traditional ECG measurements. This led to an improvement compared to the human capacity for PE prediction based on ECG analysis. Although the deep learning model was associated with lower sensitivity compared to the alternative approaches, the primary purpose of its development was to promote a high specificity, as we considered that the greatest gain a new diagnostic tool for PE diagnosis is for patients with suspected PE who cannot immediately undergo a CTPA where a decision about empirical anticoagulation or fibrinolysis should be made. This is especially true in high risk cases. Thus, in the future we aimed to externally validate our model and to test its performance in patients with high risk PE suspicion in which CTPA was not performed before the fibrinolysis decision.
Strengths and limitationsOur study has major strengths. First, our model uses only ECGs as input and does not require additional clinical data, simplifying real world applicability. In addition, we did not exclude ECGs based on cardiac rhythm, meaning that our model is applicable regardless of cardiac conditions, including pacing rhythms, enhancing its generalizability. The retrospective study design and the relatively small sample limit the model's strength, a limitation that can be overcome with more data. In addition, it must be safeguarded that beyond being a promising diagnostic tool, this work represents our first results. Further application in larger cohorts and external validation of the deep learning model are essential to fully validate its performance. These will be conducted prior to pursuing implementation in clinical practice. Lastly, despite the potential usefulness of this technology in patients with hemodynamic instability or out-of-hospital cardiac arrest, our cohort did not focus on these patients, but rather on all patients with suspected PE admitted to an ED. As a result, it should be clear that the application of this tool for this subgroup is still exploratory and requires specific validation testing.
Future directions and implicationsWe aim to validate our results in an external sample from other centers in the future, as well as in high risk patient subgroups, for example, patients with hemodynamic instability. From a technical perspective, our model is simplistic enough to be easily integrated into existing information technologies structures and smartphones, either via existing apps or in standalone software. As a result, we expect deployment in clinical practice may occur within a relatively short time period.
ConclusionIn this study, we developed and validated a deep learning model with very high specificity for acute PE diagnosis. Our study provides evidence to support the real world application of AI in routine clinical practice, improving the management of patients with PE.
Conflicts of interestThe authors have no conflicts of interest to declare.
This work was partly supported by Center for Responsible AI - Application number: C645008882-00000055 and national funds through FCT - Fundação para a Ciência e Tecnologia, under project UIDB/50021/2020.
