Microvascular dysfunction is an often overlooked feature of hypertrophic cardiomyopathy (HCM). Our aim was to assess the association between microvascular dysfunction, wall thickness, tissue characteristics and myocardial deformation in HCM patients, by analyzing individual myocardial segments.
MethodsProspective assessment including cardiac magnetic resonance to assess wall thickness, T1 and T2 mapping, extracellular volume, late gadolinium enhancement (LGE) and stress perfusion. Results were stratified according to the 16 American Heart Association segments.
ResultsSeventy-five patients were recruited (1200 segments), 63% male, mean age 54.6±14.8 years, maximal wall thickness of 20.22±4.6 mm. Among the 424 segments (35%) with perfusion defects, 24% had defects only in the endocardial layer and 12% in both endocardial and epicardial layers. Perfusion defects were more often detected in hypertrophied segments (64%). Among the 660 segments with normal wall thickness, 19% presented perfusion defects. Independently of wall thickness, segments with perfusion defects had a higher T1 (β-estimate 30.28, p<0.001), extracelluar volume (β-estimate 1.50, p<0.001) and T2 (β-estimate 0.73, p<0.001) and had late gadolinium enhancement more frequently (odds ratio 4.16, p<0.001). Higher values of circumferential strain (lower deformation) and lower values of radial strain were found in segments with perfusion defects (β-estimate 2.76, p<0.001; and β-estimate -10.39, p<0.001, circumferential and radial strain, respectively).
ConclusionWhile microvascular dysfunction was more prevalent in more hypertrophied segments, it also had a major presence in segments without hypertrophy. In this segmental analysis, we found an association between the presence of ischemia and tissue abnormalities, replacement fibrosis as well as impaired strain, independently of the segmental wall thickness.
A disfunção microvascular é uma característica frequentemente subestimada da miocardiopatia hipertrófica (MCH). O objetivo do estudo foi avaliar a associação entre disfunção microvascular, espessura da parede (EP), características tecidulares e deformação miocárdica na MCH, analisando os segmentos miocárdicos individualmente.
MétodosEstudo prospetivo incluindo ressonância magnética cardíaca para avaliação de EP, T1 e T2 mapping, volume extracelular (VEC), realce tardio (RT) e estudo de perfusão, estratificados de acordo com os 16 segmentos da American Heart Association.
ResultadosForam recrutados 75 doentes (1.200 segmentos), 63% do sexo masculino, idade média 54,6±14,8 anos e EP máxima de 20,22±4,6 mm. Dentro dos 424 segmentos (35%) com defeitos de perfusão, 24% apresentaram defeitos apenas no endocárdio e 12% apresentaram defeitos tanto no endocárdio como no epicárdio. Os defeitos de perfusão foram detetados maioritariamente nos segmentos hipertrofiados (64%). Dentro dos 660 segmentos com EP normal, 19% apresentaram defeitos de perfusão. Independentemente da EP, os segmentos com defeitos de perfusão apresentaram maior elevação de T1 (β-estimate 30,28, p<0,001), VEC (β-estimate 1,50, p<0,001) e T2 (β-estimate 0,73, p<0,001) e RT com maior frequência (OR 4,16, p<0,001). Os segmentos com defeitos de perfusão apresentaram valores mais elevados de strain circunferencial (menor deformação) (β-estimate 2,76, p<0,001) e valores mais reduzidos de strain radial (β-estimate -10,39, p<0,001).
ConclusãoEmbora a disfunção microvascular tenha sido mais prevalente nos segmentos mais hipertrofiados, esta estava significativamente presente em segmentos sem hipertrofia. Nesta análise segmentar revelamos uma associação entre a presença de isquémia e características tecidulares, fibrose de substituição e strain anormal, independentemente da espessura da parede.
Unexplained left ventricular (LV) wall thickening defines hypertrophic cardiomyopathy (HCM)1 and myocardial fibrosis is a prevalent feature with prognostic relevance.2–6 Coronary microvascular dysfunction (CMD) and ischemia have also been identified as playing an important pathophysiological role, linked with replacement fibrosis and, consequently, progressive heart failure, ventricular arrhythmias and sudden cardiac death.7–11 Although ischemia is more pronounced in hypertrophied segments,12–14 it may be present in non-hypertrophied segments15 and may even occur before hypertrophy in mutation carriers.16
Cardiovascular magnetic resonance (CMR) parametric mapping techniques and the calculation of extracellular volume (ECV) enables more sensitive detection of interstitial fibrosis, with late gadolinium enhancement (LGE) correlating principally with replacement fibrosis.3,4,17–20 Abnormalities in native T1 mapping have also been attributed to intracellular abnormalities, such as altered calcium pathways and impaired energy homeostasis.21 Increased T2 values have been described in HCM, associated with signs of advanced disease, such as higher LV mass, lower ejection fraction and greater extent of LGE.22
Previous studies using CMR or positron emission tomography have described a correlation between the global burden of CMD and LV hypertrophy, extent of LGE and higher T1 mapping10,23–26 as well as a higher prevalence of clinical manifestations, incidence of atrial fibrillation (AF) and worse outcomes.27,28 A limited number of studies have performed a segmental analysis evaluating microvascular dysfunction and tissue characteristics, LV hypertrophy and LGE.24,25
Our aim was to perform a more comprehensive analysis, integrating myocardial deformation and its correlation, segment-by-segment, with wall thickness, ischemia and LGE. Due to the intra-individual heterogeneity of the LV in HCM, we hypothesized that by comparing individual LV segments instead of a global myocardial evaluation, a more in-depth correlation could be attained, and novel associations revealed.
MethodsStudy populationThis prospective study enrolled consecutive adult patients with HCM, seen in the dedicated cardiomyopathy clinics of Santa Marta Hospital (n=70) (Lisbon, Portugal) and Garcia de Orta Hospital (n=13) (Almada, Portugal). CMR studies were performed at the Heart Center, Hospital da Cruz Vermelha Portuguesa (Lisbon, Portugal). The diagnosis of HCM was established according to current guidelines.1,29 Obstructive HCM was defined according to a peak gradient of ≥30 mmHg in the left ventricular outflow tract (LVOT) at rest or after provocation, on echocardiographic assessment. Inclusion criteria, exclusion criteria and clinical evaluation including ECG and echocardiography occurred as previously published by Aguiar Rosa et al.23
The study followed the principles outlined in the Declaration of Helsinki. The institutional ethics committees approved the study protocol. All patients provided written informed consent.
Cardiac magnetic resonance protocol and analysisAll subjects underwent the same CMR protocol as previously described by Aguiar Rosa et al.23 In brief, CMR was performed on a 1.5-T magnetic resonance system (Sola, Siemens, Erlangen, Germany). Using compressed sensing-based techniques, cine images in three long-axis planes and sequential short axis slices were acquired. Pre-contrast short axis T1 maps were generated using a Modified Look Locker Inversion (MOLLI) sequence and pre-contrast short axis T2 maps were generated using a single shot balanced steady state free precession acquisition. Stress perfusion 90 seconds after hyperemia was induced by regadenoson (400 mcg bolus) using 0.05 mmol/kg of gadolinium (Gadovist, Bayer Schering Pharma AG, Berlin, Germany). LGE images were acquired 10-15 minutes after intravenous administration of additional 0.15 mmol/kg of gadolinium at end diastole, using a breath-held segmented inversion-recovery steady state free precession sequence after determining the optimal inversion time using a scout sequence.
CMR interpretation was performed using commercially available software (CMR42, Circle Cardiovascular Imaging, Calgary, Alberta, Canada). LV wall thickness, LV mass, end diastolic volume (EDV), end systolic volume (ESV) and LV ejection fraction (EF) were measured from short axis cine images excluding papillary muscles and trabeculations.
For perfusion assessment, the myocardium was divided into 32 subsegments (16 American Heart Association (AHA) segments subdivided into an endocardial and epicardial layer). Ischemic burden for each patient was calculated as the number of involved sub-segments, assigning 3% of myocardium to each subsegment. Each segment was analyzed for the presence or absence of perfusion defects. Perfusion defects sparing the subendocardium and coincident with LGE were not considered, as subendocardial involvement is mandatory for microvascular dysfunction defects. The LGE was analyzed per-segment basis using a signal threshold versus reference myocardium of ≥6 standard deviation.
Three-dimensional longitudinal, circumferential and radial strains were obtained by manually drawing epicardial and endocardial contours on the end diastolic frame of short axis and long-axis images (four-chamber, two-chamber and three-chamber views), using an automatic feature tracking algorithm from cine images.
For each patient, each of the 16 AHA segments was assessed for LV thickness (≤11 mm; 12-14 mm; ≥15 mm), presence of perfusion defect, T1 mapping, T2 mapping, ECV, presence of LGE, longitudinal strain, radial strain and circumferential strain.
Statistical analysisStatistical analysis was performed using the Statistical Package for the Social Sciences, V.23.0 for Windows (SPSS). Point estimates and 95% confidence interval (CI) are described for all mean estimates.
Descriptive statistics are presented as absolute frequency (number) and relative frequency (percentage) for categorical variables and as the mean for continuous variables.
The Kolmogorov-Smirnov test was used to test normality assumptions.
A segment-by-segment analysis was performed to assess the correlation between ischemia, LV hypertrophy, tissue characteristics and myocardial deformation parameters, calculated with univariable logistic and linear regressions. Subsequently multivariable analyses, adjusted for potential confounders, were performed. Whenever statistical hypothesis testing was used, a significance level of α=5% was considered.
ResultsSeventy-five patients were enrolled. The general baseline characteristics have been described previously.23 In summary, 47 (63%) were male, mean age was 54.6±14.8 years; 48 (64%) had asymmetric septal hypertrophy and 22 (29%) had apical hypertrophy. The maximal LV wall thickness was 20.2±4.6 mm.
A total of 1200 segments were analyzed. Stress perfusion and mapping images were interpretable in all segments. LGE images were not interpretable in 16 segments from one patient, due to artifacts. The characteristics of each of the 16 AHA segments are presented in Table 1.
Characteristics of each American Heart Association (AHA) segment.
| AHA segments* | ||||||||||||||||
|---|---|---|---|---|---|---|---|---|---|---|---|---|---|---|---|---|
| Segments | 1 | 2 | 3 | 4 | 5 | 6 | 7 | 8 | 9 | 10 | 11 | 12 | 13 | 14 | 15 | 16 |
| Wall thickness (mm) | 13.4±5.2 | 16.3±4.4 | 14.7±5.4 | 10.6±4.2 | 9.4±2.6 | 10.6±3.5 | 11.6±5.6 | 13.9±5.6 | 14.6±5.1 | 11.9±4.9 | 10.3±3.9 | 10.9±4.2 | 11.9±5.7 | 11.8±5.4 | 11.2±4.8 | 11.9±5.6 |
| Presence of perfusion defect, n (%) | 16 (21.3) | 23 (30.7) | 26 (34.7) | 15 (20) | 9 (12) | 6 (8) | 24 (32) | 32 (42.7) | 33 (44) | 44 (58.7) | 26 (34.7) | 17 (22.7) | 28 (37.4) | 44 (58.7) | 48 (64) | 33 (44) |
| T1 mapping (ms) | 1011±45.3 | 1036±44.6 | 1045±50.2 | 1046.5±44.9 | 1029.1±54.2 | 999±47.3 | 1007.8±49.5 | 1030.5±43.2 | 1044.9±41.8 | 1033.3±41.4 | 1020.7±42.2 | 995.4±50.1 | 1002.5±55.2 | 1033.4±48.5 | 1031.2±43 | 1018.3±62.9 |
| T2 mapping (ms) | 50.36±2.89 | 49.62±3.07 | 49.47±3.1 | 50.51±3.24 | 49.58±3.89 | 50.07±2.88 | 51.32±3.45 | 50.84±4.0 | 50.4±2.93 | 49.95±2.71 | 49.81±2.82 | 50.4±3.0 | 52.11±4.31 | 51.71±4.1 | 50.9±3.42 | 51.35±3.82 |
| Presence of LGE, n (%) | 35 (47.3) | 51 (68.9) | 43 (58.1) | 24 (32.4) | 25 (33.8) | 28 (37.8) | 35 (47.3) | 50 (67.6) | 50 (67.6) | 32 (43.2) | 27 (36.5) | 33 (44.6) | 44 (59.5) | 51 (68.9) | 42 (56.8) | 40 (54.1) |
| Extracellular volume (%) | 25.9±5 | 27.6±5.2 | 26.8±5.5 | 26.8±4.2 | 25.5±4.5 | 24.6±4 | 27.1±4.9 | 27.8±5.1 | 27.6±4.9 | 26.4±4.2 | 25.3±4.3 | 25.4±4.1 | 27.8±4.7 | 28.1±5.9 | 27.6±6.5 | 27.3±6.8 |
| LongitudinalStrain (%) | -1.79±9.28 | -3.77±6.43 | -2.05±7.39 | -1.45±9.31 | 3.27±12.67 | 4.09±11.3 | -5.64±8.33 | -4.98±8.2 | -4.66±7.34 | -2.68±9.01 | 0.06±15.01 | -2.71±13.22 | -10.42±5.95 | -8.6±5.17 | -11.36±5.29 | -12.86±4.64 |
| Circumferential strain (%) | -18.41±6.07 | -14.71±5.37 | -12.66±5.54 | -14.16±5.97 | -17.8±6.59 | -20.55±4.9 | -18.98±6.32 | -18.88±5.14 | -15.71±5.15 | -13.61±5.19 | -18.05±6.73 | -18.0±7.28 | -18.16±7.04 | -19.43±5.82 | -17.28±6.2 | -19.55±6.7 |
| Radial strain (%) | 23.55±16.93 | 18.02±13.64 | 23.98±14.96 | 31.78±15.55 | 42.14±24.07 | 41.97±44.47 | 27.0±17.48 | 22.35±12.1 | 19.45±12.7 | 24.33±12.57 | 33.35±19.08 | 29.01±18.74 | 27.32±21.84 | 27.53±21.31 | 21.27±16.32 | 23.35±20.35 |
HCM: hypertrophic cardiomyopathy; LGE: late gadolinium enhancement.
Six hundred and sixty (55%) segments had wall thickness of ≤11 mm, 210 (17.5%) segments 12-14 mm, and 330 (27.5%) segments ≥15 mm. Wall thickness was greater in the basal and mid septum (AHA segments 2, 3, 8 and 9) (Table 1).
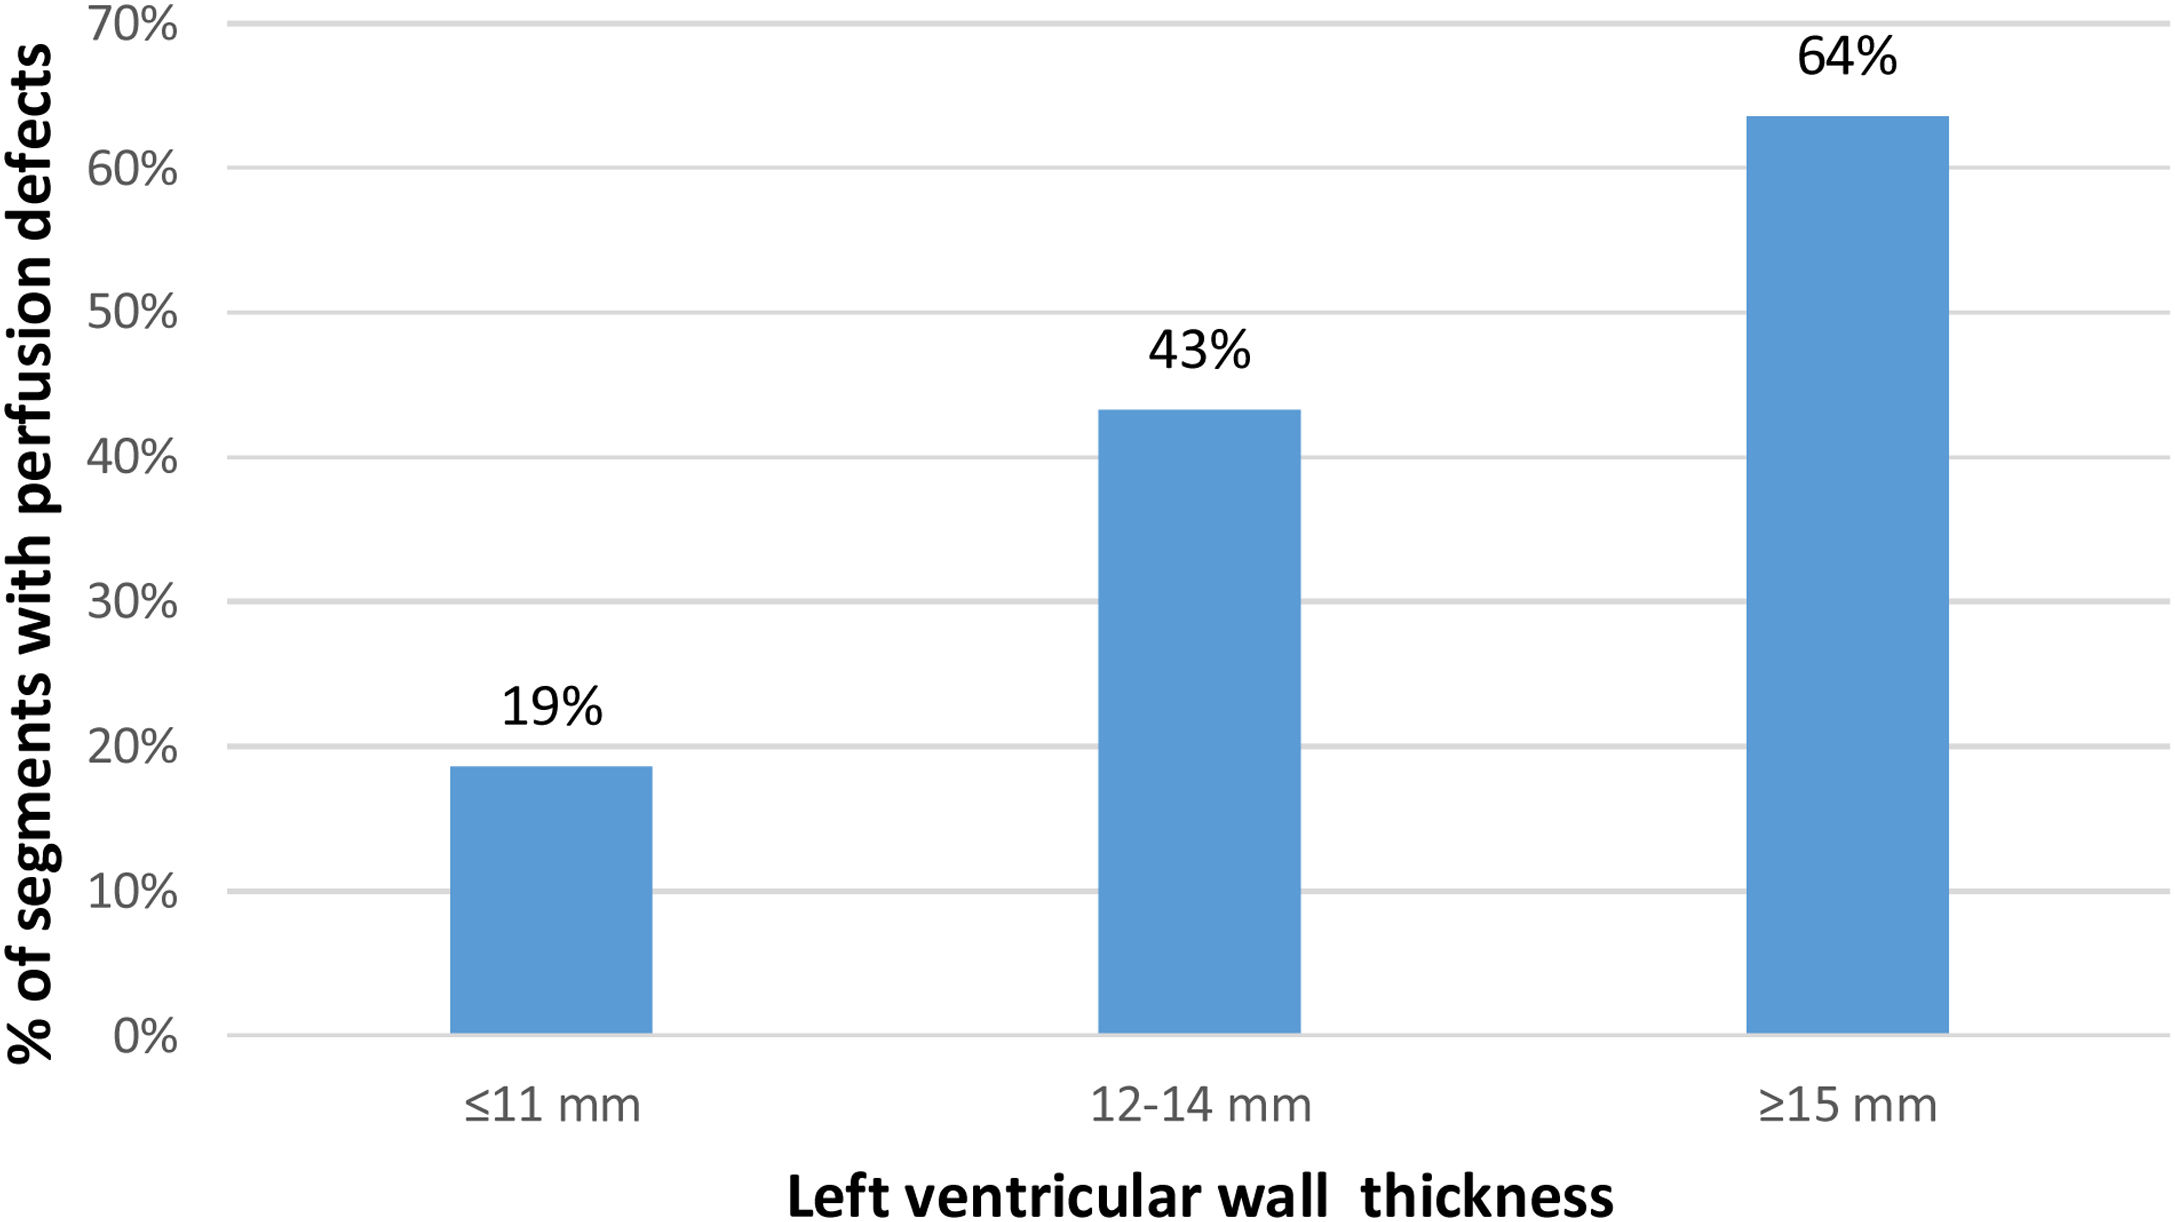
Among the 424 segments (35.3%) with a perfusion defect, 286 (23.8%) only had a defect in the endocardial layer and 138 (11.5%) in both endocardial and epicardial layers. Perfusion defects were present in 19% of non-hypertrophied segments and were more often detected in hypertrophied segments: in 43.3% of the segments with 12-14 mm and in 63.6% of the segments with ≥15 mm (Figure 1).
 according to intervals of maximal wall thickness.")
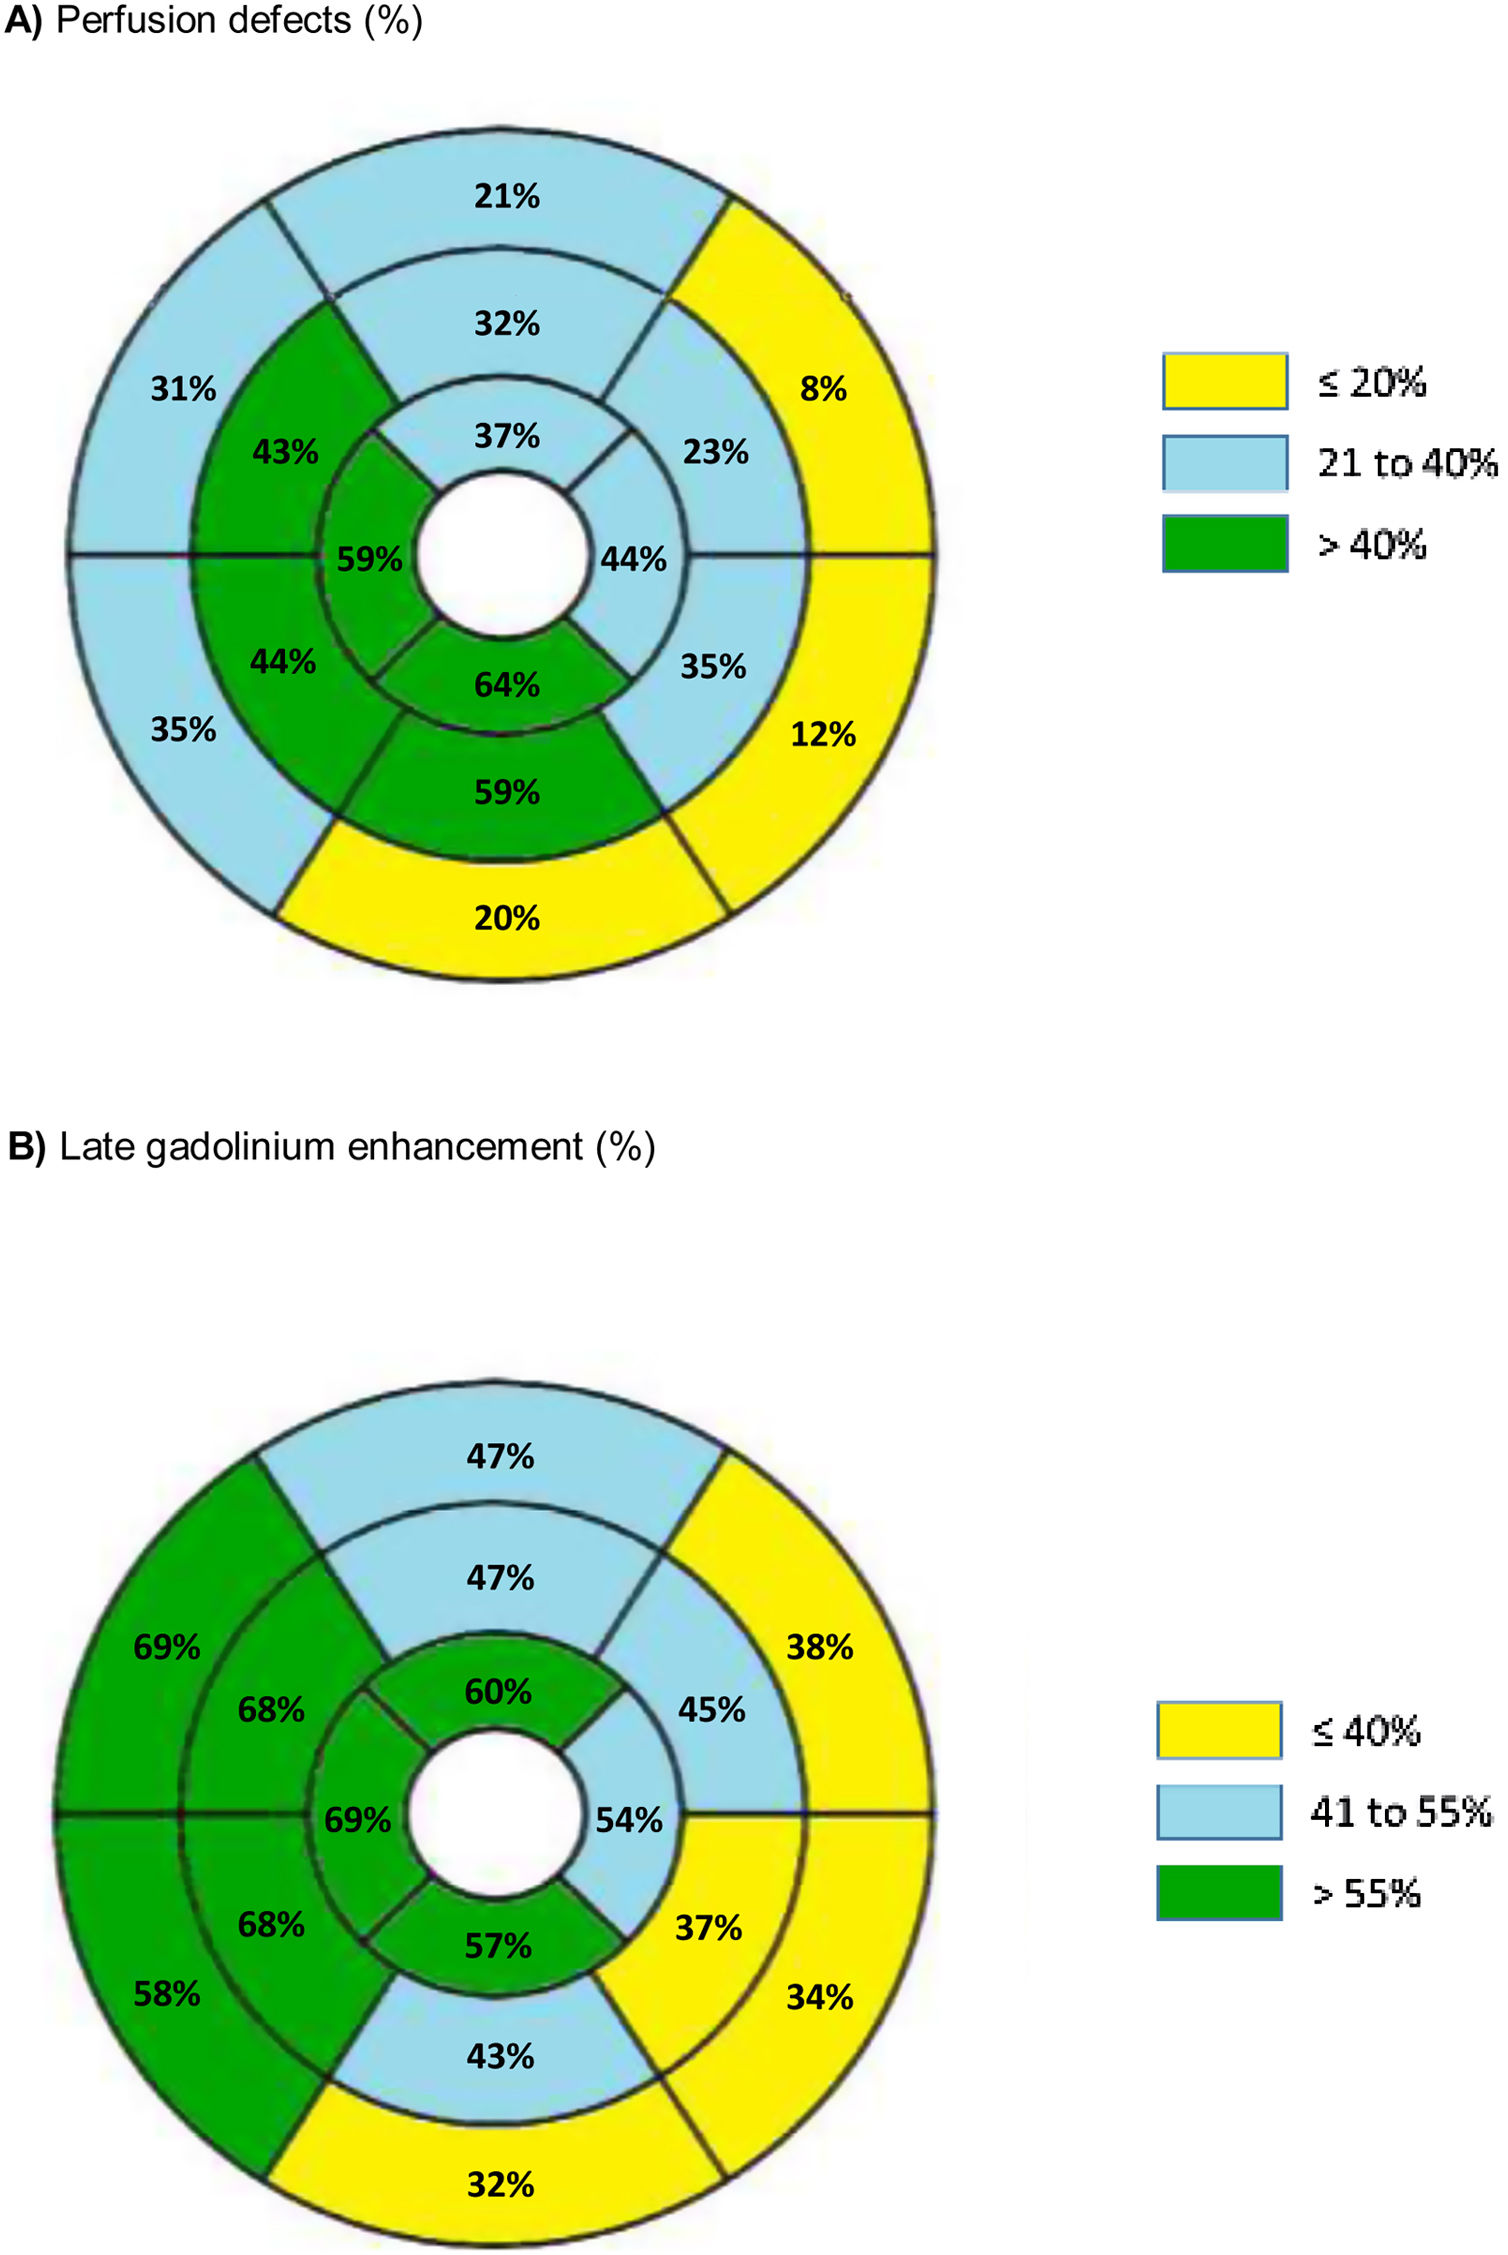
The distribution and prevalence of perfusion defects and LGE in each of the 16 AHA segments is displayed in Figure 2.
 and late gadolinium enhancement (B) frequency in individual cardiac magnetic resonance segments A) Perfusion defects (%).")
The results of univariable regression analysis for potential factors associated with T1 mapping, T2 mapping, LGE and ECV are presented in Supplementary Table 1. Subsequently, a multivariable regression analysis, adjusted for potential confounders, was performed (Table 2).
Multivariable logistic and linear regression analyses for tissue characteristics.
| Native T1 mapping | |||
|---|---|---|---|
| Model | β-estimate | 95% CI | p-value |
| Thickness 12-14 mm | 16.69 | 9.29 to 24.08 | <0.001 |
| Thickness≥15 mm | 38.09 | 31.58 to 44.60 | <0.001 |
| Perfusion defect | 30.28 | 24.60 to 35.96 | <0.001 |
| LGE | 32.04 | 26.61 to 37.47 | <0.001 |
| Diabetes | 11.37 | 2.91 to 19.83 | 0.009 |
| BMI>25 kg/m2 | 11.37 | 3.74 to 18.98 | 0.004 |
| Male gender | -15.52 | -22.03 to -9.01 | <0.001 |
| Extracellular volume | |||
|---|---|---|---|
| Model | β-estimate | 95% CI | p-value |
| Thickness≥15 mm | 2.40 | 1.60 to 3.10 | <0.001 |
| Perfusion defect | 1.50 | 0.81 to 2.11 | <0.001 |
| LGE | 2.92 | 2.32 to 3.50 | <0.001 |
| Diabetes mellitus | 2.90 | 1.90 to 3.81 | <0.001 |
| Hypertension | 1.50 | 0.70 to 2.20 | <0.001 |
| T2 mapping | |||
|---|---|---|---|
| Model | β-estimate | 95% CI | p-value |
| Perfusion defect | 0.73 | 0.32 to 1.14 | <0.001 |
| LGE | 1.06 | 0.67 to 1.45 | <0.001 |
| Obstructive HCM | 1.17 | 0.73 to 1.61 | <0.001 |
| BMI>25 kg/m2 | 0.001 | ||
| Male gender | -0.50 | -0.95 to -0.05 | 0.030 |
| Late gadolinium enhancement | |||
|---|---|---|---|
| Model | OR estimate | 95% CI | p-value |
| Thickness 12-14 mm | 2.66 | 1.92 to 3.68 | <0.001 |
| Thickness≥15 mm | 9.02 | 6.42 to 12.67 | <0.001 |
| Perfusion defect | 4.16 | 3.19 to 5.41 | <0.001 |
| Obstructive HCM | 2.08 | 1.43 to 2.48 | <0.001 |
| Diabetes | 1.82 | 1.26 to 2.63 | 0.001 |
| BMI>25 kg/m2 | 2.10 | 1.52 to 2.90 | <0.001 |
| Hypertension | 1.65 | 1.23 to 2.16 | <0.001 |
Reference categories: Wall thickness≤11 mm, non-obstructive HCM, absence of perfusion defect. p-values were obtained using a mixed effects regression models.
CI: confidence interval; HCM: hypertrophic cardiomyopathy, LGE: late gadolinium enhancement; OR: odds ratio.
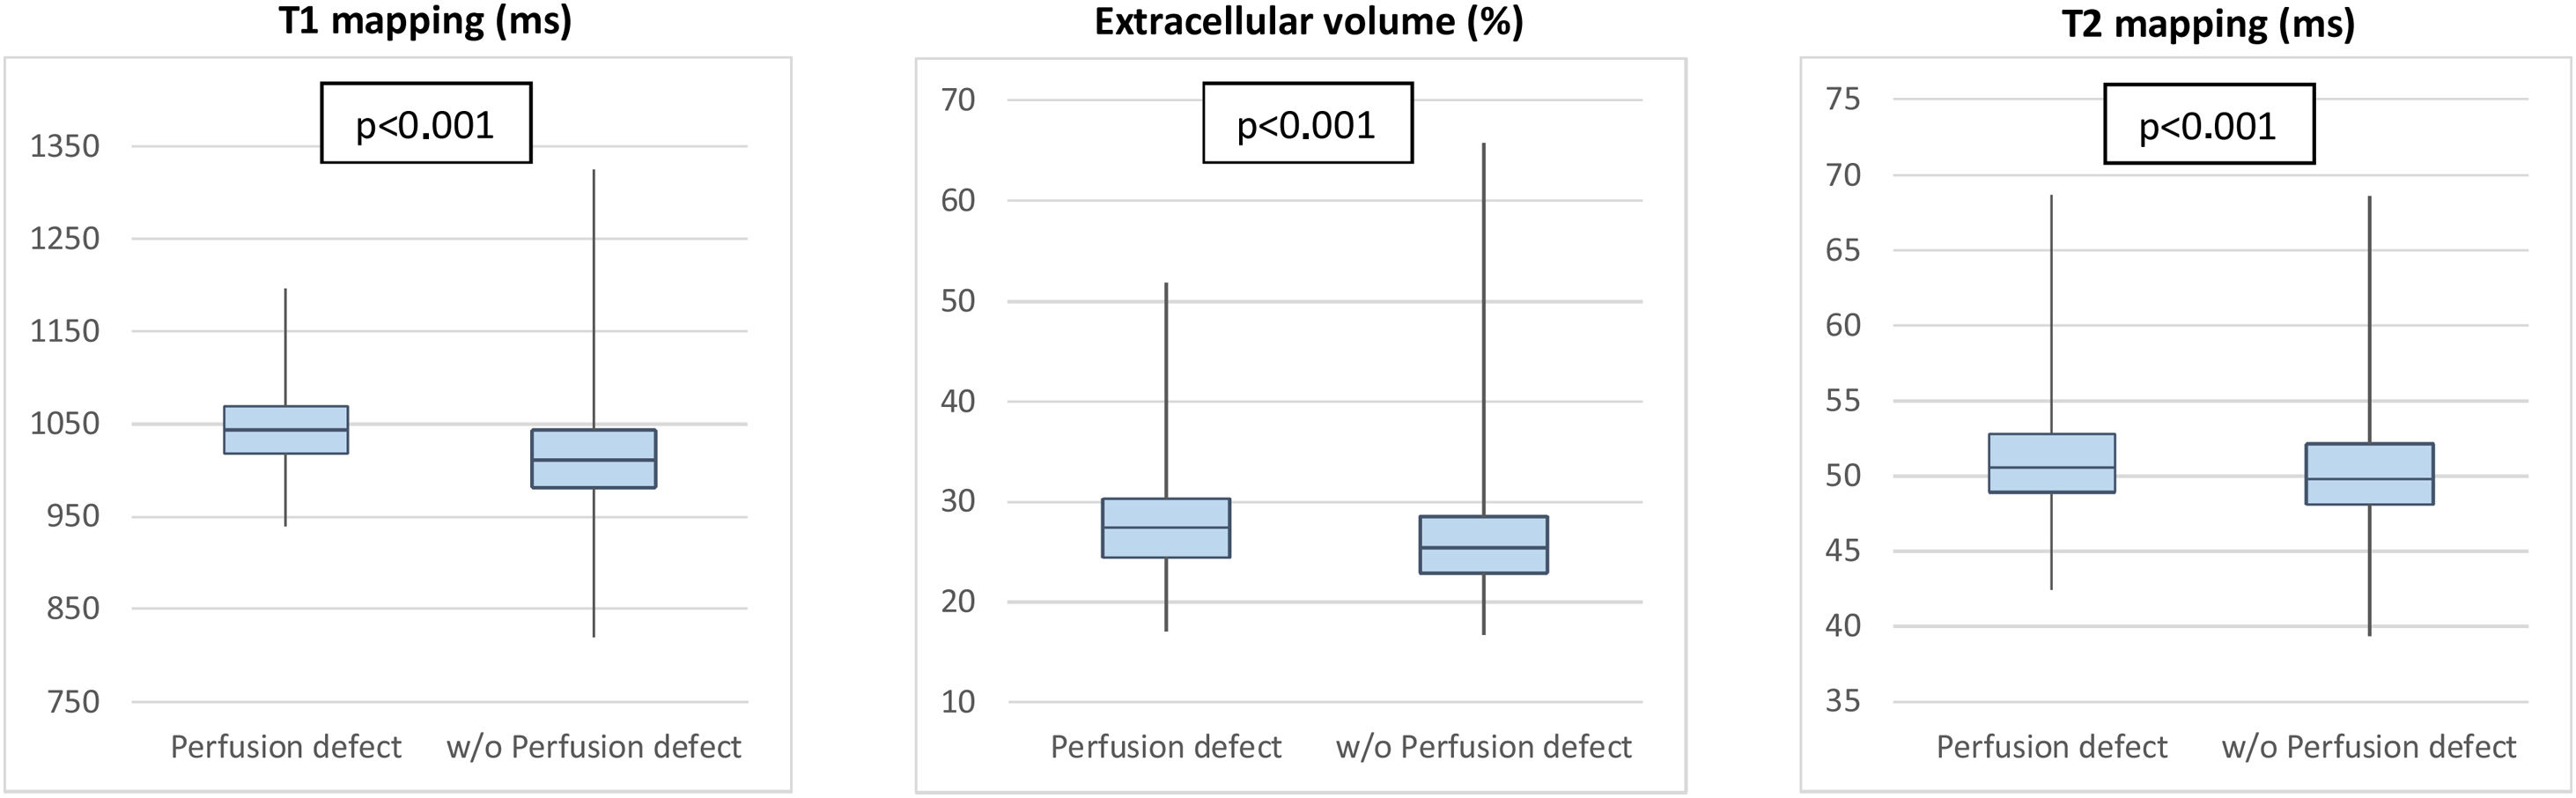
Perfusion defects were associated with changes in tissue characteristics, independently of LV wall thickness (Figure 3). Segments with perfusion defect had a higher native T1 than those without (β-estimate 30.28, 95% CI 24.60-35.96, p<0.001), as well as a significantly higher ECV (β-estimate 1.50, 95% CI 0.81-2.11, p<0.001). T2 values were also higher in segments with perfusion defect (β-estimate 0.73, 95% CI 0.32-1.14, p<0.001) (Table 2 and Figure 3).
 features, according to the presence or absence of perfusion defects.")
Furthermore, regardless of the wall thickness, segments with a perfusion defect more frequently had LGE (OR 4.16, 95% CI 3.19-5.41, p<0.001) (Figure 2). Among the 424 segments with perfusion defect, 115 segments (27.1%) did not present LGE.
Besides perfusion defects, wall thickness and obstructive HCM were features associated with tissue abnormalities (Table 2).
Left ventricular myocardial deformationUnivariable regression analyses for longitudinal strain, radial strain and circumferential strain are shown in Supplementary Table 2 and the multivariable analyses are described below.
Higher values of longitudinal strain (reflecting lower deformation) were found in segments with wall thickness ≥15 mm (β-estimate 2.28, 95% CI 0.87-3.69, p=0.002) compared with non-hypertrophied segments (Table 3). No association was found between perfusion defects and longitudinal strain in this segmental analysis. Higher values of circumferential strain (lower deformation) were found in segments with wall thickness 12-14 mm (β-estimate 2.31, 95% CI 1.35-3.26, p<0.001), wall thickness ≥15 mm (β-estimate 5.14, 95% CI 4.32-5.97, p<0.001) versus segments with normal wall thickness, in segments with perfusion defect (β-estimate 2.76, 95% CI 2.01-3.50, p<0.001) and in segments with LGE (β-estimate 2.30, 95% CI 1.57-3.02, p<0.001). Lower radial strain values (reflecting lower myocardial deformation) were found in segments with wall thickness 12-14 mm (β-estimate -9.90, 95% CI -13.19–-6.59, p<0.001) and wall thickness ≥15 mm (β-estimate -19.78, 95% CI -22.48–-17.09, p<0.001) in contrast to non-hypertrophied segments, segments with perfusion defect (β-estimate -10.39, 95% CI -12.83–-7.95, p<0.001) and with LGE (β-estimate -9.84, 95% CI -12.19–-7.48, p<0.001) (Table 3).
Multivariable linear regression analysis for left ventricular myocardial deformation parameters.
| Longitudinal strain | |||
|---|---|---|---|
| Model | β-estimate | 95% CI | p-value |
| Thickness≥15 mm | 2.28 | 0.87 to 3.69 | 0.002 |
| Obstructive HCM | 2.62 | 1.32 to 3.92 | <0.001 |
| BMI>25 kg/m2 | 3.14 | 1.56 to 4.72 | <0.001 |
| Circumferential strain | |||
|---|---|---|---|
| Model | β-estimate | 95% CI | p-value |
| Thickness 12-4 mm | 2.31 | 1.35 to 3.26 | <0.001 |
| Thickness≥15 mm | 5.14 | 4.32 to 5.97 | <0.001 |
| Perfusion defect | 2.76 | 2.01 to 3.50 | <0.001 |
| LGE | 2.30 | 1.57 to 3.02 | <0.001 |
| Obstructive HCM | 1.56 | 0.75 to 2.37 | <0.001 |
| Diabetes | 2.43 | 1.37 to 3.50 | <0.001 |
| Male gender | 1.72 | 0.89 to 2.55 | <0.001 |
| Radial strain | |||
|---|---|---|---|
| Model | β-estimate | 95% CI | p-value |
| Thickness 12-14mm | -9.90 | -13.19 to -6.59 | <0.001 |
| Thickness≥15 mm | -19.78 | -22.48 to -17.09 | <0.001 |
| Perfusion defect | -10.39 | -12.83 to -7.95 | <0.001 |
| LGE | -9.84 | -12.19 to -7.48 | <0.001 |
| Obstructive HCM | -4.84 | -7.51 to -2.16 | <0.001 |
| Diabetes | -6.54 | -10.07 to -3.00 | 0.027 |
| BMI>25 kg/m2 | -4.73 | -7.94 to -1.52 | 0.004 |
| Hypertension | -7.06 | -9.82 to -4.29 | <0.001 |
| Male gender | -6.82 | -9.55 to -4.09 | <0.001 |
Reference categories: wall thickness≤11 mm, non-obstructive HCM, absence of perfusion defect, female gender, BMI≤25 kg/m2. p-values were obtained by mixed effects regression models. BMI: body mass index; CI: confidence interval; LGE: late gadolinium enhancement; HCM: hypertrophic cardiomyopathy.
No association was found between T1 and T2 mapping values, ECV and tissue tracking analysis.
DiscussionIn patients with HCM, we performed segmental analysis and found an independent association between segmental ischemia and abnormal tissue characteristics. This association was noted between ischemia and tissue abnormalities studied using native T1, ECV and T2 mapping, as well as replacement fibrosis studied using LGE. In this segmental analysis, CMD was further related to impaired circumferential strain and radial strain. Importantly, some of these associations were uncovered by the current segmental analysis but were not present in our previous global assessment of ischemia burden,23 which might be explained by the inherent intra-individual phenotypic heterogeneity of LV segments in HCM.
To better appreciate the intrinsic characteristics of HCM even in segments without overt LV hypertrophy, we aimed to examine segments with normal wall thickness and segments with mild hypertrophy for the presence of ischemia and tissue abnormalities.
As expected, hypertrophied segments had more severe microvascular dysfunction, with segments ≥15 mm demonstrating a higher prevalence of perfusion defects. However, microvascular dysfunction is only partly explained by hypertrophy, since it was also found in 19% of non-hypertrophied segments, reflecting the existence of intrinsic structural and functional abnormalities of the small vessels.7–9 This is a similar finding to previously published works.10,25,30
Notably, almost half of segments with mild hypertrophy had microvascular dysfunction. These findings confirm that segments with normal wall thickness and segments with mild hypertrophy are also important contributors to the overall burden of ischemia in HCM.
Among the segments with perfusion defects, the subendocardium in isolation was involved in two-thirds. This is in keeping with previous results, including a multimodality study using invasive LV pressure measurements and noninvasive imaging with echocardiography, CMR and PET. This study demonstrated that the autoregulatory mechanisms of the microvasculature are insufficient during vasodilatory stress, leading to subendocardial ischemia, while the subepicardium was relatively spared.31
Impact of ischemia in tissue abnormalitiesAs a hallmark of the disease, severity of wall thickness was expectedly associated with tissue abnormalities. However, segments with only mild hypertrophy also showed the presence of increased T1 mapping and of LGE, displaying tissue abnormalities even in the absence of overt LV hypertrophy.
Regardless of the severity of hypertrophy, CMD was consistently related to tissue abnormalities in this study. Segments with perfusion defects were linked to both increased ECV and LGE, indicating the presence of both diffuse tissue abnormalities and replacement fibrosis.17,18 Hypertrophied myocytes are arranged in disarray, with increased extracellular matrix accumulation. While reduced ECV can be seen in cellular hypertrophy32 and in healthy athletes,33 ECV has been demonstrated to be increased in HCM in the context of focal or diffuse fibrosis,34 albeit with considerable heterogeneity among HCM patients.32 Moreover, while LGE may not accurately reveal the presence of abnormal tissue in the setting of less severe or more diffuse fibrosis, ECV has shown to be a surrogate for the presence of fibrosis in a significantly higher percentage of cardiac segments compared to LGE.35
Histologically, the severity of the abnormalities in intramural small vessels was previously found to be co-localized with fibrotic scars.17,18 By CMR stress perfusion, higher ischemic burden and lower stress myocardial blood flow were found to be linked to the presence of LGE.25,36 This suggests that replacement fibrosis may be partially secondary to microvascular dysfunction and ischemia.30,37,38 However, while LGE burden is a recognized prognostic factor particularly in advanced stages, it is tempting to speculate that ECV may detect earlier pathophysiological changes in HCM. Similarly, CMD is a pathological feature that seems to have an impact from an early stage of the disease, and thus may be a useful marker of disease progression and prognosis.13,39
Native T1 mapping reflects diffuse abnormalities in both the intracellular and extracellular spaces.40 In HCM, native T1 may be affected by the intracellular compartment where altered calcium cycling and sarcomeric calcium sensitivity, disturbed biomechanical stress sensing and impaired cardiac energy homeostasis have been detected.41 In our cohort, higher native T1 levels correlated with myocardial ischemia. This finding suggests that CMD may be associated not only with increased diffuse fibrosis but also with intracellular compartment abnormalities.
T2-weighted imaging, a tissue characterization technique mainly used to identify edema, can be elevated in HCM,42 both in hypertrophied and non-hypertrophied segments, despite normal wall thickness and preserved contractile function, which suggests that tissue abnormalities may precede morphological and functional remodeling in HCM.43 Furthermore, higher T2 values were previously correlated with higher brain natriuretic peptide levels, higher LGE extension and nonsustained ventricular tachycardia and have, therefore, been suggested as a possible marker for arrhythmogenicity.44 In our cohort, segments with higher T2 values were associated with greater LGE extent as well as with ischemia. To our knowledge, this is the first evidence of correlation between higher T2 and ischemia.
Impact of microvascular dysfunction on myocardial deformationSpeckle tracking parameters for systolic function are often impaired in HCM, such as longitudinal, circumferential and radial strain. Changes in these parameters vary widely between segments, reflecting the asymmetric nature of the disease. They are more prominent in segments with significant hypertrophy and fibrosis.45–47 In line with previous data,48 and using a per-segment analysis, we found a relationship between wall thickness and LGE and impaired LV myocardial deformation parameters.
Furthermore, hypoperfused segments showed worse circumferential and radial strain, independently of wall thickness or fibrosis, which is a novel - although probably expected - finding.
As LV performance is determined by several factors other than ischemia, such as wall thickness and extent of replacement fibrosis, with considerable heterogeneity among patients and within the left ventricle,46 in this study we did not find a correlation between impaired longitudinal strain and perfusion defects.
LimitationsOne limitation of our study is the relatively small population. Six patients were in AF during the scan, which may have influenced parametric mapping values. CMR assessment of tissue characteristics was not validated with histological samples. Perfusion defects, a surrogate for myocardial ischemia, were assessed using a semiquantitative visual analysis of ischemia in 32 segments, as used in previous studies comparing stress CMR with invasive evaluation of fractional flow reserve.14 While the adopted method is readily available and easily applicable, it relies on visual assessment and the total of LV assessed is 96% (3% for each segment).
ConclusionWhile perfusion defects were more prevalent in more hypertrophied segments, segments with normal wall thickness and mild hypertrophy accounted significantly for the overall burden of ischemia in HCM. The presence of microvascular dysfunction was associated with diffuse tissue abnormalities and replacement fibrosis. Segments with perfusion defect presented worse LV myocardial deformation assessed using radial and circumferential strain. Our findings suggest that CMD is an important early pathophysiological feature, impacting on tissue abnormalities (including T1, ECV and T2 mapping) and LV performance on a per-segment basis, regardless of the severity of the hypertrophy, with significant intra-individual heterogeneity among LV segments. These findings highlight that symptoms in HCM may be attributable to CMD, which can be impactful even in patients with no significant hypertrophy.
These abnormalities merit further study and suggest that ischemia might be a useful and early imaging biomarker, which could potentially be used to help develop therapies that may change the progression of the disease and outcomes.
Conflicts of interestThe authors have no conflicts of interest to declare.
