The prognostic value of myocardium deformation measurements in chronic heart failure (CHF) is still poorly addressed. The purpose of this study was to evaluate the correlation of left ventricular (LV) global longitudinal strain (GLS) with clinical and prognostic indicators in patients with CHF and systolic dysfunction.
MethodsAmbulatory patients with CHF and LV ejection fraction (LVEF) <45% were studied by two-dimensional and Doppler transthoracic echocardiogram with assessment of GLS. An indication of prognostic status was obtained by the Seattle Heart Failure Model (SHFM) prognostic estimates for life expectancy.
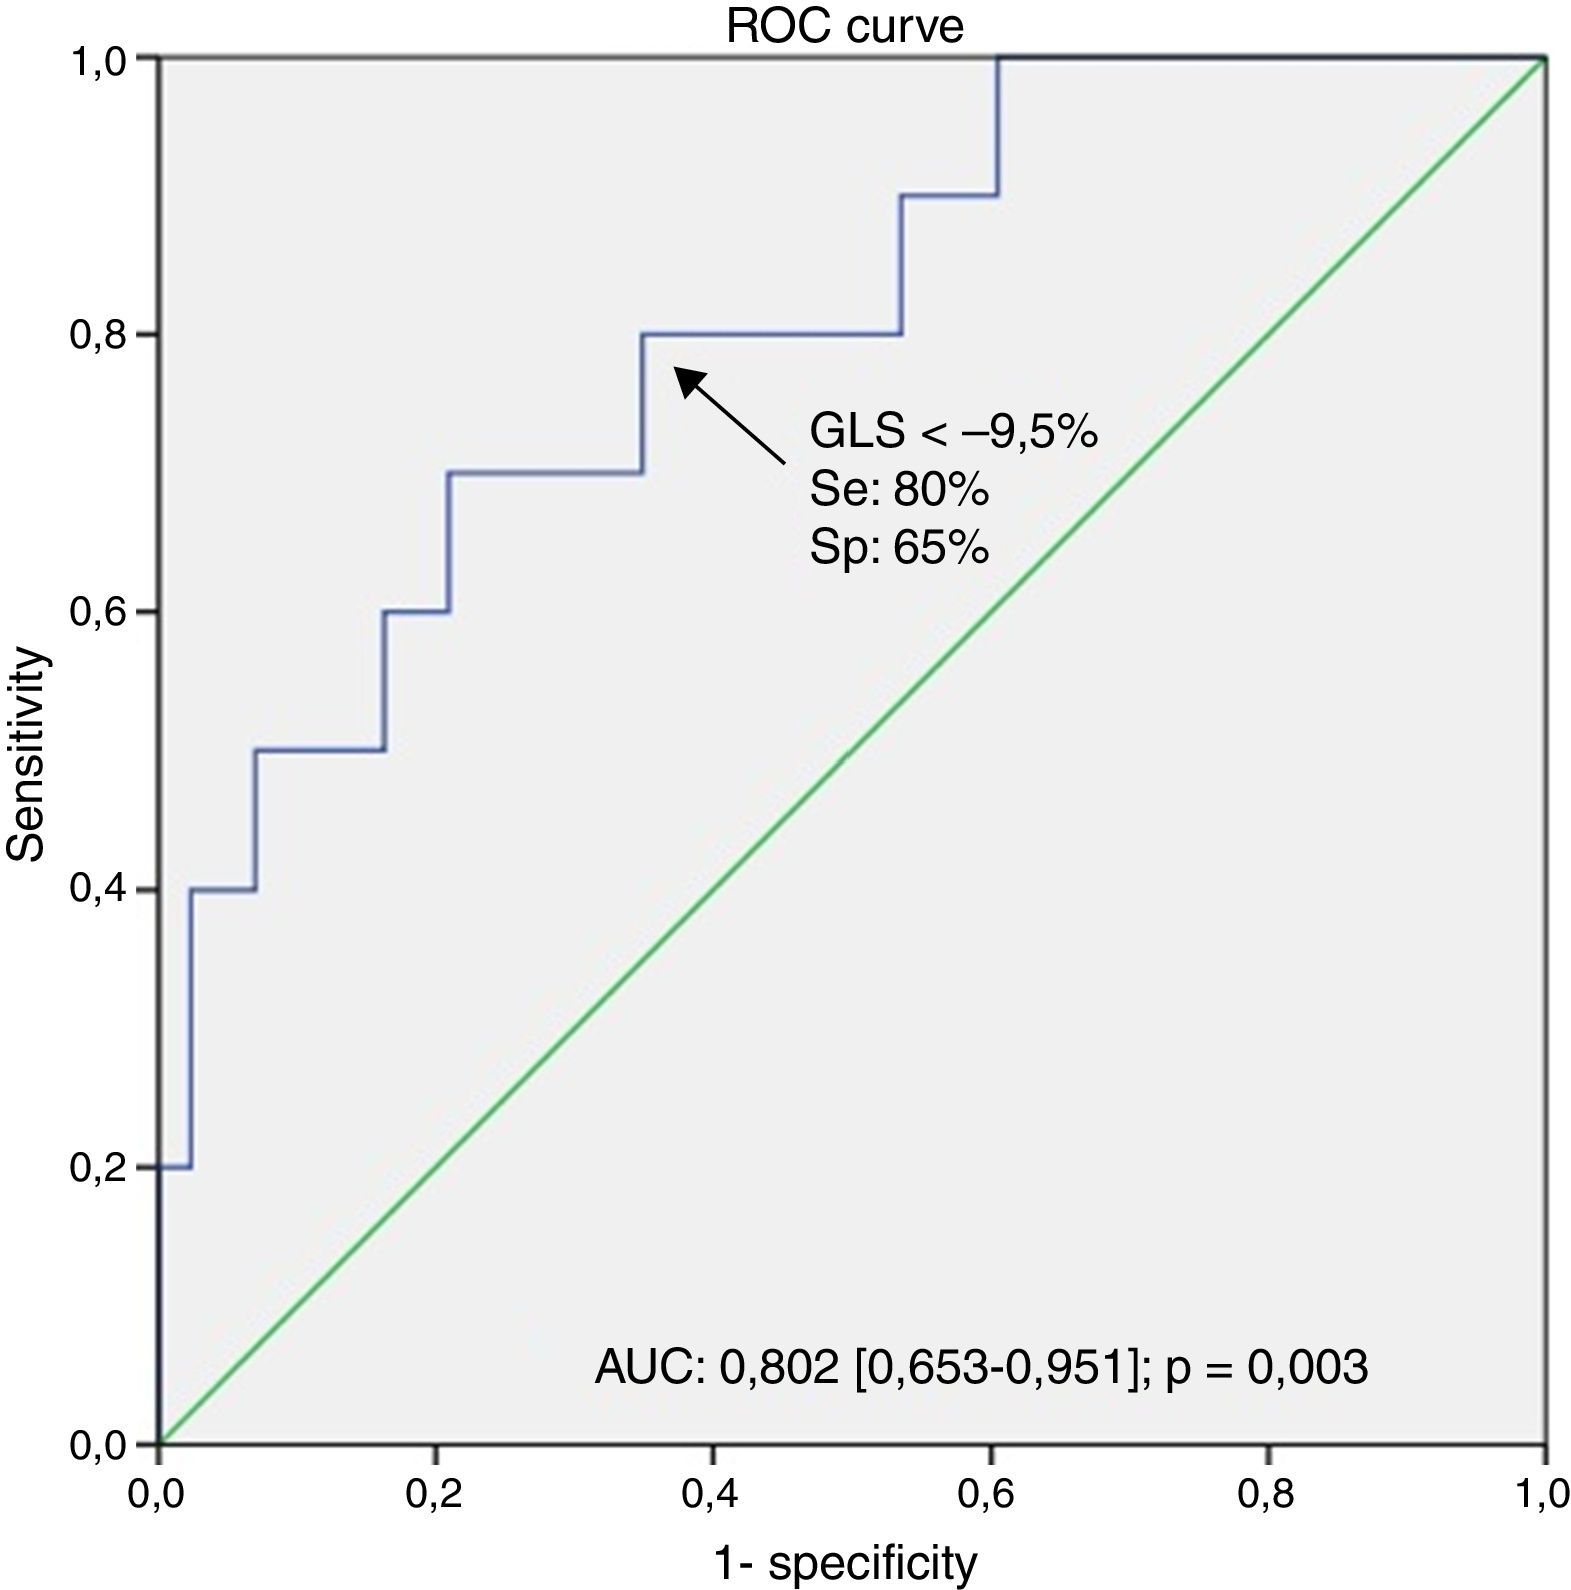
ResultsWe included 54 CHF patients (mean age 55±12 years; 80% male). GLS was significantly correlated with NYHA functional class (r=0.41, p=0.002), BNP levels (r=0.47, p=0.001), LVEF (r=−0.69, p<0.001) and LV end-diastolic pressure, assessed by E/e’ ratio (r=0.35, p<0.014) and left atrial maximal volume index (r=0.57, p<0.001). A significant correlation was found between GLS and SHFM prognostic estimates for life expectancy (r=−0.41, p=0.002). The multivariate logistic regression analysis showed that GLS independently predicted an estimated life expectancy <10 years (OR 2.614 [95% CI 1.010–6.763]). The corresponding area under the ROC curve was 0.802 (0.653–0.951) and the best obtained threshold was −9.5 (80% sensitivity, 65% specificity, p=0.003).
ConclusionsGLS was strongly associated with a higher disease severity status and predicted a lower prognostic estimate for life expectancy.
O valor prognóstico das medidas de deformação miocárdica na insuficiência cardíaca crónica (ICC) ainda não está bem estabelecido. Este estudo teve por objetivo avaliar a correlação do strain longitudinal global (SLG) do ventrículo esquerdo (VE) com indicadores clínicos e prognósticos em doentes com ICC e disfunção sistólica.
MétodosDoentes ambulatoriais, com ICC e fração de ejeção do VE (FEVE) <45% realizaram ecocardiografia transtorácica bidimensional com Doppler, com avaliação de SLG. O indicador de status prognóstico foi baseado na expectativa de vida estimada pelo modelo Seattle Heart Failure Model (SHFM).
ResultadosIncluímos 54 doentes com ICC (idade média de 55±12 anos, 80% do sexo masculino). O SLG correlacionou-se significativamente com a classe funcional (r=0,41, p=0,002), níveis de BNP (r=0,47, p=0,001), FEVE (r=−0,69, p<0,001), pressão telediastólica do VE, avaliada pela razão E/e′ (r=0,35, p=0,014) e pelo volume máximo da aurícula esquerda (r=0,57, p<0,001). Observou-se uma correlação significativa entre o SLG e a expectativa de vida estimada pelo modelo SHFM (r=−0,41, p=0,002). Perante a análise de regressão logística multivariada, o SLG mostrou ser um preditor independente de uma esperança de vida estimada <10 anos (OR 2,61 [IC 95% 1,01–6,76]). A área sob a curva ROC foi de 0,80 (0,65–0,95) e o melhor ponto de corte obtido foi −9,5 (80% de sensibilidade, especificidade de 65%, p=0,003).
ConclusõesO SLG encontra-se associado a um estado de doença de maior gravidade e foi preditor de uma esperança de vida estimada mais baixa.
Heart failure (HF) has an overall population prevalence of approximately 1–3%1 and projections show that by 2030, its prevalence will increase 25% from 2013 estimates.2
Despite advances in the therapeutic management of chronic heart failure (CHF) and consequent improvement in survival over time,3 the death rate remains high, with an averaged overall 5-year mortality rate of 50%.4
Left ventricular systolic function (LVSF) is a strong outcome predictor with a major impact on the medical decisions.5 Consequently, LVSF should be quantified by a sensitive, accurate and reproducible method. Left ventricular ejection fraction (LVEF) is the most widely used parameter for the global assessment of LVSF. However, its measurement by two-dimensional (2D) echocardiography, has several disadvantages: it is based on geometric assumptions, depends on accurate tracing of endocardial borders and has significant interobserver and intraobserver variability.6 On the other hand, left ventricular (LV) global longitudinal strain (GLS) is an accurate and sensitive measure of myocardium deformation, allowing the angle-independent quantification of myocardial function in 2D, based on the LV active shortening in the longitudinal direction, which is more reproducible than LVEF and does not rely on geometrical assumptions.7,8
Some authors have suggested that GLS is useful in the prediction of cardiovascular (CV) events, in various heart diseases and clinical conditions.9–11 Nahum et al.10 showed that in CHF patients, GLS determined by speckle-tracking is superior to LVEF in identifying patients with poor clinical outcome. However, its ability to assess disease severity in CHF is still poorly addressed.
The Seattle Heart Failure Model Score (SHFM) is a validated multimarker risk assessment tool developed to predict prognosis in patients with CHF, which was derived from a cohort of 1125 HF patients and was prospectively validated in five additional outpatient cohorts including 9942 HF patients. It provides an accurate estimation of 1-, 2-, and 5-year survival, as well as of life expectancy using commonly obtained clinical, laboratory and therapeutic (pharmacologic and device) information.12
The purpose of this study was to evaluate the LV GLS association with clinical and prognostic indicators in patients with CHF and systolic dysfunction.
MethodsPopulation studyThe present study consisted of a cross-sectional analysis of clinical and echocardiographic data from ambulatory CHF patients, followed in an outpatient “Heart Failure, Cardiomyopathy and Pre-Transplant” Clinic, included consecutively, between September and November 2012. Eligible patients were CHF ambulatory patients, with EF <45% under optimal medical therapy for at least three months. Exclusion criteria included recent acute coronary syndrome, myocardial revascularization in the last three months, recent or planned cardiac surgery within six months, significant primary valvular disease, recent onset cardiomyopathy (<6 months), early stage of potentially reversible LV dysfunction (<6 months) and the presence of concomitant serious illness.
Patients in atrial fibrillation (AF) were not excluded from the study.
Patient demographic, clinical information and laboratory data were collected during the clinical visit at the time of the echocardiographic study.
SHFM applicationApplication of the SHFM was performed in all patients, using the online module.12 There were no missing covariates for score calculation. Estimated SHFM-predicted life expectancy was used as the prognostic status indicator.
Echocardiographic analysisA standardized complete echocardiographic examination was performed using a commercially available Vivid 7 system (GE Vingmed, Horton, Norway), with a M4S (2.5-MHz) probe. All data were stored digitally for off-line analysis on Echo-Pac PC software (V8.1 GE, Horton Norway).
Standard echocardiographic techniques were used to obtain two-dimensional (2D) and Doppler measurements in accordance with European Association of Echocardiography guidelines.13,14
LV volumes and LVEF were calculated by the biplane Simpson's method from apical 4- and 2-chamber views.
Peak tricuspid annular systolic velocity (S′), by tissue Doppler imaging (TDI) was used to assess right ventricle systolic function (RVSF).
The ratio of early transmitral velocity (E wave by conventional pulsed Doppler) to tissue Doppler mitral annular early diastolic velocity (e′ by TDI) was used to assess LV end-diastolic pressure (LVEDP).
LV longitudinal strain analysisGLS was assessed in the 18 LV segments from the three standard apical views (4-chamber, 2-chamber, 3-chamber), using a speckle tracking software. For strain processing, the peak of the R wave on the electrocardiogram was used as the reference time point for end-diastole. The endocardial border was traced manually in the end-diastolic frame. The software subsequently and automatically traced the borders in the other frames. Segments which failed to track were manually adjusted by the operator. Any segments which subsequently failed to track were excluded from the analysis.
In AF patients, cine loops were analyzed to determine which index beat should be used to GLS calculation. The speckle tracking software was able to successfully and appropriately track the frame-to-frame movement of LV segments if cardiac cycle of the index beat was >500 ms and if the preceding and pre preceding intervals of the index beat were of nearly equal duration (<60 ms).15
GLS was obtained only in the case of adequate tracking quality ≥5 of the six segments per view.
Graphical displays of deformation parameters for each segment were then generated automatically. GLS was obtained by averaging the peak strain values from the 18 regional longitudinal strain curves.
ReproducibilityFifteen patients were randomly selected for evaluation of the interobserver variability of GLS measurement by two independent observers. To get the intraobsever variability, the same measurement was repeated three to six months apart. Reproducibility was expressed as the mean absolute difference.
Statistical analysisContinuous variables with normal distribution were expressed as mean±SD and skewed variables as median and quartiles. Categorical variables were expressed as percentages. The comparison of continuous variables was performed by an independent sample t test. For categorical variables, the chi-square test was used.
A Pearson correlation analysis was used to evaluate the strength of the association between continuous variables.
A logistic regression model was used for multivariate analysis to investigate which prognostic factors identified using univariate analysis were independently associated with a lower survival (<10 years of life expectancy derived from SHFM).
Receiver-operating characteristic (ROC) curve analysis was used to determine optimal cutoff value of continuous variable. The best cutoff value was defined as the point with the highest sum of sensitivity and specificity.
Two-tailed p-values <0.05 were considered statistically significant. Statistical analysis was performed using SPSS Statistics version 19.0 (SPSS Inc., Chicago, Illinois).
ResultsOf the 62 patients included, adequate echocardiographic tracking quality of the LV segments, allowing appropriate GLS analysis, was feasible in 54 (87%) patients (54.6±12.1 years, 79.1% men), which constituted the final patient population. Three of the eight excluded patients had AF.
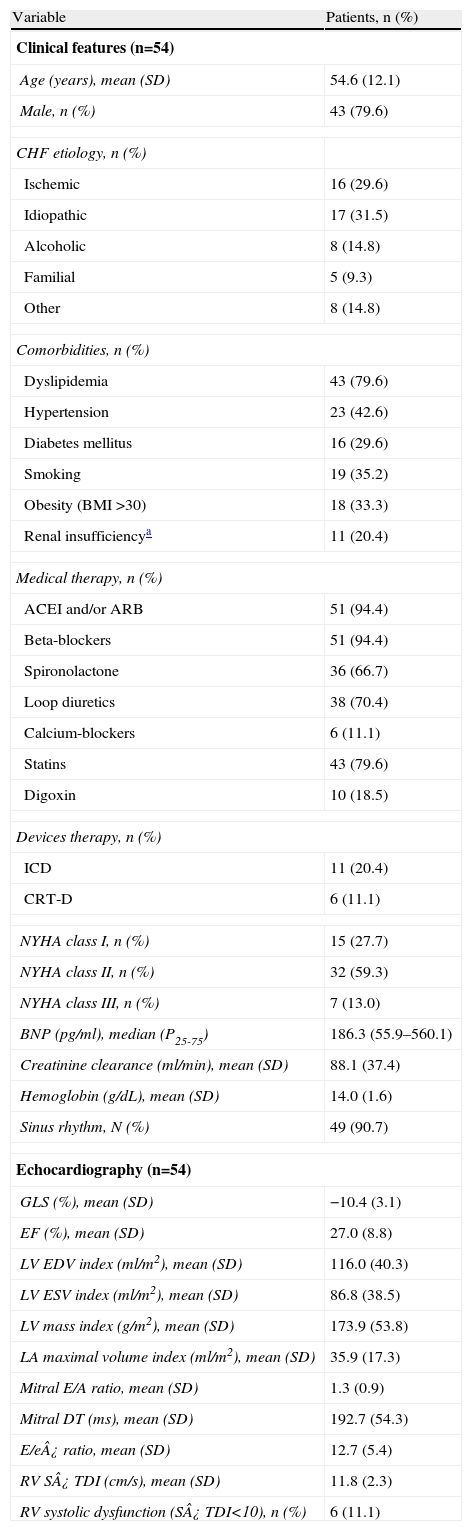
The clinical and echocardiographic characteristics of the overall patient population are summarized in Table 1.
Clinical and echocardiographic characteristics.
| Variable | Patients, n (%) |
| Clinical features (n=54) | |
| Age (years), mean (SD) | 54.6 (12.1) |
| Male, n (%) | 43 (79.6) |
| CHF etiology, n (%) | |
| Ischemic | 16 (29.6) |
| Idiopathic | 17 (31.5) |
| Alcoholic | 8 (14.8) |
| Familial | 5 (9.3) |
| Other | 8 (14.8) |
| Comorbidities, n (%) | |
| Dyslipidemia | 43 (79.6) |
| Hypertension | 23 (42.6) |
| Diabetes mellitus | 16 (29.6) |
| Smoking | 19 (35.2) |
| Obesity (BMI >30) | 18 (33.3) |
| Renal insufficiencya | 11 (20.4) |
| Medical therapy, n (%) | |
| ACEI and/or ARB | 51 (94.4) |
| Beta-blockers | 51 (94.4) |
| Spironolactone | 36 (66.7) |
| Loop diuretics | 38 (70.4) |
| Calcium-blockers | 6 (11.1) |
| Statins | 43 (79.6) |
| Digoxin | 10 (18.5) |
| Devices therapy, n (%) | |
| ICD | 11 (20.4) |
| CRT-D | 6 (11.1) |
| NYHA class I, n (%) | 15 (27.7) |
| NYHA class II, n (%) | 32 (59.3) |
| NYHA class III, n (%) | 7 (13.0) |
| BNP (pg/ml), median (P25-75) | 186.3 (55.9–560.1) |
| Creatinine clearance (ml/min), mean (SD) | 88.1 (37.4) |
| Hemoglobin (g/dL), mean (SD) | 14.0 (1.6) |
| Sinus rhythm, N (%) | 49 (90.7) |
| Echocardiography (n=54) | |
| GLS (%), mean (SD) | −10.4 (3.1) |
| EF (%), mean (SD) | 27.0 (8.8) |
| LV EDV index (ml/m2), mean (SD) | 116.0 (40.3) |
| LV ESV index (ml/m2), mean (SD) | 86.8 (38.5) |
| LV mass index (g/m2), mean (SD) | 173.9 (53.8) |
| LA maximal volume index (ml/m2), mean (SD) | 35.9 (17.3) |
| Mitral E/A ratio, mean (SD) | 1.3 (0.9) |
| Mitral DT (ms), mean (SD) | 192.7 (54.3) |
| E/e¿ ratio, mean (SD) | 12.7 (5.4) |
| RV S¿ TDI (cm/s), mean (SD) | 11.8 (2.3) |
| RV systolic dysfunction (S¿ TDI<10), n (%) | 6 (11.1) |
Values are mean±SD or n (%). ACEI: angiotensin-converting enzyme inhibitor; ARB: angiotensin-receptor blocker; BMI: body mass index; BNP: B-type natriuretic peptide; CHF: chronic heart failure; CRT-D: cardiac resynchronization therapy defibrillator; DT: deceleration time; E/A ratio: ratio of mitral peak velocity of early filling to mitral peak velocity of late filling; E/e′ ratio: ratio between early mitral inflow velocity and mitral annular early diastolic velocity; EDV: end-diastolic volume; EF: ejection fraction; ESV: end-systolic volume; GLS: global longitudinal strain; ICD: implantable cardioverter defibrillator; LA: left atrial; LV: left ventricular; NYHA: New York Heart Association; RV: right ventricular; S′: peak systolic velocity of the tricuspid annulus; TDI: tissue Doppler imaging.
Dyslipidemia, hypertension, and diabetes were present in 43 (80%), 23 (43%) and 16 (30%) patients, respectively. Ischemic etiology was present in 30% and 59% of the patients were in NYHA functional class II. Median BNP level was relatively low: 186.3 [P25-75 55.9–560.1] pg/ml.
Most patients were treated with beta-blockers (94%) and angiotensin converting enzyme inhibitors or angiotensin-receptor blockers (94%). Diuretics, spironolactone and statins were also frequently used in this patient population (Table 1).
In addition, 11 (20%) patients had an implantable cardioverter defibrillator (ICD) device and 6 (11%) had a cardiac resynchronization therapy defibrillator (CRT-D) device.
Baseline echocardiographyEnd diastolic and systolic volumes averaged 116.0±40.25 ml/m2 and 86.9±38.56 ml/m2, respectively. Mean LVEF was 27.0±8.8% and E/e′ ratio averaged 12.7±5.4. RVSD was observed in 11% of the patients and mean peak systolic velocity of the tricuspid annulus by tissue Doppler imaging (RV S′ TDI) averaged 11.8±2.3 cm/s.
LV longitudinal strain analysisThe mean GLS was −10.4±3.1%.
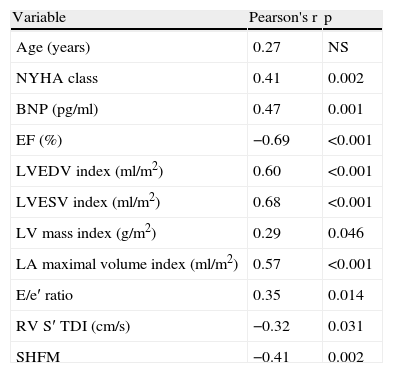
GLS was found to be highly associated with various clinical and echocardiographic variables; relevant correlations are summarized in Table 2.
Univariate correlations between LV GLS and clinical and echocardiographic indices.
| Variable | Pearson's r | p |
| Age (years) | 0.27 | NS |
| NYHA class | 0.41 | 0.002 |
| BNP (pg/ml) | 0.47 | 0.001 |
| EF (%) | −0.69 | <0.001 |
| LVEDV index (ml/m2) | 0.60 | <0.001 |
| LVESV index (ml/m2) | 0.68 | <0.001 |
| LV mass index (g/m2) | 0.29 | 0.046 |
| LA maximal volume index (ml/m2) | 0.57 | <0.001 |
| E/e′ ratio | 0.35 | 0.014 |
| RV S′ TDI (cm/s) | −0.32 | 0.031 |
| SHFM | −0.41 | 0.002 |
BNP: B-type natriuretic peptide; E/e′ ratio: ratio between early mitral inflow velocity and mitral annular early diastolic velocity; EDV: end-diastolic volume; EF: ejection fraction; ESV: end-systolic volume; GLS: global longitudinal strain; LA: left atrial; LV: left ventricular; NS: non-significant; NYHA: New York Heart Association; RV: right ventricular; S′: peak systolic velocity of the tricuspid annulus; SHFM: Seattle Heart Failure Model; TDI: tissue Doppler imaging.
GLS was significantly related to NYHA functional class (r=0.41, p=0.002) and BNP levels (r=0.47, p=0.001).
GLS presented a good correlation with LV end-diastolic volume index (r=0.60, p<0.001), LV end-systolic volume index (r=0.68, p<0.001) and with LVEF (r=-0.69, p<0.001).
The magnitude of GLS showed a moderate correlation with RVSF assessed by TDI-derived peak systolic tricuspid velocity (r=−0.32, p=0.031) and LV filling pressure, assessed by E/e′ ratio (r=0.35, p=0.014) and LA maximal volume index (r=0.57, p<0.001).
Finally, a significant correlation was found between GLS and SHFM prognostic estimates for life expectancy (r=−0.41, p=0.002).
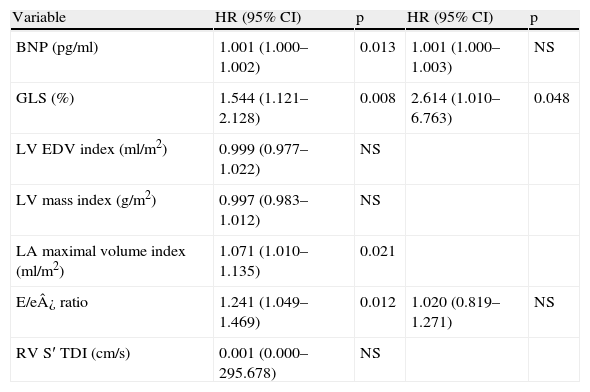
Predictors of worse prognosisUnivariate analysis using a logistic regression model (Table 3) showed that GLS predicted a life expectancy <10 years, derived from SHFM (OR 1.544, p=0.008). Other relevant variables found to be significantly associated to a worse survival included BNP levels (OR 1.001, p=0.013), E/e′ ratio (OR 1.241, p=0.012) and LA maximal volume (OR 1.071, p=0.021).
Univariate and multivariate logistic regression analysis for SHFM life expectancy <10 years.
| Variable | HR (95% CI) | p | HR (95% CI) | p |
| BNP (pg/ml) | 1.001 (1.000–1.002) | 0.013 | 1.001 (1.000–1.003) | NS |
| GLS (%) | 1.544 (1.121–2.128) | 0.008 | 2.614 (1.010–6.763) | 0.048 |
| LV EDV index (ml/m2) | 0.999 (0.977–1.022) | NS | ||
| LV mass index (g/m2) | 0.997 (0.983–1.012) | NS | ||
| LA maximal volume index (ml/m2) | 1.071 (1.010–1.135) | 0.021 | ||
| E/e¿ ratio | 1.241 (1.049–1.469) | 0.012 | 1.020 (0.819–1.271) | NS |
| RV S′ TDI (cm/s) | 0.001 (0.000–295.678) | NS |
BNP: B-type natriuretic peptide; E/e′ ratio: ratio between early mitral inflow velocity and mitral annular early diastolic velocity; EDV: end-diastolic volume; GLS: global longitudinal strain; LA: left atrial; LV: left ventricular; NS: non-significant; RV: right ventricular; S′: peak systolic velocity of the tricuspid annulus; SHFM: Seattle Heart Failure Model; TDI: tissue Doppler imaging.
In a multivariate analysis adjusted to E/e′ ratio and BNP (significant variables not contributing to the SHFM), GLS remained a significant independent predictor of survival (OR 2.614, 95% CI: 1.010–6.763, p=0.048).
The area under the receiver operating characteristic curve (AUC) for GLS to predict a life expectancy <10 years was highly relevant (AUC: 0.802 [0.653–0.951]) and a GLS cut-off >−9.5% identified patients with poor prognosis (80% sensitivity, 65% specificity, p=0.003) – Figure 1.
Reproducibility
The intraobserver and interobserver mean difference for GLS measurement were 0.47±0.40 and 0.86±0.56, respectively.
DiscussionMyocardial function assessment significantly influences therapeutic decision making, including devices implantation.5 In daily practice, myocardial function is based on LVEF by echocardiography using the Simpson biplane model. However, this method has several limitations: it is based on geometric assumptions and depends on image quality, on load conditions and on the experience of the operator.6 In addition, LVEF lacks sensitivity to accurately identify myocardial contractility impairment.16–18 In the present study, global systolic LV myocardial function was determined with 2D speckle tracking strain analysis, which is feasible, reproducible, angle independent and does not rely on geometry assumptions.8 2D-echocardiographic TDI is also available to LVSF assessment.19 However, some limitations should be noted: it is angle dependent and it appears more noised and less robust compared to speckle tracking modality.
The characteristics of this study population are partly different from other groups of CHF patients, as our patients are younger and we present a high number of CHF patients with non-ischemic etiology, like familial dilated cardiomyopathies. This can be explained by the specific purposes of the outpatient clinic that receives potential candidates for cardiac transplantation.
NYHA functional class and BNP levels were significantly correlated with GLS. Donal et al.20 shown an important association between GLS and functional capacity, assessed by cardiopulmonary exercise testing performance. Yoneyama et al.21 had also found a close correlation between longitudinal LV strain and BNP levels. The apparent clinical stability and the exclusively outpatient setting probably contributed to the relatively low NYHA functional class and BNP levels for a CHF population with depressed LVEF.
The good correlation found in the current evaluation between GLS and LVEF is consistent with the scientific literature.8,22
Furthermore, a variety of echocardiographic parameters have been suggested to estimate LV filling pressure in CHF. The E/e′ ratio is the most frequently used parameter for this purpose and, along with E-wave deceleration time (DT), has become central in this evaluation.23
LA maximal volume index is gaining incremental relevance and has been recognized as a reflection of severity and chronicity of diastolic dysfunction and as an independent predictor of mortality, both CV as well as all-cause.24 New studies are focusing in the role of LA function and LA strain in diastolic function evaluation and prognostic information.25 In this analysis, a lower magnitude of GLS was associated with worsening LV diastolic function, assessed by E/e′ ratio and LA maximal volume index.
Previous reports have already shown that GLS is a sensitive measure of LV mechanics and is a good predictor of CV events, in various heart diseases and clinical conditions.9–11 This study showed that GLS is highly associated to disease severity status and is an independent predictor of survival, according to the integrated assessment provided by SHFM. This model simultaneously weights a large number of clinical, laboratory and therapeutics variables with established prognostic impact. This is the first study that relates a myocardial deformation marker with a prognostic indicator derived by a multivariable risk assessment tool. The SHFM integrated approach is highly advantageous and provides feasibility and accuracy to investigations. For example, because CHF etiology (ischemic versus non ischemic) corresponds to a SHFM integrated parameter, additional population stratification is redundant, since CHF etiology clinical impact has been already taken into account in the SHFM survival results.
LV GLS by speckle tracking seems to have a good ability to stratify HF patients prognosis. In this study, LV GLS >−9.5% indicated an increased risk of worse outcome. These results may have clinical and practical impact as these patients often require a more aggressive medical treatment and monitoring. Thus, LV function assessment by speckle tracking-derived GLS should be encouraged in clinical practice.
Nonetheless, intrinsic limitations of speckle tracking should be considered and include: frame rate dependency, potential errors in epicardial or endocardial border tracing due to suboptimal image quality, and need for an appropriate learning curve to achieve adequate experience in using analysis softwares. Because of beat-to-beat variation in AF patients, LV GLS calculation may be more difficult to estimate. Besides this, lack of standardization with intermachine variability and frequent software upgrades, resulting in different and changing references values are also limiting characteristics of speckle-tracking software.26
It is important to note that this validated multivariate model application provides a prognostic status approximation and does not replace the clinical and prognostic relevance of the information derived from a real long-term follow-up of the patients. Future robust prospective long-term follow-up investigations should confirm these study results and provide further insight into the impact of myocardial deformation assessment on medical decisions, regarding device implantations or cardiac transplant proposal. Additional investigations might also explore the presence of other relevant clinical associations in CHF patients, such as any relation between echocardiographic GLS and quality of life.
LimitationsAll conclusions are supported by a developed prognostic model and not on the real evolution and follow-up of a CHF population. Nevertheless, SHFM is a widely validated model for predicting survival and assessing disease severity in outpatients with CHF, based on multiple clinical variables known to have prognostic impact in CHF patients.
Speckle tracking 2D strain is highly dependent on image quality and the inherent limitation therein. In addition, radial and circumferential strains were not explored. However, longitudinal deformation is a particular marker of subendocardial function, which is frequently the first layer to be affected when myocardial function deteriorates. Thus, longitudinal deformation appears to be a more sensitive marker of cardiac function compared to radial or circumferential strain.22
Finally, our conclusions apply to CHF outpatients and should not be extrapolated for hospitalized patients or acute heart failure patients.
Conclusions2D-echocardiographic LV GLS, determined by speckle-tracking, was significantly correlated with clinical and echocardiographic parameters of recognized prognostic value, in patients with CHF and systolic dysfunction. GLS was strongly associated to a higher severity disease status and predicted a lower prognostic estimate for life expectancy.
Future longitudinal studies are required to confirm the potential prognostic value of GLS measurements in the CHF population.
Ethical disclosuresProtection of human and animal subjectsThe authors declare that no experiments were performed on humans or animals for this study.
Confidentiality of dataThe authors declare that they have followed the protocols of their work center on the publication of patient data
Right to privacy and informed consentThe authors declare that no patient data appear in this article
Conflicts of interestThe authors have no conflicts of interest to declare.
