Socioeconomic factors may affect mortality due to cerebrovascular diseases (CBVDs), hypertensive diseases (HYPDs), and circulatory system diseases (CSDs). This study aimed to assess the association between the Human Development Index (HDI) and the extent of supplementary health coverage and mortality due to these diseases in the Brazilian Federative Units (FUs) between 2004 and 2013.
MethodsThe Municipal HDI (MHDI) scores of each FU for 2000 and 2010 were retrieved from the Atlas Brasil website, and supplementary health coverage data for the period 2004-2013 were obtained from the national regulatory agency for private health insurance. Population and mortality data were obtained from the website of the Department of Information Technology of the Unified Health System (DATASUS). Mortality rates were weighted by ill-defined causes of death and standardized by age.
ResultsThe MHDI increased between 2000 and 2010 in all FUs, in half of which it was 0.7 or higher. Supplementary health coverage increased in the country during the study period and was inversely associated with mortality due to CSDs and CBVDs between 2004 and 2013. Mortality due to CBVDs and HYPD in 2013 showed an inverse linear association with the MHDI in 2000.
ConclusionMortality due to CSDs, CBVDs, and HYPDs was influenced by socioeconomic factors. There was a significant inverse association between socioeconomic factors and mortality due to CSDs, CBVDs, and HYPDs. Plans to reduce mortality due to these diseases should include measures to foster economic development and reduce inequality.
Fatores socioeconômicos podem influenciar as taxas de mortalidade por doenças do aparelho circulatório (DAC), doenças cerebrovasculares (DCBV) e doenças hipertensivas (DHIP). Esse estudo tem por objetivo avaliar as relações entre o Índice de Desenvolvimento Humano (IDH) e a extensão da cobertura da saúde suplementar e as taxas de mortalidade por estas doenças nas unidades da federação (UF) do Brasil, entre 2004 e 2013.
MétodosOs dados de IDH das UF (IDH Municipal, IDHM) dos anos 2000 e 2010 foram obtidos no site Atlas Brasil e a cobertura da saúde suplementar foi disponibilizada pela Agência Nacional de Saúde Suplementar, entre 2004 e 2013. Dados sobre população e óbitos foram retirados do site do Departamento de Informática do Sistema Único de Saúde (DATASUS). As taxas de mortalidade foram compensadas pelas causas mal definidas e padronizadas por idade.
ResultadosTodas as UF apresentaram elevação no IDHM entre 2000 e 2010 e cerca de 50% apresentaram índice maior ou igual a 0,7. Houve incremento na cobertura dos planos de saúde no país e isto se relacionou de maneira inversa com a mortalidade por DAC e DCBV, no período entre 2004 e 2013. As taxas de mortalidade por DCBV e DHIP no ano de 2013 apresentaram relação linear e inversa com IDHM no ano 2000.
ConclusãoAs taxas de mortalidade por DAC, DCBV e DHIP foram influenciadas por fatores socioeconômicos. Houve uma significativa associação inversa entre fatores socioeconômicos e taxas de mortalidade por DAC, DCBV e DHIP. Planos para a redução da mortalidade por estas doenças devem incluir medidas de desenvolvimento econômico e redução das desigualdades no país.
Cerebrovascular diseases (CBVDs) and ischemic heart diseases are the leading causes of death in Brazil according to official statistics.1 However, standardized mortality rates for both conditions have declined over the past 33 years.2 By contrast, mortality due to hypertensive diseases (HYPDs), after remaining relatively stable in the 1990s, has increased in the last decade.2
In addition to established classic risk factors for circulatory system diseases (CSDs), such as hypertension, diabetes, smoking, and dyslipidemia,3,4 some studies have shown a strong association between CSDs and factors not usually included in action plans aimed at reducing mortality associated with chronic diseases.5–7 These factors include atmospheric pollution8,9 and socioeconomic factors such as educational level, per capita income, national or regional gross domestic product (GDP), and the Human Development Index (HDI).10–16 At the same time, the association between medical care through private health insurance (also known as supplementary health coverage) and mortality due to CSDs has not been assessed.
Social inequality has declined substantially in Brazil over the past 15 years, and the percentage of individuals in the country below the poverty line (defined as those with a daily income of less than US$1.90) decreased from 24.7% to 7.4% between 2001 and 2014.17 In addition, the number of individuals covered by supplementary health insurance has risen over the last 10 years, which may reflect an increase in the population's purchasing power.18 Nonetheless, social disparities are still marked in Brazil, as demonstrated by the wide variation in the HDI scores of the country's 27 federative units (FUs) (the 26 states plus the Federal District of the capital, Brasilia). In 2010, for example, the HDI of Alagoas was 0.63, compared with 0.82 in the Federal District.19
Since studies suggest an inverse correlation between socioeconomic factors and mortality due to CSDs, such factors should be taken into account when analyzing disease behavior.10–16,20,21 This study aimed to assess the association between the HDI and the extent of supplementary health coverage and mortality due to CSDs, CBVDs and HYPDs in the Brazilian FUs between 2004 and 2013.
MethodsThe HDI scores of each FU in 2000 and 2010 were retrieved from the Atlas Brasil website.19 These scores, calculated for municipalities and states, are adapted from the country's overall HDI by the United Nations Development Program in Brazil, the Institute for Applied Economic Research, and the João Pinheiro Foundation. The resulting index, termed the Municipal HDI (MHDI), is interpreted in the same way as the overall HDI, but at municipal and state level.
The percentages of the average supplementary health coverage in the country's FUs for the period 2004-2013 were obtained from the website of the national regulatory agency for private health insurance.18 To estimate the average values, we used data collected in September each year, and the percentages of beneficiaries considered in the analysis included either individuals or groups covered by health insurance plans. We also estimated the average annual growth of the coverage percentages using linear regression of the percentages of annual coverage between the years 2004 and 2013; we used regression coefficients as estimates of annual growth.
Weighted crude and weighted standardized mortality rates were estimated for the selected causes: CSDs (International Classification of Diseases, Tenth Revision [ICD-10]22 Chapter IX, HYPDs (I10-I15), and CBVDs (ICD-10 codes I60-I69). Weighted rates were calculated based on information on ill-defined causes of death (ICD-10 Chapter XVIII).
Data on the population in each FU were provided by the Brazilian Institute of Geography and Statistics (IBGE)23 and obtained from the Department of Information Technology of the Unified Health System (DATASUS) website.1 Annual data were collected from 2004 to 2013 for the following age groups: below 30 years, 30-39 years, 40-49 years, 50-59 years, 60-69 years, 70-79 years, and 80 years or older.
Mortality data were obtained from the Mortality Information System of the Brazilian Ministry of Health, available on the DATASUS website.1 Annual data were retrieved from 2004 to 2013 for each of the above age groups.
Estimated mortality was weighted by combining the number of deaths due to ill-defined causes and those due to the selected causes (CSDs, HYPDs, and CBVDs). The distribution of deaths from each selected cause among deaths due to ill-defined causes was assumed to have a similar distribution as that observed among defined causes. Weighted crude mortality rates were then obtained for all ages per 100000 population.
Standardized weighted mortality rates per 100000 population were then calculated using the mortality information for each age range. This yielded rates standardized by age, according to the Brazilian age distribution in 2010, calculated using the direct method.24 Pearson's linear correlation coefficients were estimated between the series of pairs formed by the MHDI scores in 2000 and 2010 and the weighted standardized mortality rates in the FUs in 2010 to 2013. As it would not make sense to correlate the MHDI from one year with the mortality rates from previous years, we excluded the weighted standardized mortality rates from previous years. This was done to select the year of the MHDI and the year of mortality rates with a correlation coefficient farthest from zero, which reflects an absence of correlation. From this selection, we constructed relationship graphs between the MHDI and the weighted standardized mortality rates by selected cause, in which the coordinates correspond to the FUs.
Microsoft Excel® and Stata® were used for the data analysis and graph construction.
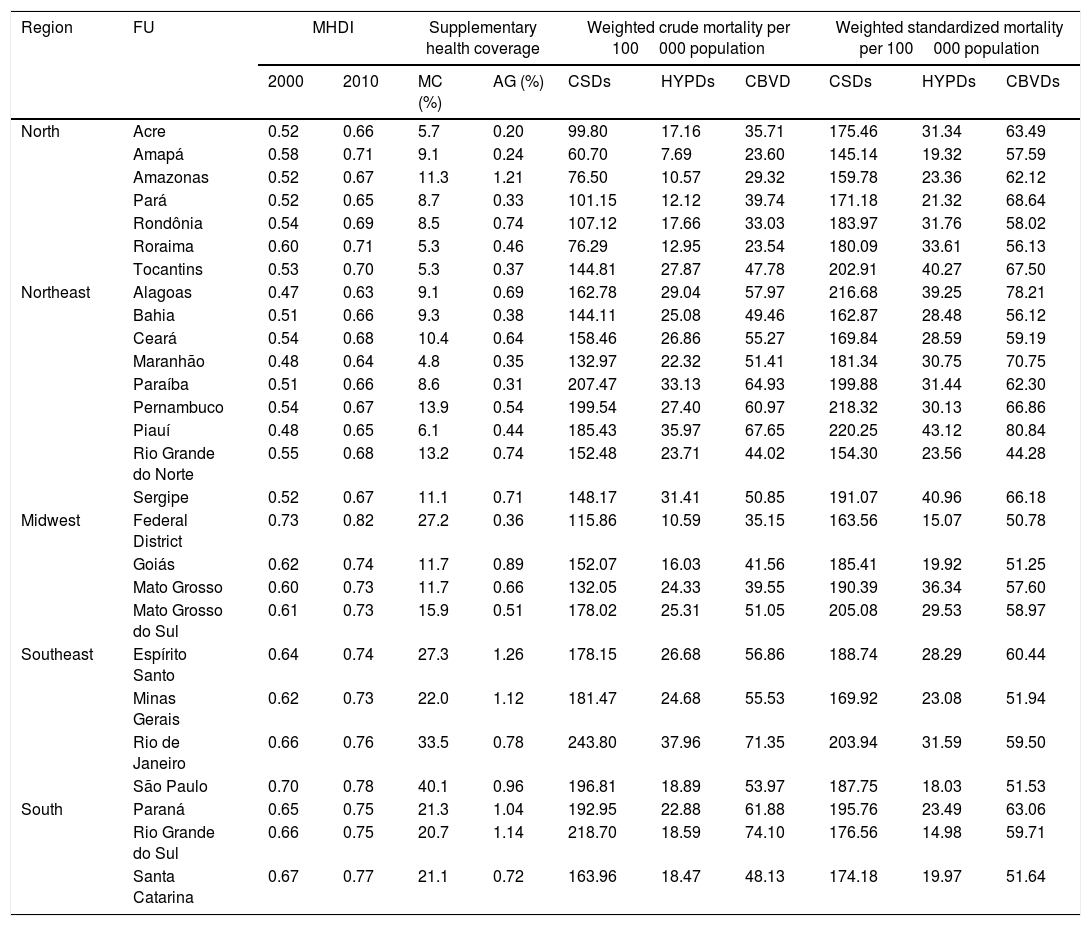
ResultsAs shown in Table 1, the MHDI increased in all FUs between 2000 and 2010. However, in 2010, only the Federal District had an index greater than 0.8, while approximately half of the FUs had an MHDI of 0.7 or more, including all FUs in the midwest, southeast, and south, less than half of those in the north, and none of those in the northeast.
Municipal Human Development Index in 2000 and 2010, percentage of coverage and annual growth of supplementary health coverage, and weighted crude and weighted standardized mortality rates due to selected causes per 100000 population by regions and federative units of Brazil between 2004 and 2013.
| Region | FU | MHDI | Supplementary health coverage | Weighted crude mortality per 100000 population | Weighted standardized mortality per 100000 population | ||||||
|---|---|---|---|---|---|---|---|---|---|---|---|
| 2000 | 2010 | MC (%) | AG (%) | CSDs | HYPDs | CBVD | CSDs | HYPDs | CBVDs | ||
| North | Acre | 0.52 | 0.66 | 5.7 | 0.20 | 99.80 | 17.16 | 35.71 | 175.46 | 31.34 | 63.49 |
| Amapá | 0.58 | 0.71 | 9.1 | 0.24 | 60.70 | 7.69 | 23.60 | 145.14 | 19.32 | 57.59 | |
| Amazonas | 0.52 | 0.67 | 11.3 | 1.21 | 76.50 | 10.57 | 29.32 | 159.78 | 23.36 | 62.12 | |
| Pará | 0.52 | 0.65 | 8.7 | 0.33 | 101.15 | 12.12 | 39.74 | 171.18 | 21.32 | 68.64 | |
| Rondônia | 0.54 | 0.69 | 8.5 | 0.74 | 107.12 | 17.66 | 33.03 | 183.97 | 31.76 | 58.02 | |
| Roraima | 0.60 | 0.71 | 5.3 | 0.46 | 76.29 | 12.95 | 23.54 | 180.09 | 33.61 | 56.13 | |
| Tocantins | 0.53 | 0.70 | 5.3 | 0.37 | 144.81 | 27.87 | 47.78 | 202.91 | 40.27 | 67.50 | |
| Northeast | Alagoas | 0.47 | 0.63 | 9.1 | 0.69 | 162.78 | 29.04 | 57.97 | 216.68 | 39.25 | 78.21 |
| Bahia | 0.51 | 0.66 | 9.3 | 0.38 | 144.11 | 25.08 | 49.46 | 162.87 | 28.48 | 56.12 | |
| Ceará | 0.54 | 0.68 | 10.4 | 0.64 | 158.46 | 26.86 | 55.27 | 169.84 | 28.59 | 59.19 | |
| Maranhão | 0.48 | 0.64 | 4.8 | 0.35 | 132.97 | 22.32 | 51.41 | 181.34 | 30.75 | 70.75 | |
| Paraíba | 0.51 | 0.66 | 8.6 | 0.31 | 207.47 | 33.13 | 64.93 | 199.88 | 31.44 | 62.30 | |
| Pernambuco | 0.54 | 0.67 | 13.9 | 0.54 | 199.54 | 27.40 | 60.97 | 218.32 | 30.13 | 66.86 | |
| Piauí | 0.48 | 0.65 | 6.1 | 0.44 | 185.43 | 35.97 | 67.65 | 220.25 | 43.12 | 80.84 | |
| Rio Grande do Norte | 0.55 | 0.68 | 13.2 | 0.74 | 152.48 | 23.71 | 44.02 | 154.30 | 23.56 | 44.28 | |
| Sergipe | 0.52 | 0.67 | 11.1 | 0.71 | 148.17 | 31.41 | 50.85 | 191.07 | 40.96 | 66.18 | |
| Midwest | Federal District | 0.73 | 0.82 | 27.2 | 0.36 | 115.86 | 10.59 | 35.15 | 163.56 | 15.07 | 50.78 |
| Goiás | 0.62 | 0.74 | 11.7 | 0.89 | 152.07 | 16.03 | 41.56 | 185.41 | 19.92 | 51.25 | |
| Mato Grosso | 0.60 | 0.73 | 11.7 | 0.66 | 132.05 | 24.33 | 39.55 | 190.39 | 36.34 | 57.60 | |
| Mato Grosso do Sul | 0.61 | 0.73 | 15.9 | 0.51 | 178.02 | 25.31 | 51.05 | 205.08 | 29.53 | 58.97 | |
| Southeast | Espírito Santo | 0.64 | 0.74 | 27.3 | 1.26 | 178.15 | 26.68 | 56.86 | 188.74 | 28.29 | 60.44 |
| Minas Gerais | 0.62 | 0.73 | 22.0 | 1.12 | 181.47 | 24.68 | 55.53 | 169.92 | 23.08 | 51.94 | |
| Rio de Janeiro | 0.66 | 0.76 | 33.5 | 0.78 | 243.80 | 37.96 | 71.35 | 203.94 | 31.59 | 59.50 | |
| São Paulo | 0.70 | 0.78 | 40.1 | 0.96 | 196.81 | 18.89 | 53.97 | 187.75 | 18.03 | 51.53 | |
| South | Paraná | 0.65 | 0.75 | 21.3 | 1.04 | 192.95 | 22.88 | 61.88 | 195.76 | 23.49 | 63.06 |
| Rio Grande do Sul | 0.66 | 0.75 | 20.7 | 1.14 | 218.70 | 18.59 | 74.10 | 176.56 | 14.98 | 59.71 | |
| Santa Catarina | 0.67 | 0.77 | 21.1 | 0.72 | 163.96 | 18.47 | 48.13 | 174.18 | 19.97 | 51.64 | |
AG: annual growth (2004-2013); CSDs: circulatory system diseases; CBVDs: cerebrovascular diseases; FU: federative unit; HYPDs: hypertensive diseases; MC: mean coverage (2004-2013); MHDI: Municipal Human Development Index.
The average percentage of beneficiaries of private health coverage between 2004 and 2013 in Brazil was 21.9%. Within the same period, only the FUs of the southern and southeastern regions and the Federal District (midwest) had coverage greater than 20%. The coverage was greatest in the state of São Paulo (40.1%) and least in Maranhão (4.8%) (Table 1).
More than half of the beneficiaries of all FUs were covered by group health insurance plans, mainly business health plans. At least 56.6% of the beneficiaries in Alagoas and Pará (which had the lowest percentage) and 86.7% in the Federal District were covered by group plans. In the northern and northeastern regions, the percentages of group plans sponsored by employers were generally lower than those in other regions (Table 1). The country presented an overall increase in group plans from 65.2% to 79.1% between 2004 and 2013, with an average of 73.9%. Group plans increased in most FUs, but remained constant in Alagoas, Amapá, Amazonas, Roraima, and Sergipe, and decreased in Piauí.
Most of the FUs in the northern region had an average growth in coverage of less than 0.5% per year, with the exception of Amazonas, which presented the second largest growth in the period (Table 1). In the northeastern region, approximately half of the FUs had a growth rate below 0.5% a year, while the other half failed to reach 1%. In the midwest, none of the FUs had growth rates greater than 1%, while the Federal District had the least growth in this region, with less than 0.5% a year. In the southern and southeastern regions, the annual growth was in all cases greater than 0.5%; overall, Espírito Santo had the highest growth among all FUs in the country (1.26%; Table 1).
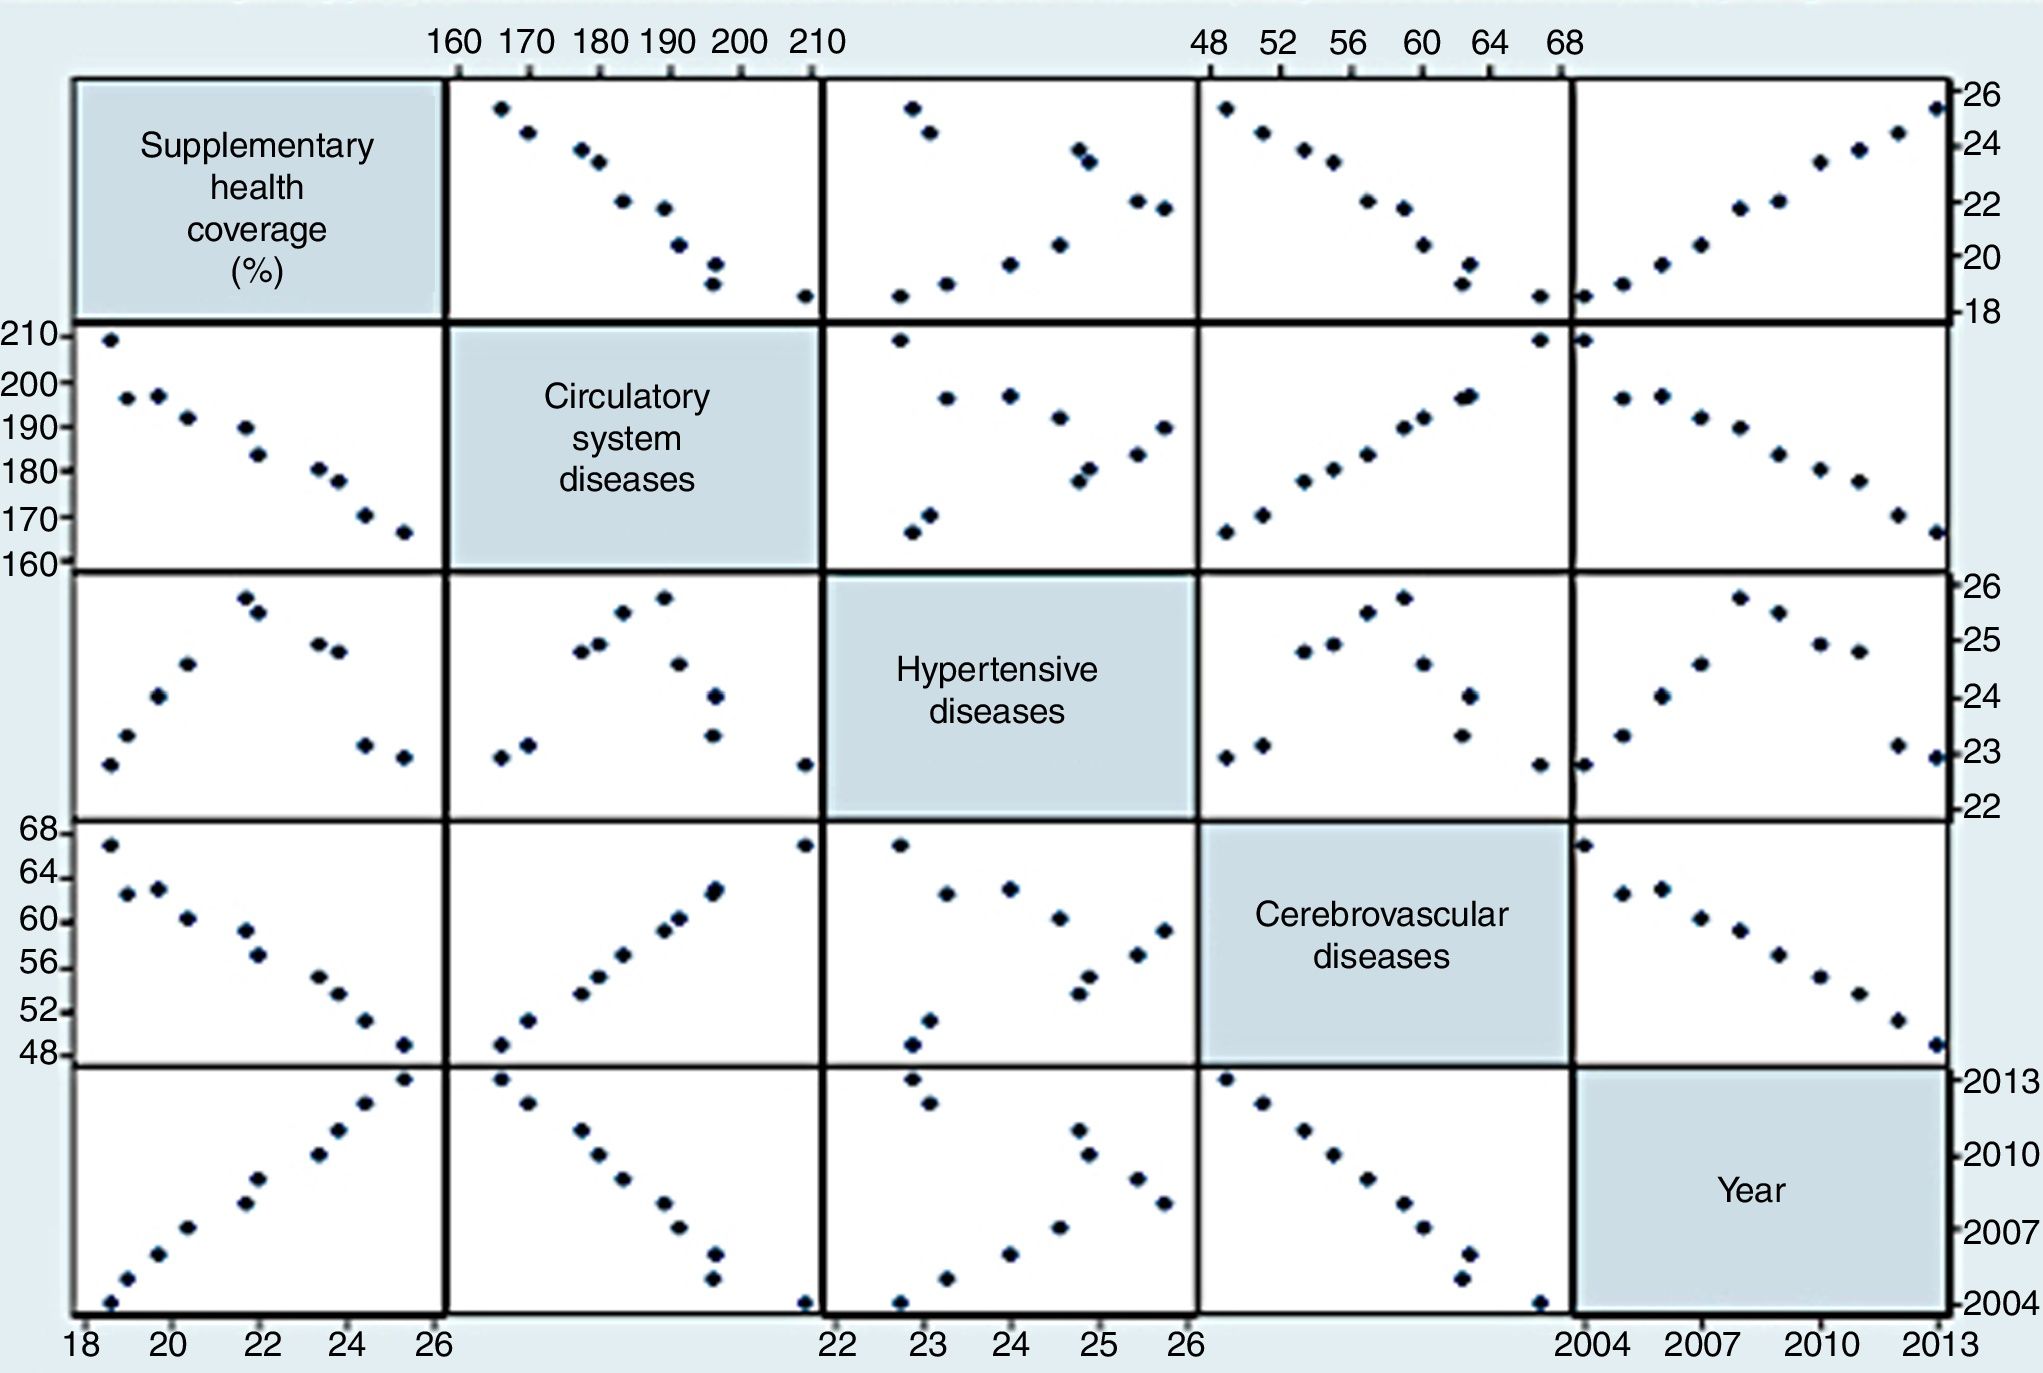
The weighted crude mortality rates per 100000 population for CSDs, HYPDs, and CBVDs were generally lower in the northern region, while the standardized rates were generally similar across the regions. However, among the weighted standardized rates, those of the northeast were generally higher. The state of Piauí had the highest weighted standardized mortality rates due to CSDs, HYPDs, and CBVDs (Table 1). As shown in Figure 1, the percentage of supplementary health coverage increased from 2004 to 2013 in Brazil and presented an inverse relationship with mortality due to CSDs and CBVDs; however, the relationship with HYPDs did not show a definite pattern.

The weighted standardized mortality rates due to CSDs and CBVDs were directly associated, and both declined between 2004 and 2013. HYPDs rates showed no definite pattern compared to CSDs and CBVDs. During the first half of the observation period, there was an increase in mortality due to HYPDs in Brazil, while a decline was seen in the second half, from 2009 onwards (Figure 1).
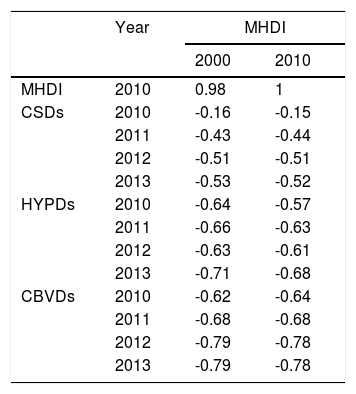
Table 2 shows that the best correlation coefficients, i.e., those furthest from zero, were obtained from the correlation between the MHDI in 2000 and the weighted standardized mortality rates due to CSDs, HYPDs, and CBVDs in 2013 compared with those obtained with the MHDI in 2010. For this reason, in Figure 2 we present the associations between the weighted standardized mortality rates due to CSDs, HYPDs, and CBVDs in 2013 with the MHDI scores in the FUs in 2000.
Correlation coefficients between MHDI scores in 2000 and 2010 and weighted standardized mortality rates due to selected causes, per 100000 population in 2010 to 2013, in the Brazilian federative units.
| Year | MHDI | ||
|---|---|---|---|
| 2000 | 2010 | ||
| MHDI | 2010 | 0.98 | 1 |
| CSDs | 2010 | -0.16 | -0.15 |
| 2011 | -0.43 | -0.44 | |
| 2012 | -0.51 | -0.51 | |
| 2013 | -0.53 | -0.52 | |
| HYPDs | 2010 | -0.64 | -0.57 |
| 2011 | -0.66 | -0.63 | |
| 2012 | -0.63 | -0.61 | |
| 2013 | -0.71 | -0.68 | |
| CBVDs | 2010 | -0.62 | -0.64 |
| 2011 | -0.68 | -0.68 | |
| 2012 | -0.79 | -0.78 | |
| 2013 | -0.79 | -0.78 | |
CSDs: circulatory system diseases; CBVDs: cerebrovascular diseases; HYPDs: hypertensive diseases; MHDI: Municipal Human Development Index.
 Mortality from circulatory system diseases in 2013 and MHDI in 2000; (B) mortality from hypertensive diseases in 2013 and MHDI in 2000; (C) mortality from cerebrovascular diseases in 2013 and MHDI in 2000. CSDs: circulatory system diseases; CBVDs: cerebrovascular diseases; FUs: federative units; HYPDs: hypertensive diseases; MHDI: Municipal Human Development Index. North region FUs – AC: Acre; AM: Amazonas; AP: Amapá; PA: Pará; RO: Rondônia; RR: Roraima; TO: Tocantins. Northeast FUs – AL: Alagoas; BA: Bahia; CE: Ceará; MA: Maranhão; PB: Paraíba; PE: Pernambuco; PI: Piauí; RN: Rio Grande do Norte; SE: Sergipe. Midwest region FUs – DF: Federal District; GO: Goiás; MS: Mato Grosso do Sul; MT: Mato Grosso. Southeast region FUs – ES: Espírito Santo; MG: Minas Gerais; RJ: Rio de Janeiro; SP: São Paulo. South region FUs – PR: Paraná; RS: Rio Grande do Sul; SC: Santa Catarina.")
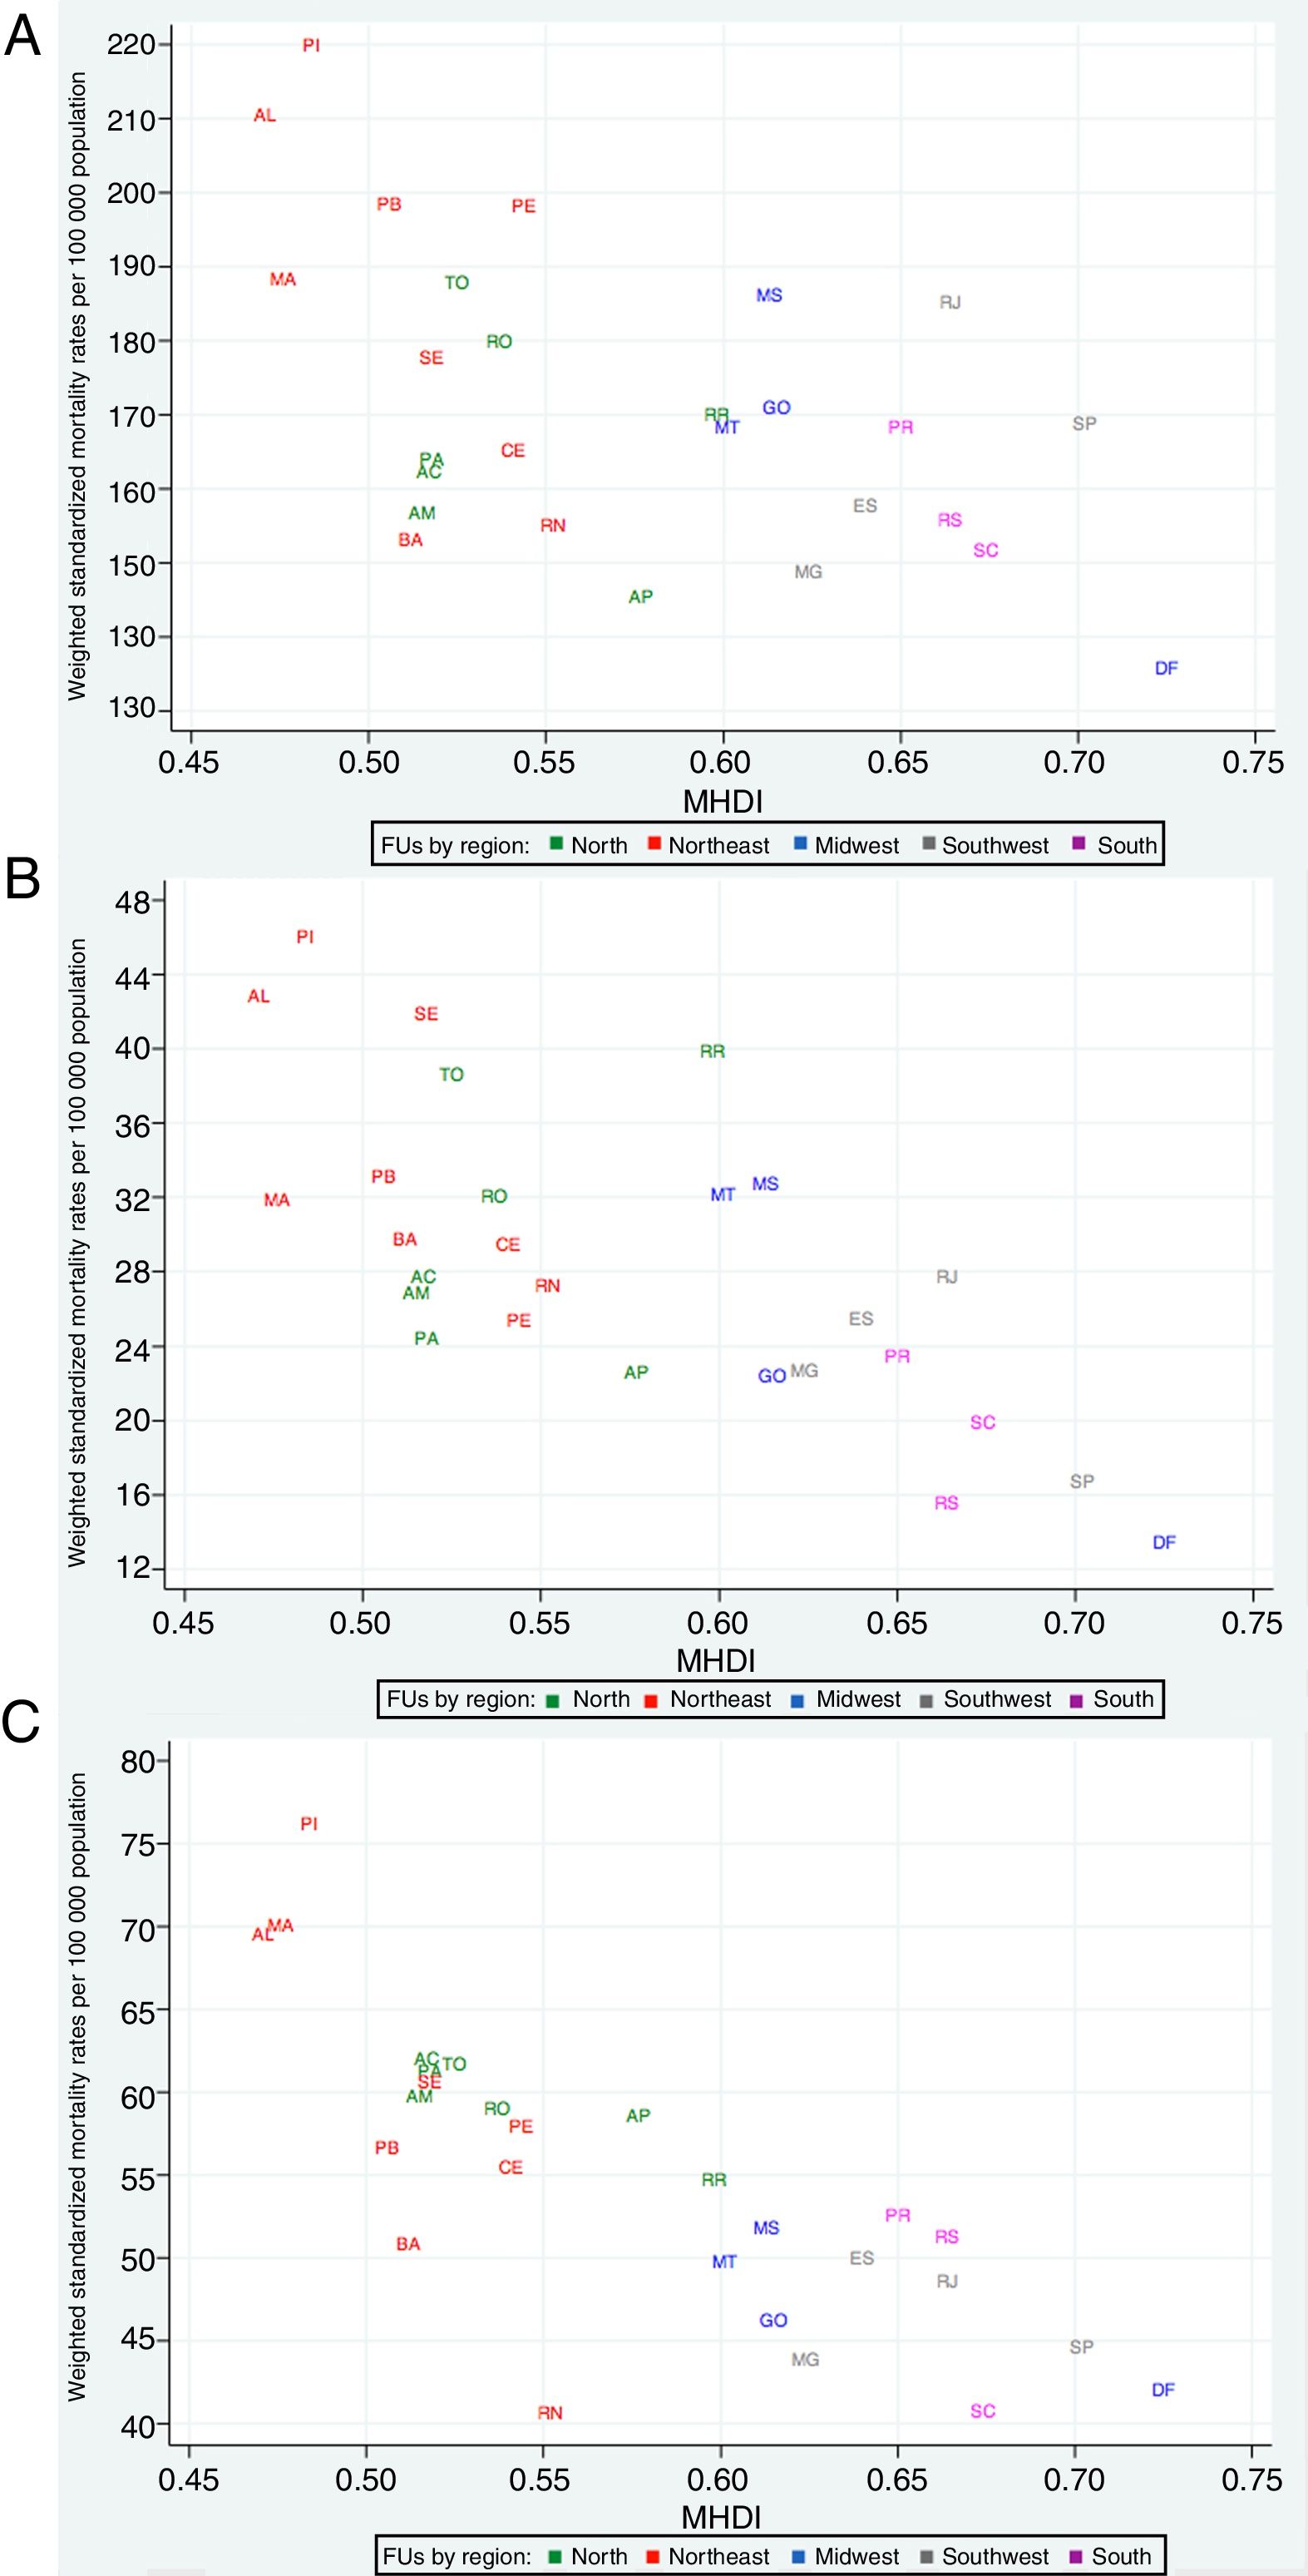
Mortality rates from selected causes in 2013 and Municipal Human Development Index in 2000 in Brazilian federative units. (A) Mortality from circulatory system diseases in 2013 and MHDI in 2000; (B) mortality from hypertensive diseases in 2013 and MHDI in 2000; (C) mortality from cerebrovascular diseases in 2013 and MHDI in 2000.
CSDs: circulatory system diseases; CBVDs: cerebrovascular diseases; FUs: federative units; HYPDs: hypertensive diseases; MHDI: Municipal Human Development Index. North region FUs – AC: Acre; AM: Amazonas; AP: Amapá; PA: Pará; RO: Rondônia; RR: Roraima; TO: Tocantins. Northeast FUs – AL: Alagoas; BA: Bahia; CE: Ceará; MA: Maranhão; PB: Paraíba; PE: Pernambuco; PI: Piauí; RN: Rio Grande do Norte; SE: Sergipe. Midwest region FUs – DF: Federal District; GO: Goiás; MS: Mato Grosso do Sul; MT: Mato Grosso. Southeast region FUs – ES: Espírito Santo; MG: Minas Gerais; RJ: Rio de Janeiro; SP: São Paulo. South region FUs – PR: Paraná; RS: Rio Grande do Sul; SC: Santa Catarina.
Figure 2 also shows that CSDs (Figure 2A), HYPDs (Figure 2B), and CBVDs (Figure 2C) presented a tendency for an inverse association with MHDI. Many FUs with a low MHDI in the northern and northeastern regions had high weighted standardized mortality rates. In contrast, regarding HYPDs and CBVDs, the FUs with the highest MHDI, such as the Federal District, São Paulo, Santa Catarina, and Rio Grande do Sul, were those with the lowest mortality. With the exception of the Federal District, these FUs did not show the same pattern regarding mortality due to CSDs. The linearity of the associations was more marked with HYPDs and CBVDs, especially with the latter.
DiscussionThe MHDI is calculated using indicators of longevity (life expectancy at birth), access to knowledge (educational level of adult population and educational flow of young people), and standard of living (per capita income).19 Increases in MHDI reflect social and economic advances, and between 2000 and 2010, approximately 50% of the Brazilian FUs had indices above 0.7, which reflect a high HDI according to the United Nations classification,25 which is also used for municipal and state MHDIs by the Atlas Brasil website.19
Between 2004 and 2013, the number of supplementary health insurance beneficiaries increased in all FUs in the country. This may be explained in part by the country's economic growth and social advances during this period, reflected by the increased per capita GDP.17 By contrast, by the end of the study period (2013) the percentages of private healthcare coverage in the northern and northeastern FUs had failed to reach those observed at the beginning (2004) in São Paulo, Rio de Janeiro, the Federal District, and Espírito Santo.
Income is one of the dimensions calculated in the MHDI. Therefore, it was to be expected that greater purchasing power would be associated with an increased number of beneficiaries of health plans, both individual and group.18 Where the availability of public coverage is low, private alternatives are only available if formal employment and purchasing power are also sufficient to generate an increased supply of supplementary healthcare.18,26 Private care reflects formal employment, since most beneficiaries belong to group plans.18 Usually, business plans are covered by employers, whereas those belonging to individual or family plans are required to pay for insurance coverage, for which they need to have sufficient income.
Furthermore, supplementary private health insurance coverage may also reflect the availability of public healthcare (the Brazilian Unified Health Care System [SUS]), even though in Brazil public healthcare is supposed to be universal, i.e., available to the entire population. The SUS tertiary care network, which offers procedures of tertiary or hospital-level complexity, is mostly privately owned and contracted by the SUS to perform these procedures.5,26–28 Rare exceptions include public hospitals mostly located in state capitals, although there are only a small number of these.29 This means that tertiary care and a large part of secondary care5,26–28 depend on the existence of the same private network that provides care to the beneficiaries of health plans.
Therefore, the inverse linear correlation observed between health insurance coverage and mortality due to CSDs and CBVDs (Figure 1) should be interpreted with caution. The private sector has higher expenditure per capita than the SUS and offers easier access to highly specialized procedures,1,5,26–28 which reflects greater availability of tests such as computed tomography, magnetic resonance imaging, coronary angiography, and other tertiary diagnostic and therapeutic procedures. Furthermore, the country's per capita GDP increased during the study period.17 The reductions in mortality due to CSDs and CBVDs may also be associated with factors related to economic growth, improvement in living conditions and reduction in poverty, adoption of healthier habits, and improved control of the risk factors associated with these diseases.7,10–16,20,21,30–35
Unlike with CSDs and CBVDs, the relationship between health insurance coverage and HYPDs did not show a definite pattern. The public health network in Brazil only offers comprehensive coverage for primary care,26,36 and it should therefore it is necessary to recognize that attention to dramatic episodes related to chronic diseases, such as stroke, is highly dependent on the private network. On the other hand, effective hypertension control is largely dependent on primary care offered through public outpatient clinics and comprehensive programs such as the Family Health Strategy36,37 and the Popular Pharmacy Program38 (which was established in 2004 and has since expanded).
Although mortality from HYPDs tended to increase between 2004 and 2008, unlike that from CSDs and CBVDs, this paradox may be a result of the rules for coding the underlying cause of death39 in addition to better hypertension control. Official health statistics consider the underlying cause of death as the primary information, and when CBVDs are mentioned in death certificates it is selected as the underlying cause 75% of the time, as reported in another study.40 Thus, better hypertension control may reduce the number of mentions of CBVDs in death certificates, and HYPDs and associated diseases could be selected as the underlying cause according to the coding rules.39 The decreasing trend observed in mortality from HYPDs between 2008 and 2013 could reflect an absolute decrease in mentions of HYPDs in death certificates.
The correlation coefficients of MHDI in 2000 with weighted standardized mortality rates due to HYPDs and CBVDs after 2010 were higher than those of MHDI in 2010, probably because changes may require longer periods. Similar results were observed by Soares et al., who assessed the correlation of per capita GDP and HDI with mortality due to CSDs, ischemic heart diseases and CBVDs in three Brazilian states,13 and by Curioni et al., who found a similar association between the HDI and a decline in mortality due to CSDs in Brazil over 24 years.15
In recent years, the relationship between the HDI and mortality due to CSDs and the prevalence of CSDs risk factors has been addressed in several studies.7,10–16,30–35 However, little attention has been paid to HYPDs and CSDs.14 The present study focused on CBVDs and HYPDs, which showed an inverse linear association with the MHDI in 2000 (Figure 2). Some studies show a higher prevalence of hypertension, diabetes, and smoking in low-income populations,5,11,15,30 and as observed in other studies, the lowest percentages of hypertension treatment and control34 and increased mortality41 among individuals with lower educational levels may explain the results found in this study.
This study has limitations specific to the collection of data from death certificates. The incompleteness of the certificates and incorrect filling of the underlying cause cannot be overlooked. However, the databases on mortality data are considered accurate in view of the collection and verification systems employed. Another limitation of the study was the method used to compensate for ill-defined causes of death, which may have under- or over-represented other causes.42 The MHDI, in turn, is only available in census years organized by the IBGE and has its own limitations in terms of data collection. Finally, it should also be borne in mind that the MHDI, like other indicators, does not completely assess all aspects of socioeconomic phenomena, including socioeconomic inequality.
ConclusionMortality rates due to CSDs and CBVDs standardized by age and weighted by ill-defined causes of death showed an inverse relationship with supplementary health coverage in Brazil, probably reflecting the impact of income and inequality on this association. By contrast, no definite pattern was observed between mortality and HYPDs, probably due to improvements in basic care programs. Mortality due to CSDs, HYPDs, and CBVDs was inversely associated with the MHDI, with the most linear associations occurring for HYPDs and CBVDs. In view of the data presented, we believe that the most lasting and consistent reductions in mortality due to CSDs may be achieved by reducing the country's social and economic inequalities.
Clinical perspectivesThe present study shows that mortality rates due to CSDs, HYPDs, and CBVDs are inversely associated with the MHDI of the country's FUs, with the most linear associations seen for HYPDs and CBVDs. In view of the data presented, prevention of deaths from CSDs goes beyond interventions on classical risk factors for such diseases, and the most lasting and consistent reductions in mortality would probably be achieved by reducing the country's social and economic inequalities.
Conflicts of interestThere were no grants involved in this article. There are no potential conflicts of interest, including related consultancies, shareholdings and funding grants.
