Although normotensive cancer patients with acute pulmonary embolism (PE) are a heterogeneous population, most validated clinical prognostic scores classify these patients as high-risk individuals, which limits their usefulness in this setting. In this study, we aimed to identify readily available clinical predictors of overall 30-day and one-year mortality in normotensive cancer patients with PE.
Methods and ResultsWe performed a retrospective single-center study that included all normotensive cancer patients with PE diagnosed by multidetector computed tomography (MDCT) during emergency department stay between January 2010 and December 2011. Clinical, MDCT and laboratory variables were collected for all patients. A total of 69 patients were included. All-cause mortality was 28% and 55% at 30 days and one year of follow-up, respectively. Lower mean arterial pressure, higher lactate level and a higher Shock Index (SI) at hospital admission were associated with increased all-cause mortality at 30 days and one year of follow-up. The simplified Pulmonary Embolism Severity Index was not a predictor of short- or long-term mortality. An SI of ≥0.7 was found to be associated with lower event-free survival in both short- and long-term follow-up (hazard ratio 7.20 [95% CI, 1.66-31.21, p<0.01] and 3.51 [95% CI, 1.70-7.25, p<0.01], respectively).
ConclusionsThis is the first article reporting the value of the SI, a user-friendly and readily available clinical tool, as an independent and accurate predictor of 30-day and one-year all-cause mortality in normotensive cancer patients with symptomatic PE.
Apesar de os doentes oncológicos (DO) normotensos com tromboembolia pulmonar aguda (TEP) constituírem uma população heterogénea, a maioria dos scores de prognóstico classifica estes doentes como sendo de alto risco, limitando a sua utilidade. O objetivo deste estudo foi a identificação de variáveis clínicas simples que constituíssem preditores de mortalidade aos 30 dias e a um ano em DO normotensos com TEP.
Métodos e resultadosEstudo retrospetivo, de centro único, que incluiu todos os DO normotensos com TEP diagnosticada por TC durante a permanência no SU, entre janeiro/2010 e dezembro/2011. Foram colhidas variáveis clínicas, radiológicas e laboratoriais. Sessenta e nove doentes foram incluídos. Uma pressão arterial média mais baixa, um valor de lactato mais alto e um valor de índice de choque (IC) mais elevado associaram-se a uma mortalidade de todas as causas mais elevada aos 30 dias e a um ano de follow-up. A taxa de mortalidade de todas as causas foi 28% e 55% aos 30 dias e a um ano de seguimento, respetivamente. O score de sPESI não foi um preditor de mortalidade a curto ou a longo prazo. Um valor de IC ≥ 0,7 associou-se a uma sobrevida mais baixa tanto a curto como a longo prazo (FC 7,20 IC 95%, 1,66 a 31,21, p < 0,01) e 3,51 (IC 95%, 1,70 a 7,25, p < 0,01), respetivamente.
ConclusõesEste é o primeiro estudo que documenta o valor do IC como preditor independente e preciso da mortalidade aos 30 dias e a um ano de DO normotensos com TEP sintomática.
In patients with acute symptomatic pulmonary embolism (PE), risk stratification is crucial, as it guides therapeutic decision-making and determines the appropriateness of early hospital discharge or exclusively ambulatory treatment.1 Risk for adverse outcomes is usually assessed using validated clinical prognostic scores, preferably the Pulmonary Embolism Severity Index (PESI) or its simplified version (sPESI).1 While both use objective clinical items to estimate 30-day mortality, the sPESI is easier to use and has similar prognostic accuracy and clinical utility to the original PESI.2
Venous thromboembolism (VTE) is a frequent event in cancer patients.3 Although it is associated with significant mortality when the whole population of cancer patients is taken into account, there is considerable heterogeneity in prognosis when individual cancer patients are considered.4 Prognostic tools adapted to this population are lacking.5 In fact, the sPESI classifies all cancer patients as high-risk individuals, as cancer is itself included as a predictive variable in the score.2,6,7 It therefore has less discriminatory power for assessing the prognostic heterogeneity in this patient population, which limits its usefulness in this setting.
In this study, we aimed to identify readily available clinical predictors of overall 30-day and one-year mortality in normotensive cancer patients with suspected PE.
MethodsStudy design and populationThis retrospective single-center study included all consecutive normotensive cancer patients with PE diagnosed by multidetector computed tomography (MDCT) during emergency department (ED) stay between January 2010 and December 2011.
The inclusion criteria were age ≥18 years, presence of cancer, suspected PE at ED admission, MDCT pulmonary angiography positive for PE, and mean arterial pressure (MAP) of >65 mmHg at ED admission. Patients with unavailable medical records or incomplete follow-up were excluded.
All patients were treated according to the European Society of Cardiology guidelines.1
Demographic and clinical data, MDCT variables and blood test results at the time of ED assessment were collected by reviewing patients’ medical records. The Shock Index (SI) was calculated as the ratio of heart rate to systolic blood pressure and the sPESI was determined as previously described.3,4
The primary endpoint was all-cause 30-day mortality and the secondary endpoint was all-cause mortality at one year. Both endpoints were assessed by consulting an online nationwide death certificate database.
Clinical and laboratory variablesDemographic and clinical variables collected included the following: age, gender, symptoms at hospital admission (collapse, behavioral changes, dizziness, dyspnea, chest pain, asymmetric edema, cough and hemoptysis), vital signs (blood pressure, heart rate, temperature), Glasgow Coma Scale, peripheral oxygen saturation, presence of additional risk factors for PE (surgery in the previous four weeks, immobilization for more than three days) and comorbidities (cardiopulmonary disease, cerebrovascular disease, peripheral artery disease, atrial fibrillation, hypertension and diabetes). Laboratory variables included arterial blood gas parameters (pH, partial pressure of oxygen [PaO2] and lactate), hemoglobin, serum creatinine, D-dimers and cardiac biomarkers (troponin I and brain natriuretic peptide).
Contrast-enhanced multidetector computed tomographyAll MDCT examinations were performed during patient stay in the ED by the on-call radiologist. Images were obtained on a 64-slice MDCT scanner during inspiratory breath-hold when possible, or during quiet breathing if the patient was short of breath. Intravenous injection of contrast medium was used to assess intraluminal filling defects. Images were immediately analyzed by the on-call radiologist, who diagnosed PE based on the presence of pulmonary artery filling defects. PE was categorized as subsegmental vs. non-subsegmental according to the most proximal clot observed on the MDCT scan.
Statistical analysisCategorical variables were described as frequency and percentage. Continuous variables were tested for normality using the Kolmogorov-Smirnov test. If normal, values were presented as mean ± standard deviation. If the distribution remained skewed after logarithmic transformation of the variables, values were presented as median and interquartile range. The distribution of variables between patients who survived and those who had died at 30-day and one-year follow-up was compared using the chi-square test and Fisher's exact test for categorical variables and the Student's t test or the Mann-Whitney U test for continuous variables, as appropriate according to normality and homoscedasticity. Variables that were statistically different between survivors and non-survivors at 30-day and one-year follow-up in univariate analysis were included in a multivariate model. For those that remained statistically different, the relationship to the primary endpoint was analyzed by a Cox proportional hazards regression model to estimate hazard ratios and 95% confidence intervals (CI). Receiver operating characteristic (ROC) curves were also used to assess the ability of these selected variables to discriminate between survivors and non-survivors at 30-day and one-year follow-up. The suggested cut-offs for measurements to predict 30-day and one-year mortality were selected so that the Youden index (sensitivity+specificity-1) had a maximum value. Finally, overall survival curves and time-to-event analysis stratified by the independent predictors of the primary and secondary endpoints were calculated through Kaplan-Meier estimates and were compared using the log-rank test. Two-tailed p values <0.05 were considered statistically significant. IBM SPSS Statistics version 23 (IBM, Vienna, Austria) was used for the statistical analysis.
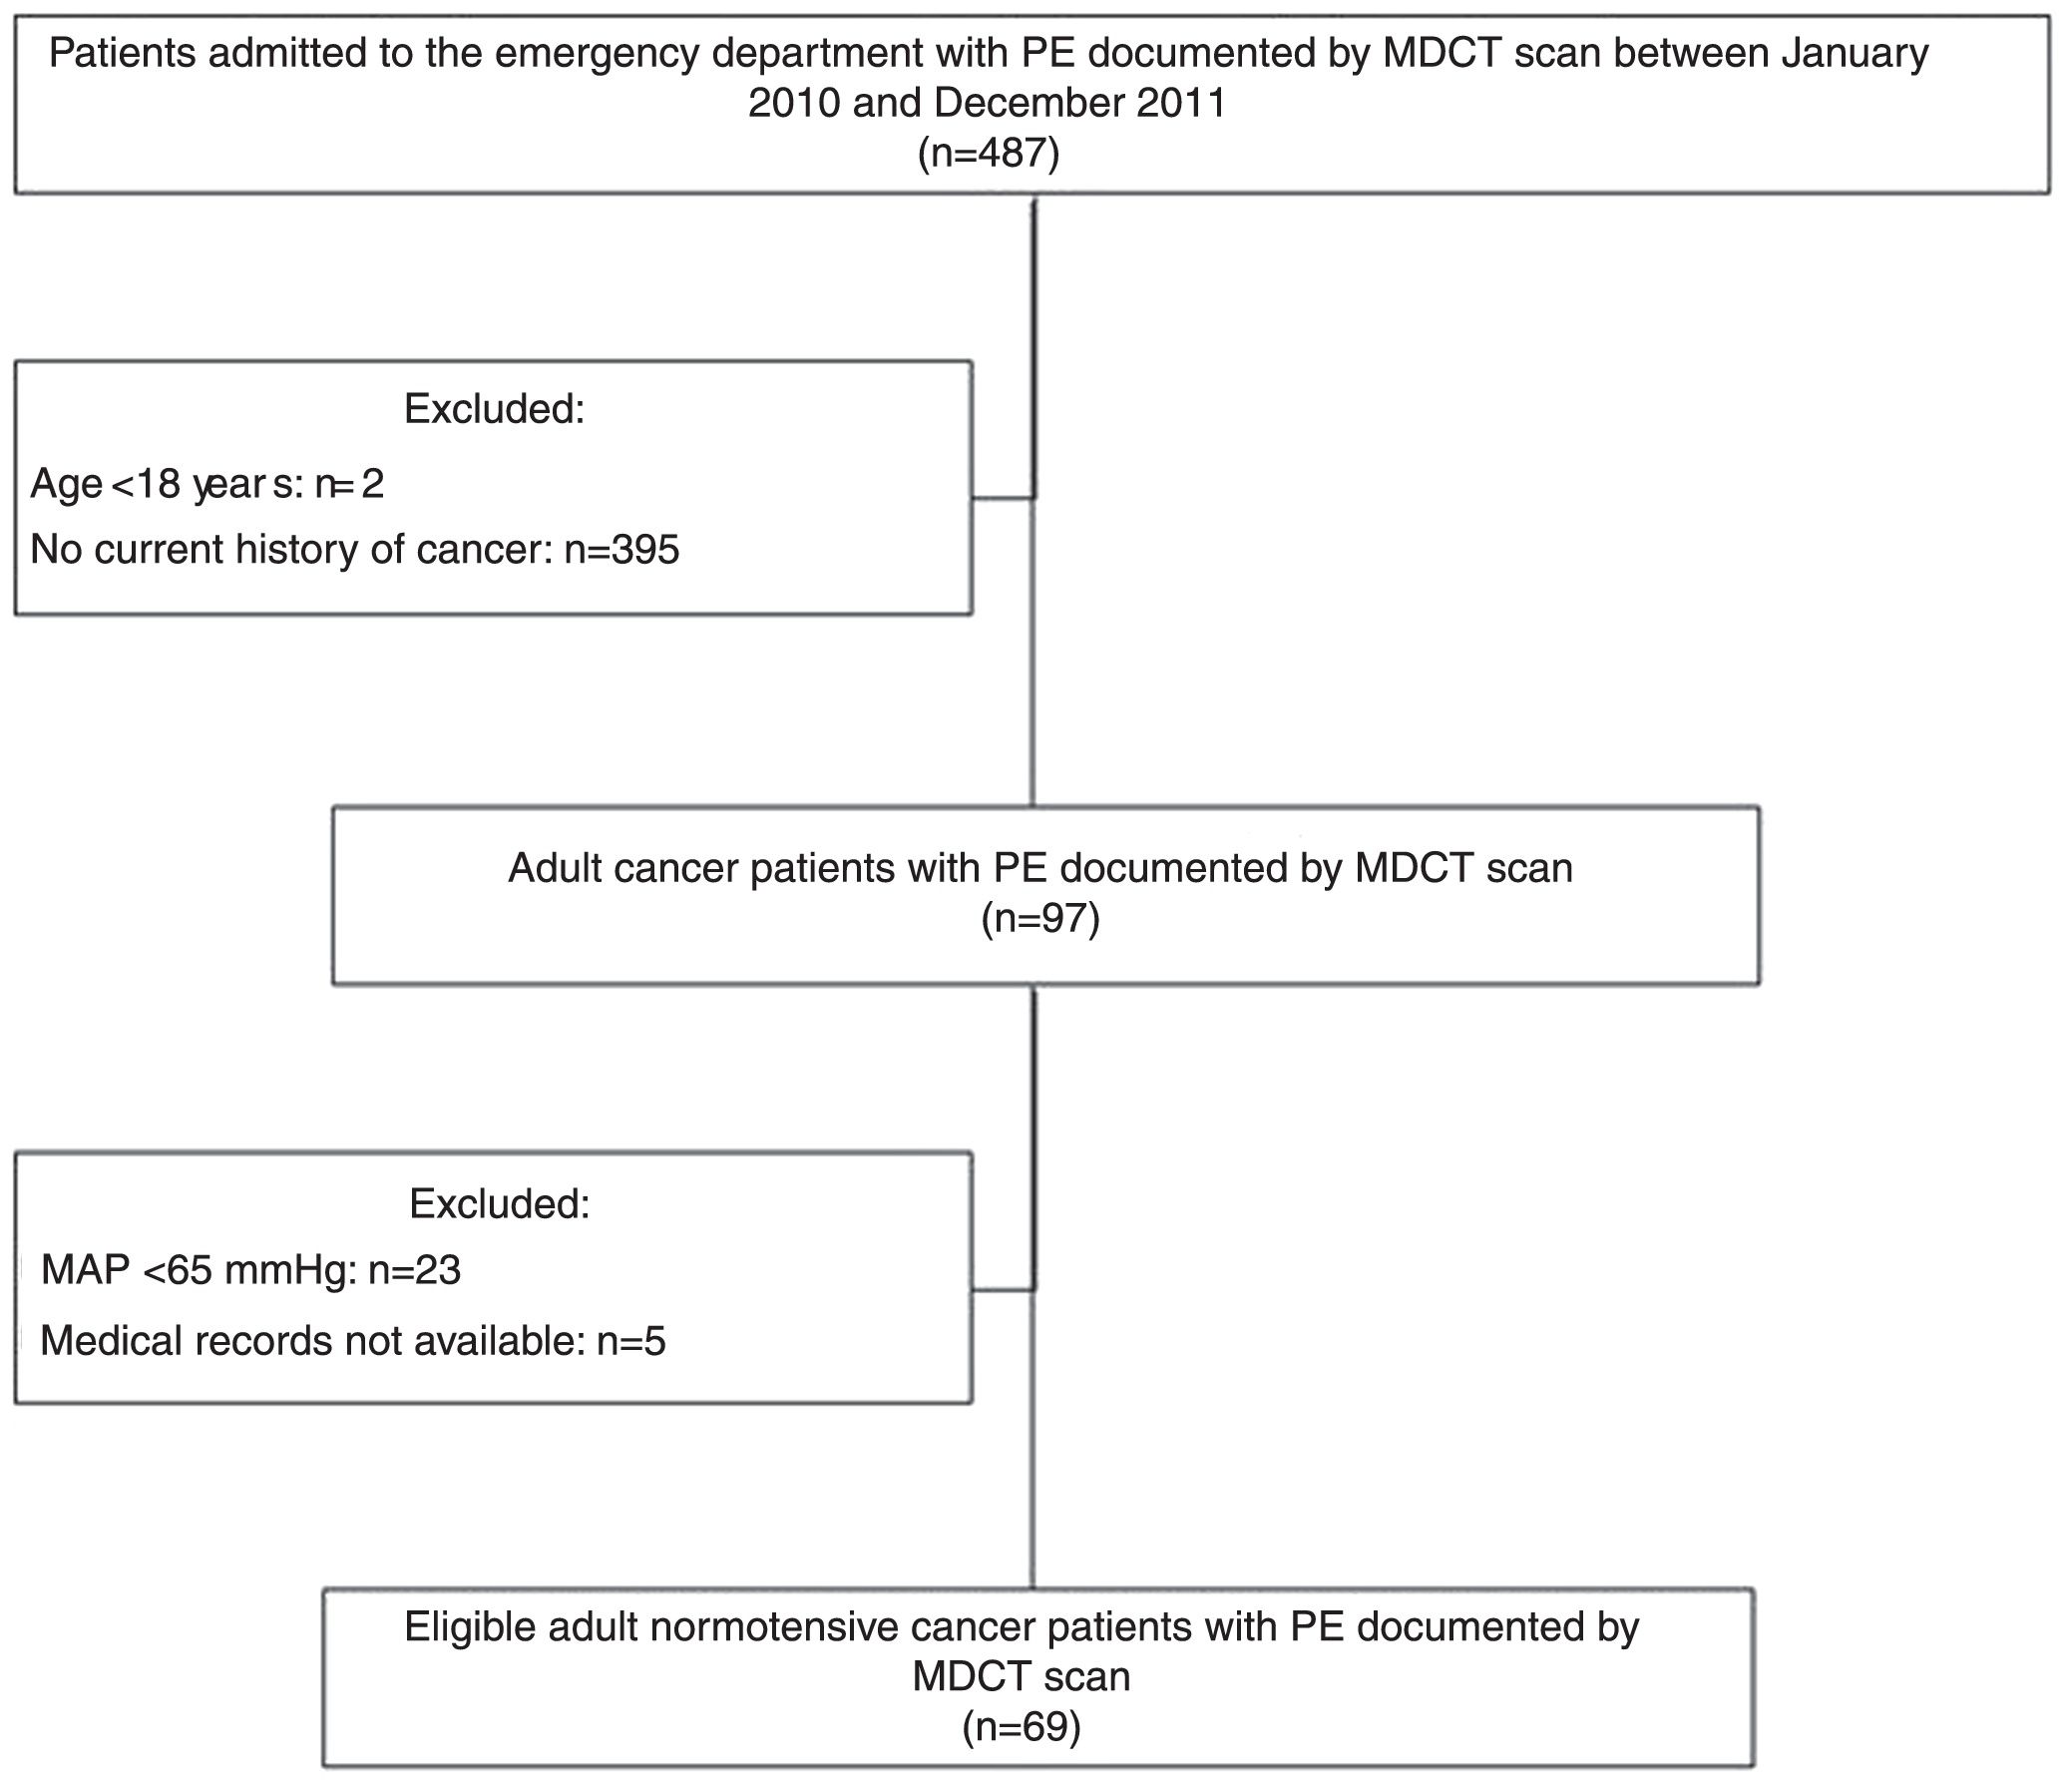
ResultsClinical dataFigure 1 presents the flowchart of the patient selection process. Between January 2010 and December 2011, 487 patients admitted to the ED had PE documented by MDCT scan. Of these, 97 (19.92%) were cancer patients. A total of 28 patients were excluded from the analysis (23 with MAP <65 mmHg at admission and five for whom medical records were unavailable).

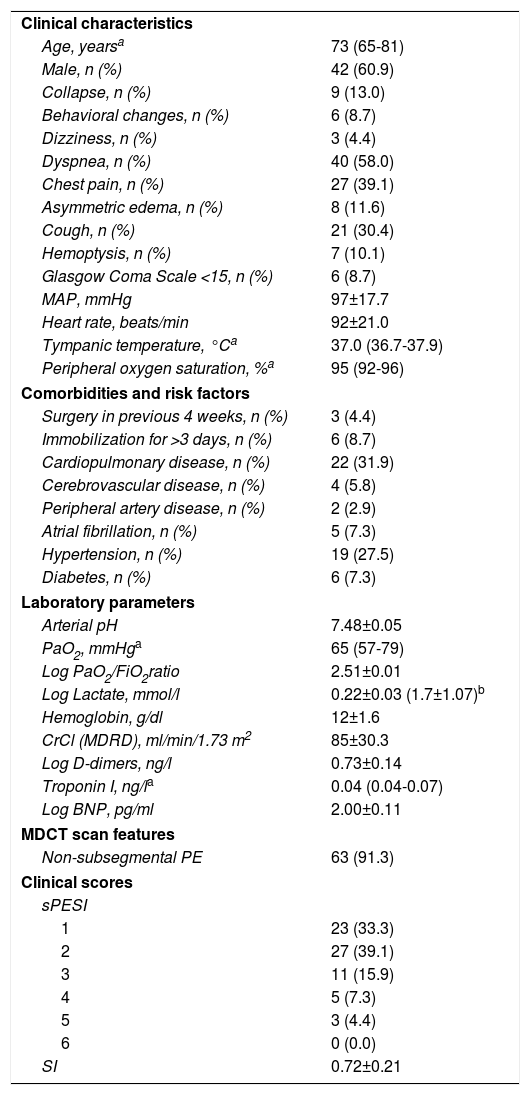
Table 1 summarizes clinical, laboratory and image data for the 69 patients enrolled in our study. Most patients were male (61%) and the median age was 73 years. The most common presenting symptom was dyspnea (58%), followed by chest pain (39%) and cough (30%). The prevalence of comorbidities, mainly cardiopulmonary disease and hypertension, was high. However, besides cancer, additional risk factors for acute PE were not commonly identified at hospital admission: three patients (4%) had undergone surgery in the previous four weeks and six (9%) had been immobilized for more than three days. Patients’ vital signs (MAP, heart rate, tympanic temperature and peripheral oxygen saturation) were within the normal range. In terms of laboratory parameters, median PaO2 was low, with a low PaO2/fraction of inspired oxygen (FiO2) ratio and high mean arterial pH. Lactate levels measured in the blood gas analysis were higher than the upper limit of normal and, as expected, D-dimers were elevated. Interestingly, troponin and brain natriuretic peptide levels in the study population were within the normal range. It should also be noted that only a few patients (9%) had subsegmental PE.
Clinical, laboratory, and imaging features and clinical scores in cancer patients with acute pulmonary embolism (n=69).
| Clinical characteristics | |
| Age, yearsa | 73 (65-81) |
| Male, n (%) | 42 (60.9) |
| Collapse, n (%) | 9 (13.0) |
| Behavioral changes, n (%) | 6 (8.7) |
| Dizziness, n (%) | 3 (4.4) |
| Dyspnea, n (%) | 40 (58.0) |
| Chest pain, n (%) | 27 (39.1) |
| Asymmetric edema, n (%) | 8 (11.6) |
| Cough, n (%) | 21 (30.4) |
| Hemoptysis, n (%) | 7 (10.1) |
| Glasgow Coma Scale <15, n (%) | 6 (8.7) |
| MAP, mmHg | 97±17.7 |
| Heart rate, beats/min | 92±21.0 |
| Tympanic temperature, °Ca | 37.0 (36.7-37.9) |
| Peripheral oxygen saturation, %a | 95 (92-96) |
| Comorbidities and risk factors | |
| Surgery in previous 4 weeks, n (%) | 3 (4.4) |
| Immobilization for >3 days, n (%) | 6 (8.7) |
| Cardiopulmonary disease, n (%) | 22 (31.9) |
| Cerebrovascular disease, n (%) | 4 (5.8) |
| Peripheral artery disease, n (%) | 2 (2.9) |
| Atrial fibrillation, n (%) | 5 (7.3) |
| Hypertension, n (%) | 19 (27.5) |
| Diabetes, n (%) | 6 (7.3) |
| Laboratory parameters | |
| Arterial pH | 7.48±0.05 |
| PaO2, mmHga | 65 (57-79) |
| Log PaO2/FiO2ratio | 2.51±0.01 |
| Log Lactate, mmol/l | 0.22±0.03 (1.7±1.07)b |
| Hemoglobin, g/dl | 12±1.6 |
| CrCl (MDRD), ml/min/1.73 m2 | 85±30.3 |
| Log D-dimers, ng/l | 0.73±0.14 |
| Troponin I, ng/la | 0.04 (0.04-0.07) |
| Log BNP, pg/ml | 2.00±0.11 |
| MDCT scan features | |
| Non-subsegmental PE | 63 (91.3) |
| Clinical scores | |
| sPESI | |
| 1 | 23 (33.3) |
| 2 | 27 (39.1) |
| 3 | 11 (15.9) |
| 4 | 5 (7.3) |
| 5 | 3 (4.4) |
| 6 | 0 (0.0) |
| SI | 0.72±0.21 |
Corresponding non-log values.
BNP: brain natriuretic peptide; CrCl: creatinine clearance; FiO2: fraction of inspired oxygen; MAP: mean arterial pressure; MDCT: multidetector computed tomography; MDRD: Modification of Diet in Renal Disease formula; PaO2: partial pressure of oxygen in arterial blood; PE: pulmonary embolism; SI: Shock Index; sPESI: simplified pulmonary embolism severity index.
The sPESI and SI were calculated for all patients included in the study. As the sPESI incorporates positive cancer history as an adverse prognostic factor for 30-day mortality, all individuals had a sPESI score of at least one point. Almost two-thirds of patients were classified as sPESI ≥2, but only a few had a sPESI score of 4 or 5 (five and three individuals, respectively) and none had a sPESI score of 6. Finally, the SI was within the normal range, with a mean value of 0.7.
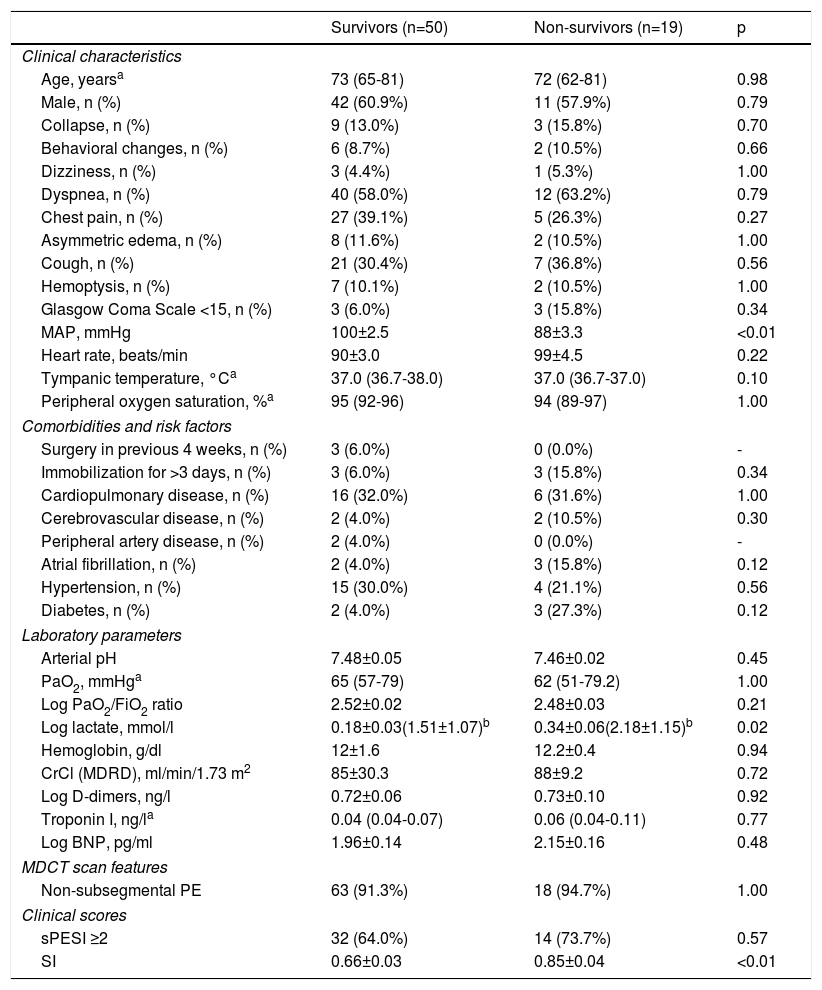
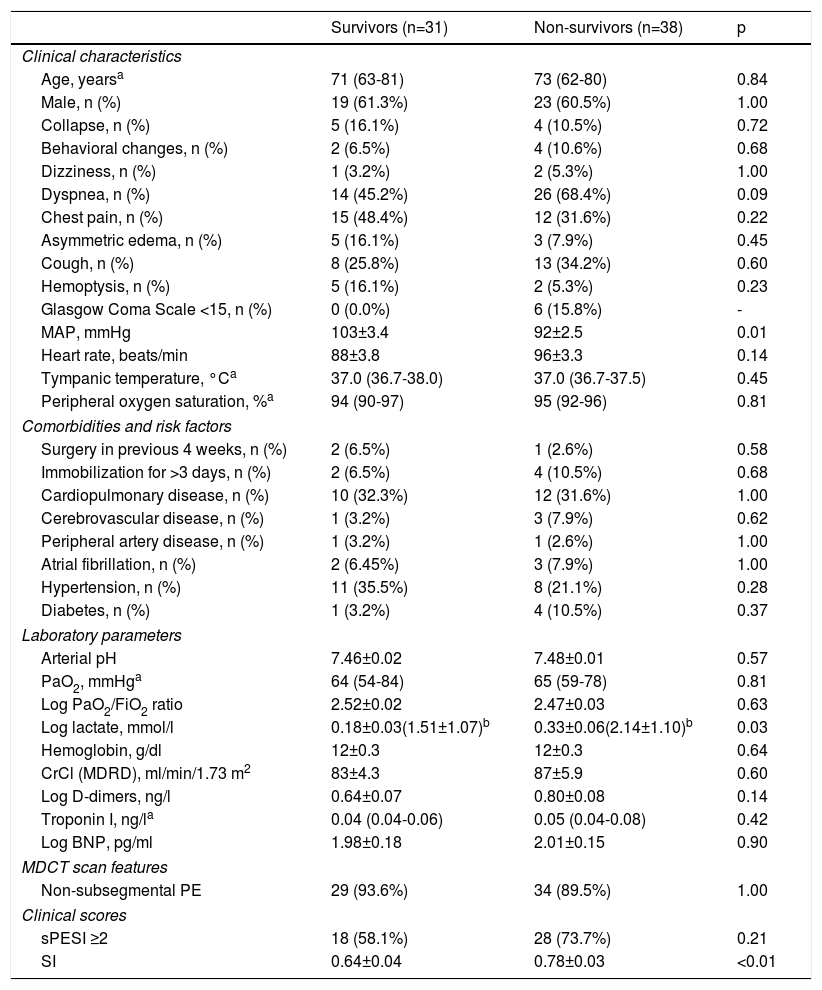
OutcomesTables 2 and 3 summarize the distribution of clinical, laboratory, and imaging features and clinical scores in survivors and non-survivors at 30-day and one-year follow-up, respectively. All-cause mortality was 28% and 55% at 30 days and one year, respectively. There were no significant differences between survivors and non-survivors in baseline characteristics, clinical presentation, comorbidities or presence of additional risk factors for PE beyond cancer. However, MAP was significantly lower in non-survivors than in survivors at 30-day and one-year follow-up: 88±3 mmHg vs. 100±3 mmHg (p<0.01) and 92±2 mmHg vs. 103±3 mmHg (p<0.01), respectively. Lactate levels were also significantly higher in patients who did not survive: at 30-day follow-up, mean log lactate was 0.34±0.06 ng/l in non-survivors vs. 0.18±0.03 ng/l in survivors (p=0.02) (corresponding to a mean lactate value of 2.2±1.2 ng/l vs. 1.5±1.1 ng/l, respectively) and at one-year follow-up, mean log lactate was 0.33±0.06 ng/l in non-survivors vs. 0.18±0.03 ng/l in survivors (p=0.03) (corresponding to a mean lactate value of 2.1±1.1 ng/l vs. 1.5±1.1 ng/l, respectively). There were no other significant differences between the two groups in laboratory parameters, including cardiac biomarker levels, at either 30 days or one year of follow-up.
Clinical, laboratory, and imaging features and clinical scores in survivors and non-survivors at 30 days in cancer patients with acute pulmonary embolism.
| Survivors (n=50) | Non-survivors (n=19) | p | |
|---|---|---|---|
| Clinical characteristics | |||
| Age, yearsa | 73 (65-81) | 72 (62-81) | 0.98 |
| Male, n (%) | 42 (60.9%) | 11 (57.9%) | 0.79 |
| Collapse, n (%) | 9 (13.0%) | 3 (15.8%) | 0.70 |
| Behavioral changes, n (%) | 6 (8.7%) | 2 (10.5%) | 0.66 |
| Dizziness, n (%) | 3 (4.4%) | 1 (5.3%) | 1.00 |
| Dyspnea, n (%) | 40 (58.0%) | 12 (63.2%) | 0.79 |
| Chest pain, n (%) | 27 (39.1%) | 5 (26.3%) | 0.27 |
| Asymmetric edema, n (%) | 8 (11.6%) | 2 (10.5%) | 1.00 |
| Cough, n (%) | 21 (30.4%) | 7 (36.8%) | 0.56 |
| Hemoptysis, n (%) | 7 (10.1%) | 2 (10.5%) | 1.00 |
| Glasgow Coma Scale <15, n (%) | 3 (6.0%) | 3 (15.8%) | 0.34 |
| MAP, mmHg | 100±2.5 | 88±3.3 | <0.01 |
| Heart rate, beats/min | 90±3.0 | 99±4.5 | 0.22 |
| Tympanic temperature, °Ca | 37.0 (36.7-38.0) | 37.0 (36.7-37.0) | 0.10 |
| Peripheral oxygen saturation, %a | 95 (92-96) | 94 (89-97) | 1.00 |
| Comorbidities and risk factors | |||
| Surgery in previous 4 weeks, n (%) | 3 (6.0%) | 0 (0.0%) | - |
| Immobilization for >3 days, n (%) | 3 (6.0%) | 3 (15.8%) | 0.34 |
| Cardiopulmonary disease, n (%) | 16 (32.0%) | 6 (31.6%) | 1.00 |
| Cerebrovascular disease, n (%) | 2 (4.0%) | 2 (10.5%) | 0.30 |
| Peripheral artery disease, n (%) | 2 (4.0%) | 0 (0.0%) | - |
| Atrial fibrillation, n (%) | 2 (4.0%) | 3 (15.8%) | 0.12 |
| Hypertension, n (%) | 15 (30.0%) | 4 (21.1%) | 0.56 |
| Diabetes, n (%) | 2 (4.0%) | 3 (27.3%) | 0.12 |
| Laboratory parameters | |||
| Arterial pH | 7.48±0.05 | 7.46±0.02 | 0.45 |
| PaO2, mmHga | 65 (57-79) | 62 (51-79.2) | 1.00 |
| Log PaO2/FiO2 ratio | 2.52±0.02 | 2.48±0.03 | 0.21 |
| Log lactate, mmol/l | 0.18±0.03(1.51±1.07)b | 0.34±0.06(2.18±1.15)b | 0.02 |
| Hemoglobin, g/dl | 12±1.6 | 12.2±0.4 | 0.94 |
| CrCl (MDRD), ml/min/1.73 m2 | 85±30.3 | 88±9.2 | 0.72 |
| Log D-dimers, ng/l | 0.72±0.06 | 0.73±0.10 | 0.92 |
| Troponin I, ng/la | 0.04 (0.04-0.07) | 0.06 (0.04-0.11) | 0.77 |
| Log BNP, pg/ml | 1.96±0.14 | 2.15±0.16 | 0.48 |
| MDCT scan features | |||
| Non-subsegmental PE | 63 (91.3%) | 18 (94.7%) | 1.00 |
| Clinical scores | |||
| sPESI ≥2 | 32 (64.0%) | 14 (73.7%) | 0.57 |
| SI | 0.66±0.03 | 0.85±0.04 | <0.01 |
Corresponding non-log values.
BNP: brain natriuretic peptide; CrCl: creatinine clearance; FiO2: fraction of inspired oxygen; MAP: mean arterial pressure; MDCT: multidetector computed tomography; MDRD: Modification of Diet in Renal Disease formula; PaO2: partial pressure of oxygen in arterial blood; PE: pulmonary embolism; SI: Shock Index; sPESI: simplified pulmonary embolism severity index.
Clinical, laboratory, and imaging features and clinical scores in survivors and non-survivors at one year in cancer patients with acute pulmonary embolism.
| Survivors (n=31) | Non-survivors (n=38) | p | |
|---|---|---|---|
| Clinical characteristics | |||
| Age, yearsa | 71 (63-81) | 73 (62-80) | 0.84 |
| Male, n (%) | 19 (61.3%) | 23 (60.5%) | 1.00 |
| Collapse, n (%) | 5 (16.1%) | 4 (10.5%) | 0.72 |
| Behavioral changes, n (%) | 2 (6.5%) | 4 (10.6%) | 0.68 |
| Dizziness, n (%) | 1 (3.2%) | 2 (5.3%) | 1.00 |
| Dyspnea, n (%) | 14 (45.2%) | 26 (68.4%) | 0.09 |
| Chest pain, n (%) | 15 (48.4%) | 12 (31.6%) | 0.22 |
| Asymmetric edema, n (%) | 5 (16.1%) | 3 (7.9%) | 0.45 |
| Cough, n (%) | 8 (25.8%) | 13 (34.2%) | 0.60 |
| Hemoptysis, n (%) | 5 (16.1%) | 2 (5.3%) | 0.23 |
| Glasgow Coma Scale <15, n (%) | 0 (0.0%) | 6 (15.8%) | - |
| MAP, mmHg | 103±3.4 | 92±2.5 | 0.01 |
| Heart rate, beats/min | 88±3.8 | 96±3.3 | 0.14 |
| Tympanic temperature, °Ca | 37.0 (36.7-38.0) | 37.0 (36.7-37.5) | 0.45 |
| Peripheral oxygen saturation, %a | 94 (90-97) | 95 (92-96) | 0.81 |
| Comorbidities and risk factors | |||
| Surgery in previous 4 weeks, n (%) | 2 (6.5%) | 1 (2.6%) | 0.58 |
| Immobilization for >3 days, n (%) | 2 (6.5%) | 4 (10.5%) | 0.68 |
| Cardiopulmonary disease, n (%) | 10 (32.3%) | 12 (31.6%) | 1.00 |
| Cerebrovascular disease, n (%) | 1 (3.2%) | 3 (7.9%) | 0.62 |
| Peripheral artery disease, n (%) | 1 (3.2%) | 1 (2.6%) | 1.00 |
| Atrial fibrillation, n (%) | 2 (6.45%) | 3 (7.9%) | 1.00 |
| Hypertension, n (%) | 11 (35.5%) | 8 (21.1%) | 0.28 |
| Diabetes, n (%) | 1 (3.2%) | 4 (10.5%) | 0.37 |
| Laboratory parameters | |||
| Arterial pH | 7.46±0.02 | 7.48±0.01 | 0.57 |
| PaO2, mmHga | 64 (54-84) | 65 (59-78) | 0.81 |
| Log PaO2/FiO2 ratio | 2.52±0.02 | 2.47±0.03 | 0.63 |
| Log lactate, mmol/l | 0.18±0.03(1.51±1.07)b | 0.33±0.06(2.14±1.10)b | 0.03 |
| Hemoglobin, g/dl | 12±0.3 | 12±0.3 | 0.64 |
| CrCl (MDRD), ml/min/1.73 m2 | 83±4.3 | 87±5.9 | 0.60 |
| Log D-dimers, ng/l | 0.64±0.07 | 0.80±0.08 | 0.14 |
| Troponin I, ng/la | 0.04 (0.04-0.06) | 0.05 (0.04-0.08) | 0.42 |
| Log BNP, pg/ml | 1.98±0.18 | 2.01±0.15 | 0.90 |
| MDCT scan features | |||
| Non-subsegmental PE | 29 (93.6%) | 34 (89.5%) | 1.00 |
| Clinical scores | |||
| sPESI ≥2 | 18 (58.1%) | 28 (73.7%) | 0.21 |
| SI | 0.64±0.04 | 0.78±0.03 | <0.01 |
Corresponding non-log values.
BNP: brain natriuretic peptide; CrCl: creatinine clearance; FiO2: fraction of inspired oxygen; MAP: mean arterial pressure; MDCT: multidetector computed tomography; MDRD: Modification of Diet in Renal Disease formula; PaO2: partial pressure of oxygen in arterial blood; PE: pulmonary embolism; SI: Shock Index; sPESI: simplified pulmonary embolism severity index.
In terms of clinical scores, the presence of at least one additional adverse factor beyond history of cancer in the sPESI (sPESI ≥2) was not associated with increased mortality at 30-day and one-year follow-up. However, the SI was significantly different between survivors and non-survivors at 30 days (0.7±0.03 vs. 0.9±0.04, p<0.01) and one year (0.6±0.04 vs. 0.8±0.03, p<0.01), although mean heart rate did not differ between the two groups in either follow-up period.
A ROC curve analysis was performed to select the most suitable cut-off of the SI (highest sensitivity while assuring acceptable specificity) to predict the primary endpoint. The SI had a good discriminatory ability to predict 30-day and one-year all-cause mortality, with an area under the curve of 0.76 (95% CI: 0.63-0.89; p<0.01) and 0.70 (95% CI: 0.57-0.82; p<0.01), respectively. The best cut-off of the SI to predict both 30-day (sensitivity 90%, specificity 52%) and one-year mortality (sensitivity 71%, specificity 65%) was 0.7.
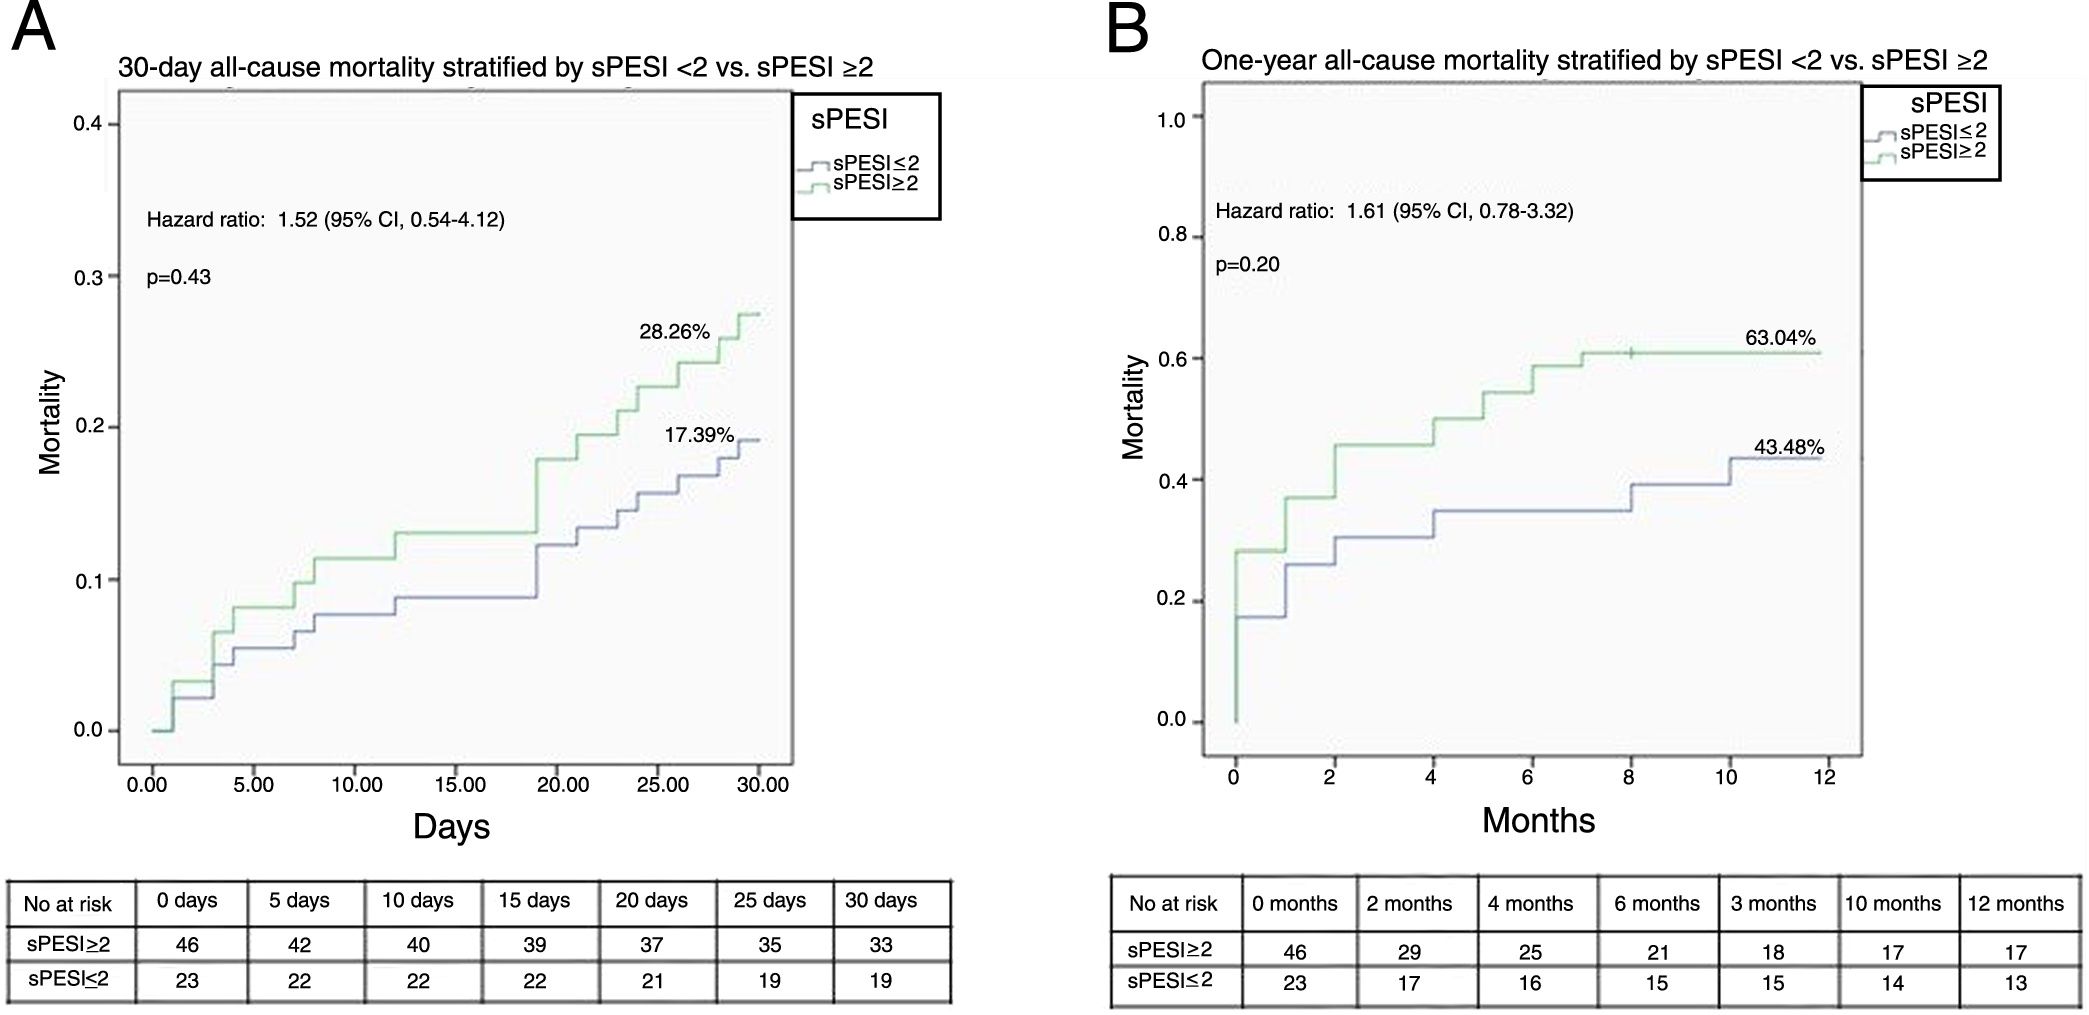
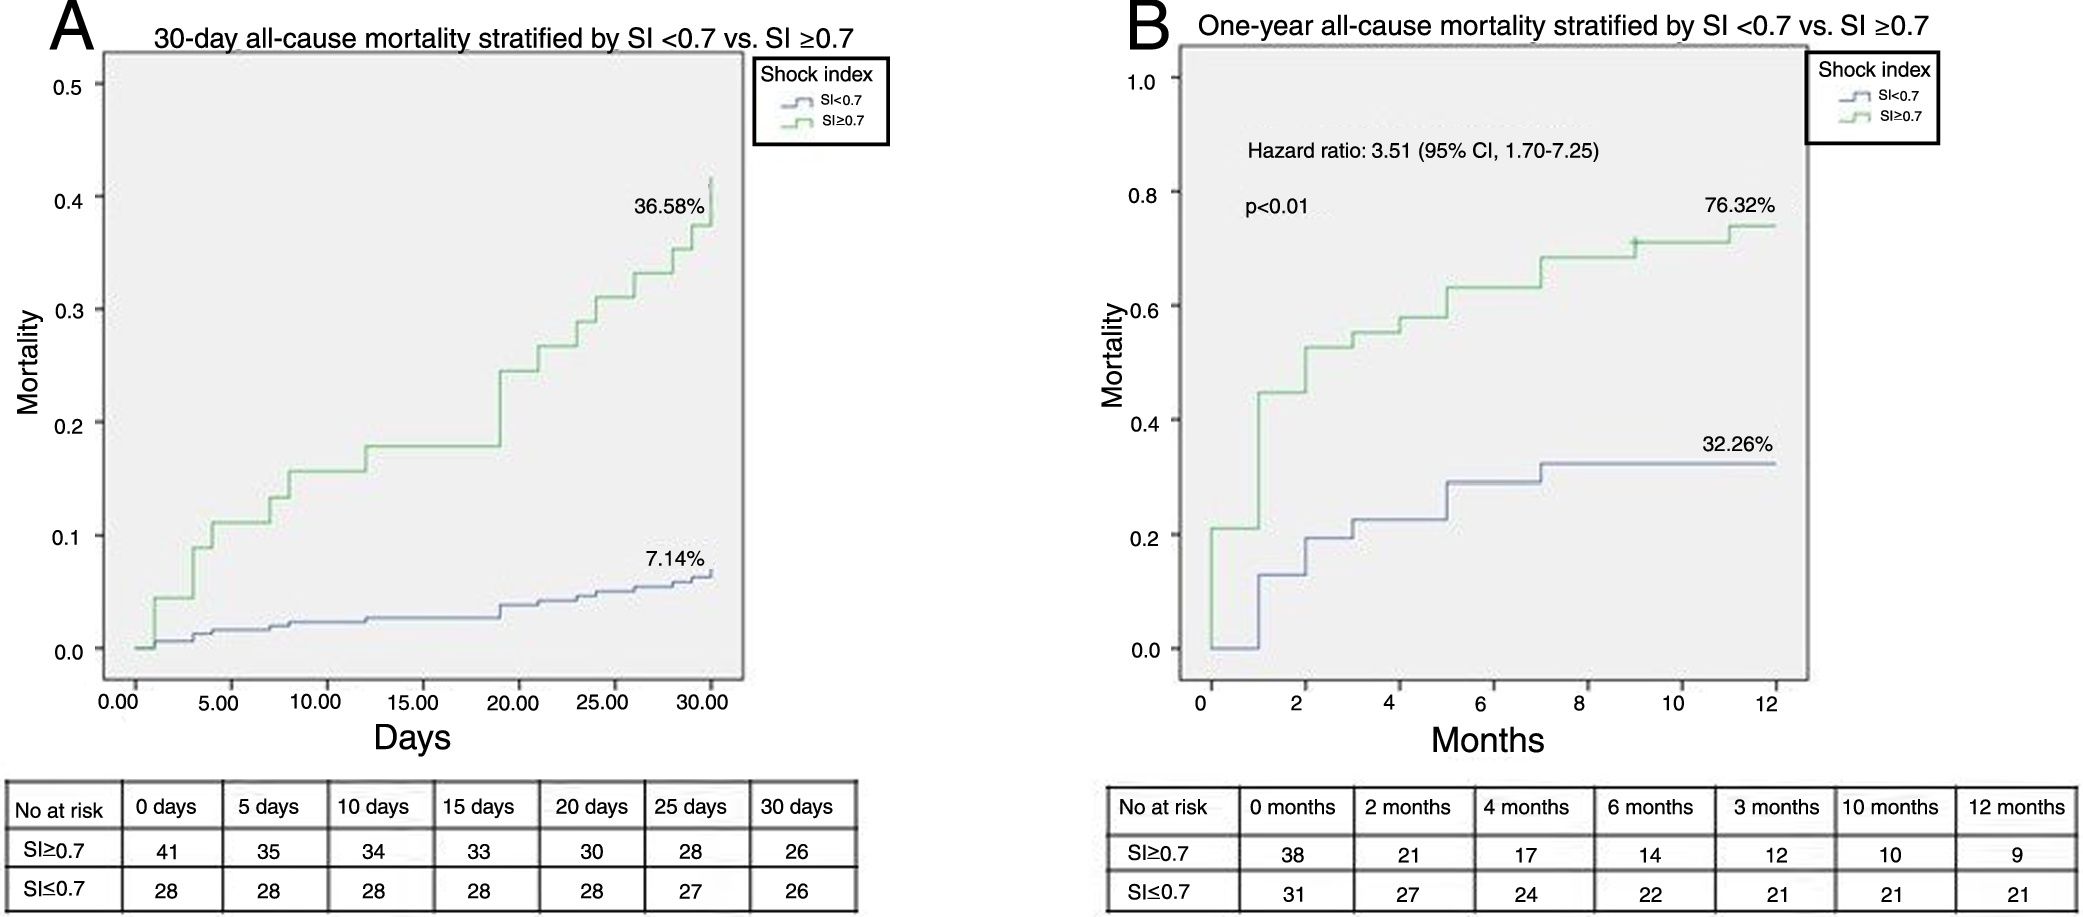
Figures 2A and B illustrate the survival analysis for 30-day and one-year follow-up, stratified by sPESI <2 (blue line) and sPESI ≥2 (green line). There was no significant difference in the overall survival distribution between the groups for 30-day (17% vs. 28%, chi-square (1) 0.64, p=0.42) and one-year follow-up (43% vs. 53%, chi-square (1) 1.94, p=0.16). Figures 3A and B show survival analysis stratified by the best cut-off of the SI (0.7). Thirty-day and one-year mortality were significantly lower in patients with SI <0.7 than in those with a higher SI (7% vs. 37%, chi-square (1) 9.63, p<0.01 and 32% vs.76%, chi-square (1) 3.01, p<0.01, respectively). The hazard ratio of SI ≥0.7 was 7.20 (95% CI, 1.66-31.21, p<0.01) for 30-day all-cause mortality and 3.51 (95% CI, 1.70-7.25, p<0.01) for one-year all-cause mortality.
. Hazard ratios are for patients with sPESI ≥2. sPESI: simplified Pulmonary Embolism Severity Index.")
. Event rates were based on Kaplan-Meier estimates in time-to-first-event analyses. Hazard ratios are for patients with SI ≥0.7.")
According to the 2014 ESC guidelines on the diagnosis and management of acute PE, a clinical risk prediction score, preferably the PESI or sPESI, should be used in non-high risk patients (absence of shock or persistent hypotension) to distinguish between low- and intermediate-risk PE.1
Although the sPESI classifies all hemodynamically stable cancer patients with PE as at intermediate risk, mortality in this subset of individuals is high.8–11 Data from our study confirm a high all-cause mortality rate in normotensive cancer patients presenting to the ED with acute PE (27.54% and 55.07% at 30 days and one year, respectively). It is unclear whether this high mortality is due to VTE and its sequelae, or to the characteristics of the malignancy (type or stage of cancer, or a more aggressive disease course when associated with VTE), or to both.12–16 In fact, the predictors of mortality in cancer patients with PE remain largely unknown. It is interesting that, although our study included exclusively normotensive cancer individuals with acute PE, only clinical (mean blood pressure and SI) and laboratory (lactate level) parameters associated with the patients’ hemodynamic state were predictors of 30-day and one-year all-cause mortality. It is also important to note that overall, MAP, SI and mean log lactate levels were within the normal range in both survivors and non-survivors at 30-day and one-year follow-up. According to our data, in this population at high risk for adverse outcomes, lower mean blood pressure or higher SI or even higher lactate levels, even if within normal ranges, may be associated with significantly worse short- and long-term prognosis. Furthermore, exposure to temporary risk factors for acute PE, such as recent bed rest or surgery, was generally low in our population. This may be consistent with the idea that cancer by itself is a strong risk factor for acute PE.
Current guidelines recommend that intermediate-risk patients should be classified as intermediate-low or intermediate-high risk according to assessment of right ventricular function and myocardial injury.1 However, imaging tests and cardiac laboratory biomarkers may not be available in many EDs, and if they are, it usually takes time to obtain the results. Also, a recent study found that the performance of five scores (PESI, sPESI, GPS, POMPE, and RIETE) could not be relied on to predict 30-day mortality in cancer patients with symptomatic acute PE.17 This is in line with our findings, according to which an additional adverse factor beyond cancer in the sPESI (i.e. sPESI ≥2) could not accurately predict 30-day and one-year all-cause mortality in our population. As shown in Tables 2 and 3, sPESI ≥2 was commonly found among both survivors and non-survivors at 30-day and one-year follow-up in our study. This implies that the sPESI may lack sufficient specificity to predict either 30-day or one-year all-cause mortality in cancer patients with acute PE (a population with a very high rate of adverse events during short- and long-term follow-up).
Therefore, given the dismal prognosis of normotensive cancer patients with acute PE, a clinical score that met the following requirements would be extremely useful: ease of calculation; inclusion of clinical variables only, so it could be used immediately, at first medical contact in the ED, without the need to wait for test results; and good performance for both short- and long-term prognosis. The SI meets some of these requirements, as it relies solely on clinical variables (heart rate and systolic blood pressure) and can be employed universally in all EDs at first medical contact. Moreover, our study showed that it can accurately and independently predict both short- and long-term all-cause mortality in normotensive cancer patients with acute PE. It should be noted that in our population, MAP and heart rate were within the normal range, and mean heart rate was not significantly different in survivors and non-survivors at 30-day and one-year follow-up. The authors hypothesize that the SI with a cut-off of 0.7 may disclose inadequate hemodynamic response to acute PE which, even if not sufficiently severe to cause shock or persistent hypotension, is associated with a poor prognosis, significantly increasing all-cause 30-day and one-year mortality. To our knowledge, this is the first article reporting the value of the SI as an independent and accurate predictor of 30-day and one-year all-cause mortality in normotensive cancer patients with acute symptomatic PE.
Finally, a recent study has shown that the SI and elevated cardiac troponin provide important clues for predicting all-cause mortality in normotensive patients with acute PE.18 In our work, cardiac biomarker levels were not significantly different between survivors and non-survivors at 30-day and one-year follow-up. As shown in Tables 2 and 3, a clear majority of patients included in our study had troponin I and BNP levels within the normal range, and therefore the impact of elevated cardiac biomarkers on the short- and long-term prognosis of these individuals could not be adequately assessed in this study.
LimitationsOur study is limited by its retrospective design and the small number of patients included. However, it reflects a real-world cancer population admitted to the ED of a tertiary care hospital with hemodynamic stable acute PE confirmed by MDCT. Selection bias was avoided by including all consecutive normotensive cancer patients with objectively confirmed PE. Although all-cause mortality may be considered a reasonable endpoint to gauge the consequences of PE in cancer patients, other important endpoints such as PE-related mortality, recurrence of VTE and bleeding complications during follow-up were not assessed by this work. Furthermore, we were unable to assess the possible effect of adequacy of anticoagulation on clinical outcome, since detailed information on this issue was not systematically recorded. Finally, data on cancer type, site and stage and on anti-tumor therapies were not collected in our registry. While these data might not have a strong impact on 30-day all-cause mortality, they can be expected to affect long-term survival.
ConclusionsThis is the first article to report the value of the SI as an accurate predictor of 30-day and one-year all-cause mortality in normotensive cancer patients with symptomatic PE.
External validation of the present study's findings in a multicenter prospective cohort is necessary to confirm the usefulness of this user-friendly and readily available clinical tool for accurate short- and long-term risk stratification after symptomatic PE without hemodynamic compromise in cancer patients.
Conflicts of interestThe authors have no conflicts of interest to declare.
